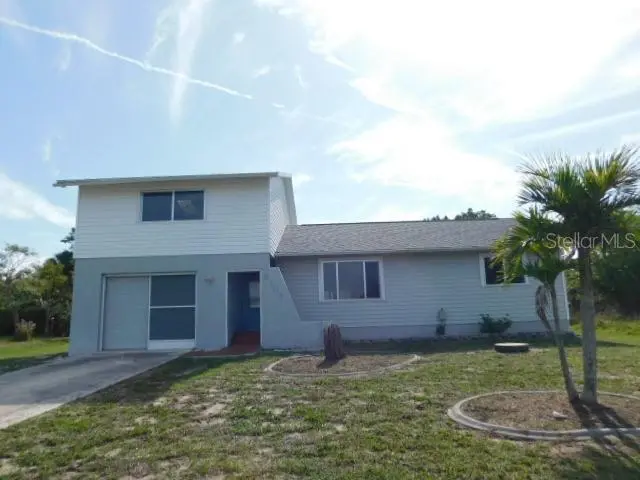
5104 Silver Bell Dr · Port Charlotte, FL
Flood risk 9/10 · Severe
- FEMA flood zone
- AE
- Chance of flooding over 30 yrs
- 0.99%
- Est. flood insurance / yr
- $1,737 – $8,500
Fire risk 1/10 · Minimal
- Est. fire insurance / yr
- $947 – $1,759
Heat risk 10/10 · Severe
- Hot days now (above 107°F)
- 7 days/yr
- Hot days in 30 yrs
- 28 days/yr
Wind risk 10/10 · Severe
- Chance of severe wind over 30 yrs
- 99.0%
Air-quality risk 3/10 · Minor
- Unhealthy air days now
- 2 days/yr
- Unhealthy air days in 30 yrs
- 2 days/yr
Risk factors via First Street. Map © Google.
Why this score? — see what drove the B- grade
The composite is a weighted blend of 9 inputs, each scored 0–100. Each bar is that input's sub-score; the figure is the points it added to the 100-point composite (weight × sub-score).
- Cash flow +30.0/30.0
- 1% rule +10.0/10.0
- DSCR +10.0/10.0
- ARV discount +7.5/15.0
- Schools +4.6/10.0
- Livability +3.2/5.0
- Condition / age +2.5/5.0
- Rent growth +2.1/5.0
- Appreciation +0.0/10.0
$175,000
🖨 Deal sheet (PDF) 📄 Offer letter ✓ Due diligence
Listing remarks
Spacious home with 3 bedrooms, 2 baths and a bonus room. Dining room with french doors that lead to the screened back porch. Buyer is advised to have complete and thorough inspections done and to verify all information. Seller/Agents have no knowledge of property conditions. Being Sold As-Is.
Key facts
- 0.23 acre lot
- Built 1986
- Listed 25 days
Property features AI
Finance
- Other: Property type: Single Family Residence; Zoning: RSF3.5; Total building area about 2004 square feet (per public records); Living area about 1482 square feet (per public records); Lot size about 0.23 acres; Property is unfurnished; No CDD; No waterfront or water access; Directions: Edgewater Dr. North to left on Midway Blvd., right on Ohara Rd., left on Silver Bell Dr.
- HOA & community: No HOA/association indicated
Exterior
- Utilities: Public water; Public sewer; Electricity connected
- Home design: Single family residence; Residential property; Two stories; Faces north; Entry level information not provided
- Construction: Vinyl siding and frame construction; Shingle roof; Slab foundation; Built using standard residential construction materials
- Exterior features: Paved road access; Lot about 0.23 acre
Interior
- Kitchen: Dishwasher; Microwave; Range; Refrigerator
- Bedrooms: 3 bedrooms
- Flooring: Carpet; Laminate
- Bathrooms: 2 full bathrooms
- Heating & cooling: Central heating; Central air conditioning
- Interior features: Cathedral ceilings; Ceiling fans
- Laundry & utility: Laundry inside
Neighborhood map
What this means for you Summary
Snapshot
- This is a 3-bed/2.0-bath single-family listed at $175k.
Deal economics
- At list price, monthly cash flow is $469 ($6k/yr) — positive.
- The deal already cash-flows at list — no discount required.
- Meets the 1% rule at list price ($3k rent vs $175k).
- Recommended offer: $172k (1.5% below list) — sets the bar for market timing.
- Cap rate 12.4% vs local median 4.4% in Port Charlotte — top-decile yield for the area; either an underpriced asset or a hidden risk that comps aren't pricing in. Stress-test before assuming the spread holds.
Location & tenants
- Location reads 65/100 on livability (#655 in FL) — a middle-class / working-renter tenant base. Strengths: cost of living A+, housing A+; Watch: employment D, amenities F, commute F.
- Charlotte (suburban): math 54% / reading 54% proficiency, ranked #22 of 73 in FL (top 30%) — acceptable for families but not a draw, mixed tenant base, ~2y average lease.
- Zoned schools: Meadow Park Elementary School (math 61% / reading 56%, grade B-, #735 of 2,144 statewide, top 35%, 701 students, 59% FRL); Murdock Middle School (math 50% / reading 45%, grade C-, #288 of 571 statewide, top 51%, 577 students, 56% FRL); Port Charlotte High School (math 23% / reading 38%, grade F, #434 of 667 statewide, top 66%, 1,649 students, 43% FRL) — zoned schools at 53% FRL track the district average.
- Market conditions: Rents soft (-1.6%/yr); 964 active listings in the ZIP; 22 comparable units currently listed for rent nearby; rentals at typical pace (median 24d on market — plan ~3-4 weeks tenant-placement turnaround); 4,585 units permitted in Charlotte County in 2024 (703 in 5+ unit buildings).
- At $2,827/mo this rent would consume 54% of the median local household income ($63k/yr) (locally 501% of renters already pay >50% of income on rent) — very limited rent-growth headroom before tenants either downsize or default.
Forward outlook
- Local home prices are declining (-3.0%/yr); year-one equity from $1k of loan paydown is wiped out by about $5k of value loss. Plan a longer hold.
- Charlotte County population projected at +24% by 2050 — long-run rental-demand tailwind backs the buy-and-hold thesis.
Negotiation context
- It's been on market 25 days — a 2% lower offer ($172k) is reasonable based on typical stale-listing flexibility.
- 6 sale attempts since 6y ago with the ask held roughly flat each time — persistent listings suggest the price (not the market) is what's stuck; bring a comps-based counter.
Risks & watch-outs
- Watch-outs: flood insurance adds $427/mo.
- Climate carrying-cost: in FEMA flood zone AE (mandatory federal flood insurance); severe wind risk, 99% chance of damaging wind over 30y; extreme-heat days projected 7→28/yr by 2055 (HVAC capex compounding) — expect insurance premiums to compound above CPI over the hold.
Questions for the listing agent
- What's the actual annual flood-insurance premium (NFIP or private), and is the property in a SFHA with mandatory coverage?
- Is there a deadline driving the sale (1031 exchange, divorce, estate, relocation)? That informs how much negotiation room exists.
- Schools are D-rated, which usually means shorter tenancies and higher turnover. Who's the typical renter profile here, and what's been the actual vacancy rate?
- What's the average days-on-market for RENTAL listings here right now (not sales)? A rising rental-DOM trend means longer vacancies and softer asking-rent achievability than the comps imply.
- What's the recent tenant-quality profile in this submarket — average credit score on applications, eviction rate, late-payment / NSF rate, and stable-employment percentage? A property-management company in the area should have these aggregated.
- How much new for-sale + rental construction is in the pipeline within 1–3 miles? Heavy new supply typically softens prices + rents 12–24 months out; constrained supply supports both.
Investment metrics
- 1% rule
- 1.62% ✓
- Cap rate
- 12.43%
- Cash-on-cash
- 21.93%
- DSCR
- 1.98
- GRM
- 5.2
CMA / ARV
- ARV (on-the-fly)
- $386,802
- Comps found
- 9
Show comp detail 9 sales within ~0.75 mi
| Address | Dist | Beds/Ba | Sqft | Sold | Price | $/sf | Match |
|---|---|---|---|---|---|---|---|
| 5121 Chaves Cir | 0.14mi | 3/2.0 | 1,336 (-10%) | 6mo | $183,980 | $138 | 72 |
| 19220 Moore Haven Ct | 0.44mi | 3/2.0 | 1,401 (-6%) | 1mo | $367,500 | $262 | 69 |
| 18671 Arapahoe Cir | 0.39mi | 3/2.0 | 1,453 (-2%) | 18mo | $299,000 | $206 | 63 |
| 18486 Briggs Cir | 0.41mi | 3/2.0 | 1,430 (-4%) | 15mo | $360,000 | $252 | 63 |
| 18698 Ashcroft Cir | 0.12mi | 3/2.0 | 1,666 (+12%) | 19mo | $251,000 | $151 | 58 |
| 4334 Wynkoop Cir | 0.63mi | 2/2.0 (-1) | 1,436 (-3%) | 10mo | $375,000 | $261 | 52 |
| 19179 Aviation Ct | 0.41mi | 3/2.0 | 1,700 (+15%) | 14mo | $600,000 | $353 | 44 |
| 18502 Arapahoe Cir | 0.51mi | 3/2.0 | 1,677 (+13%) | 14mo | $610,000 | $364 | 42 |
| 18361 Hottelet Cir | 0.64mi | 2/2.0 (-1) | 1,288 (-13%) | 4mo | $525,000 | $408 | 40 |
Match score weights: distance 35% · size 25% · config 20% · recency 20%. Top-matched comps best support the ARV.
Projected returns pro-forma
-3.0% appreciation · 0.0% rent growth · sell at horizon
- IRR
- -3.6%
- Equity multiple
- 0.87×
- Total profit
- $-6,384
- Equity at exit
- $26,093
- IRR
- 0.9%
- Equity multiple
- 1.05×
- Total profit
- $2,449
- Equity at exit
- $15,131
Cash invested: $49,000 (down + closing). Projections, not guarantees.
Landlord ↔ Tenant lean methodology
- Overall (STATE)
- 87 Strongly Landlord-Friendly
- State Florida
- 87 Strongly Landlord-Friendly · R+3
- County
- — inherits STATE
- City
- — inherits STATE
ZIP-level market 33948
- Home prices YoY
- -14.9%
- Rents YoY
- -1.6%
- Active inventory
- 964
- Price-to-rent
- 5.2×
Monthly cashflow live
- Estimated rent
- $2,827 high interval (Pro) →
- Mortgage (P&I)
- −$918
- Tax from tax record
- −$347 /mo · $4,169/yr
- Insurance
- −$73
- Flood insurance flood zone
- −$427 /mo · $5,118/yr
- HOA
- −$0
- Lot rent
- −$0
- Vacancy / Maint / Mgmt
- −$594
- Net cashflow
- $469
Break-even live
Sensitivity live
| Price | -10% $568 | -5% $519 | +0% $469 | +5% $420 | +10% $370 |
|---|---|---|---|---|---|
| Rent | -10% $246 | -5% $357 | +0% $469 | +5% $581 | +10% $692 |
| Rate | -1.0pp $557 | -0.5pp $514 | base $469 | +0.5pp $424 | +1.0pp $378 |
UW: 25.0% down · 7.5% · 30yr · 1.5% tax · 5.0% vac · 8.0% maint · 8.0% mgmt
Financing live
Cash to close
- Down payment
- $43,750
- Closing costs
- $5,250
- Reserves months
- —
- Total cash needed
- —
Loan-product check · same deal, 3 products live
Conventional
25% down · 7.5% · 30yr
- Down + closing
- —
- Monthly P&I
- —
- Monthly cashflow
- —
- DSCR
- —
- Eligible?
- —
Personal DTI + credit; lowest rate.
DSCR
20% down · 8.5% · 30yr
- Down + closing
- —
- Monthly P&I
- —
- Monthly cashflow
- —
- DSCR
- —
- Eligible?
- —
No personal income docs; deal must DSCR.
Hard money
10% down · 12.0% · 12mo
- Down + closing
- —
- Monthly P&I
- —
- Monthly cashflow
- —
- DSCR
- —
- Eligible?
- —
Short-term bridge; refi at stabilization.
Rent comps 22 comps
| Address | Beds | Baths | Sqft | Rent | $/sqft | DOM | Units | Dist |
|---|---|---|---|---|---|---|---|---|
| 18810 Ashcroft Cir Port Charlotte, FL | 3.0 | 2.0 | 1387 | $3,800 | $2.74 | 23d | 1 | 0.11mi |
| 5081 Administration St Port Charlotte, FL | 2.0 | 1.0 | 900 | $1,500 | $1.67 | 23d | 1 | 0.26mi |
| 4670 Herman Cir Port Charlotte, FL | 3.0 | 2.0 | 1350 | $2,200 | $1.63 | 23d | 1 | 0.28mi |
| 18686 Van Nuys Cir Port Charlotte, FL | 3.0 | 2.0 | 1168 | $1,600 | $1.37 | 23d | 1 | 0.44mi |
| 18634 Goodman Cir Port Charlotte, FL | 3.0 | 1.5 | 1182 | $1,700 | $1.44 | 16d | 1 | 0.55mi |
| 4518 Wynkoop Cir Port Charlotte, FL | 2.0 | 2.0 | 1409 | $1,995 | $1.42 | 16d | 1 | 0.64mi |
| 18310 Burkholder Cir Port Charlotte, FL | 3.0 | 2.0 | 1753 | $3,250 | $1.85 | 23d | 1 | 0.67mi |
| 18493 Lake Worth Blvd Port Charlotte, FL | 2.0 | 2.0 | 1006 | $1,500 | $1.49 | 23d | 1 | 0.71mi |
| 4342 Ewing Cir Port Charlotte, FL | 3.0 | 2.0 | 1260 | $2,500 | $1.98 | 23d | 1 | 0.72mi |
| 4399 Mundella Cir Port Charlotte, FL | 3.0 | 2.0 | 1140 | $3,200 | $2.81 | 23d | 1 | 0.81mi |
| 18625 Alphonse Cir Port Charlotte, FL | 2.0 | 2.0 | 960 | $4,000 | $4.17 | 23d | 1 | 0.82mi |
| 18608 Alphonse Cir Port Charlotte, FL | 3.0 | 2.0 | 1441 | $4,000 | $2.78 | 23d | 1 | 0.84mi |
| 18058 Avonsdale Cir Port Charlotte, FL | 3.0 | 2.0 | 1453 | $4,000 | $2.75 | 23d | 1 | 0.89mi |
| 18289 Wolbrette Cir Port Charlotte, FL | 2.0 | 2.0 | 1393 | $4,000 | $2.87 | 23d | 1 | 0.90mi |
| 18019 Avonsdale Cir Port Charlotte, FL | 3.0 | 2.0 | 1202 | $1,900 | $1.58 | 23d | 1 | 0.96mi |
| 18312 Driggers Ave Port Charlotte, FL | 3.0 | 2.0 | 1428 | $5,400 | $3.78 | 23d | 1 | 0.99mi |
| 4123 Michel Tree St Port Charlotte, FL | 3.0 | 2.0 | 920 | $1,750 | $1.90 | 23d | 1 | 0.99mi |
| 4192 Gingold St Port Charlotte, FL | 3.0 | 2.0 | 1127 | $4,200 | $3.73 | 23d | 1 | 1.03mi |
| 4112 Gingold St Port Charlotte, FL | 2.0 | 1.5 | 1056 | $3,300 | $3.12 | 23d | 1 | 1.05mi |
| 18522 Robinson Ave Port Charlotte, FL | 3.0 | 2.0 | 1252 | $2,000 | $1.60 | 23d | 1 | 1.18mi |
| 4306 Joseph St Port Charlotte, FL | 4.0 | 2.0 | 1636 | $2,600 | $1.59 | 16d | 1 | 1.38mi |
| 18353 Grace Ave Port Charlotte, FL | 3.0 | 2.0 | 1658 | $2,100 | $1.27 | 23d | 1 | 1.49mi |
Listing history 19 events
-
2026-05-11status Pending
-
2026-04-28status Active
-
2026-04-26status Pending
-
2026-04-14$175,000 Active
-
2025-12-31historical
-
2025-03-11$255,000 Active
-
2024-12-30historical
-
2024-11-06price $259,900
-
2024-09-09price $275,000
-
2024-08-04price $279,900
-
2024-06-18$289,900 Active
-
2020-12-07soldstatus $235,000
-
2020-12-04soldstatus $235,000 Sold
-
2020-10-19status Pending
-
2020-10-16$259,000 Active
-
2020-08-28soldstatus $121,000 Sold
-
2020-08-07status Pending
-
2020-07-02$135,000 Active
-
1997-10-03soldstatus $77,000
ⓘ Source: listings_history table (triggers on properties + properties_extension) + one-shot
backfill from property_details.listing_events for pre-trigger history.
Tax reassessment forecast FL · Resets to sale price
- Current annual tax
- $4,169 · $347/mo
- Projected year-2 tax
- $4,169 · $347/mo
- Expected delta
- $0/yr ($0/mo · 0.0%)
ⓘ Screening estimate from a state-policy table — verify with the county assessor before closing.
Climate risk First Street
- Flood 9/10 Extreme FEMA zone AE · 99% chance over 30 yrs
- Wildfire 1/10 Low
- Heat 10/10 Extreme 7 d/yr ≥107°F today · 28 d/yr by 30 yrs out
- Wind 10/10 Extreme 99% chance of damaging wind over 30 yrs
- Air quality 3/10 Moderate 2 unhealthy d/yr today · 2 by 30 yrs out
Nearby sold comps map
Loading sold comps map…
Walkable amenities ~0.75 mi
Loading nearby amenities…
Taxation est. · year 1
- Rental income
- $33,929
- − Mortgage interest
- −$9,803
- − Property taxes
- −$4,169
- − Insurance
- −$5,994
- − Repairs & maintenance
- −$2,714
- − Management
- −$2,714
- − Depreciation
- −$5,091
- Taxable income
- $3,444
- Est. tax owed @ 24.0%
- −$827
- After-tax cash flow
- $4,802/yr
For passive investors: Depreciation is non-cash, so a rental often shows a tax loss while cash-flowing — sheltering income. Rental losses are passive: they offset passive income freely, and up to $25,000/yr can offset ordinary (W-2) income if you actively participate and your MAGI is under $100k (phasing out to $0 by $150k); unused losses carry forward. On sale, claimed depreciation is recaptured at up to 25%, and gains may owe capital-gains tax (a 1031 exchange can defer both). Figures are a year-1 estimate at your 24.0% rate — not tax advice; consult a CPA.
Schools (NCES district)
- District
- Charlotte
- NCES district ID
- 1200240
- Math proficiency
- 54% ▼ -6.00%
- Reading proficiency
- 54% ▼ -1.00%
- Median HH income
- $44,864
- Composite
- 45.62/100
- National rank
- #2586
- State rank
- #22 of 73 in FL
Livability — Port Charlotte
- Score
- 65/100
- State rank
- #655
- US rank
- #13081
Category grades
Schools grade is shown separately in the Schools card above.
Census & demographics
- Census place
- Port Charlotte, FL
- County
- Charlotte County · 196,994 people
- City population
- 102,180
- Metro
- Punta Gorda, FL
- Population (ZIP)
- 18,696
- Household income
- $62,744
- Rent vs Own
- Severe rent burden
- 501.0
Population outlook (Charlotte County) Hauer SSP2
- Today (2025)
- 198,646 people
- By 2030
- 210,507 · +6.0%
- By 2040
- 230,857 · +16.2%
- By 2050
- 247,148 · +24.4%
- By 2075
- 281,777 · +41.8%
- By 2100
- 293,609 · +47.8%
Race, ethnicity, and origin ACS 2023
- Neighborhood character
- Predominantly White (79%)
- Race & ethnicity
- White 79% Two or more races 8% Black 7% Hispanic / Latino 7% Asian 2%
- Hispanic origin (detail)
- Mexican 2% Puerto Rican 1%
- Common ancestry
- Lithuanian 5% Romanian 4% Iranian 2%
- Foreign-born
- 11% · Canada
- Languages at home
- 88% English-only · Spanish 5% Russian/Polish/Slavic 2% Other Indo-European 1%
Political lean MEDSL · Charlotte
- 2024 margin
- Solid R (+34.0) · D 32.7% · R 66.7%
- 2008→2024 swing
- -26.7pp toward R · 2008: -7.2pp · 2024: -34.0pp
- All cycles
- 2024: R+34.0 2020: R+26.6 2016: R+27.8 2012: R+14.3 2008: R+7.2
Not yet ingested
- Civics
- —
Market trends
- HPI YoY
- ▼ -55.31%
- Current HPI
- 315.0548
- Rent YoY
- ▼ -1.63%
- Metro
- Punta Gorda, FL
- State GDP YoY
- ▲ 3.28%
- F500 in state
- 36
Industry mix (Fortune 500 HQ in FL)
| Industry | F500 HQs | Revenue |
|---|---|---|
| Industrial Technology | 2 | $29B |
|
||
| Insurance | 2 | $17B |
|
||
| Retail | 1 | $60B |
|
||
| Technology Distribution | 1 | $58B |
|
||
| Homebuilding | 1 | $35B |
|
||
| Technology Manufacturing | 1 | $35B |
|
||
Price history
+127.3% since first listed19 events — show timeline
- 2026-05-11 Pending — Stellar MLS as Distributed by MLS Grid
- 2026-04-28 Relisted — Stellar MLS as Distributed by MLS Grid
- 2026-04-26 Pending — Stellar MLS as Distributed by MLS Grid
- 2026-04-14 Listed $175,000 Stellar MLS as Distributed by MLS Grid
- 2025-12-31 Listing Removed — Stellar MLS as Distributed by MLS Grid
- 2025-03-11 Listed $255,000 Stellar MLS as Distributed by MLS Grid
- 2024-12-30 Listing Removed — Stellar MLS as Distributed by MLS Grid
- 2024-11-06 Price Changed $259,900 Stellar MLS as Distributed by MLS Grid
- 2024-09-09 Price Changed $275,000 Stellar MLS as Distributed by MLS Grid
- 2024-08-04 Price Changed $279,900 Stellar MLS as Distributed by MLS Grid
- 2024-06-18 Listed $289,900 Stellar MLS as Distributed by MLS Grid
- 2020-12-07 Sold (Public Records) $235,000 Public Records
- 2020-12-04 Sold (MLS) $235,000 Stellar MLS as Distributed by MLS Grid
- 2020-10-19 Pending — Stellar MLS as Distributed by MLS Grid
- 2020-10-16 Listed $259,000 Stellar MLS as Distributed by MLS Grid
- 2020-08-28 Sold (MLS) $121,000 Stellar MLS as Distributed by MLS Grid
- 2020-08-07 Pending — Stellar MLS as Distributed by MLS Grid
- 2020-07-02 Listed $135,000 Stellar MLS as Distributed by MLS Grid
- 1997-10-03 Sold (Public Records) $77,000 Public Records
Property tax history
+12.7%/yrLatest (2025): $4,169 · +446.7% YoY. Source: county tax records.
Cash-flow waterfall
monthlySold comps — $/sqft
last 12 mo · ≤1 miLoading sold comps…