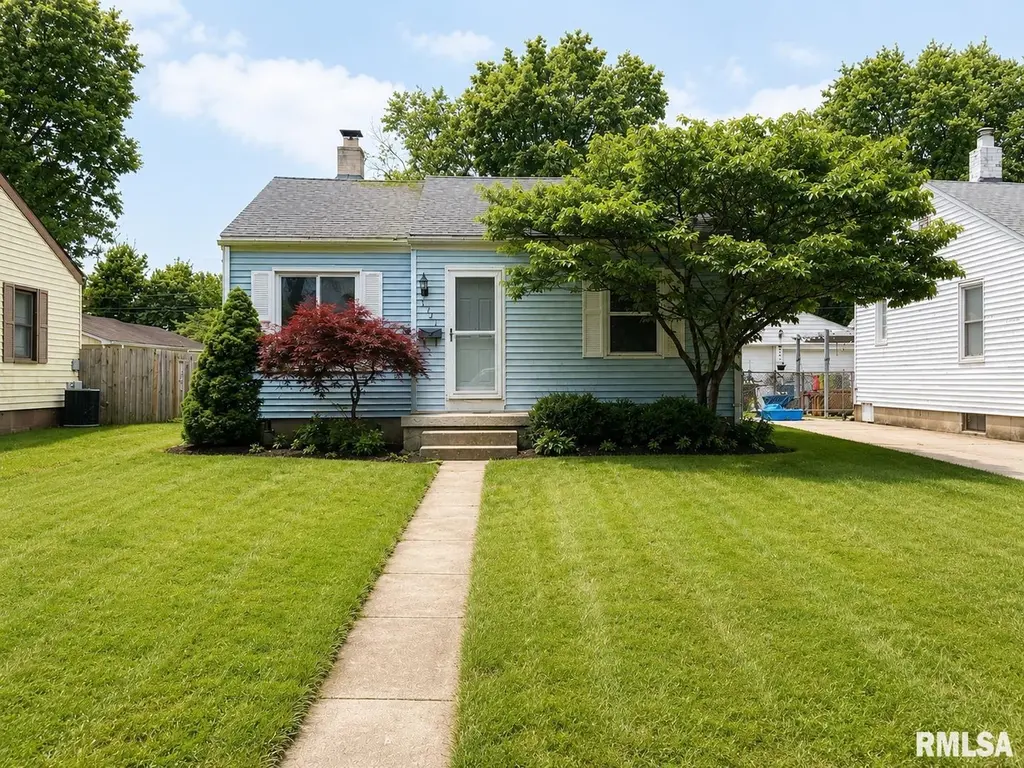
1721 N 21st St · Springfield, IL
Flood risk 1/10 · Minimal
- FEMA flood zone
- X (unshaded)
- Chance of flooding over 30 yrs
- 0.0%
- Est. flood insurance / yr
- $473 – $860
Fire risk 1/10 · Minimal
- Est. fire insurance / yr
- $804 – $1,492
Heat risk 4/10 · Minor
- Hot days now (above 104°F)
- 7 days/yr
- Hot days in 30 yrs
- 20 days/yr
Wind risk 2/10 · Minimal
- Chance of severe wind over 30 yrs
- 1.0%
Air-quality risk 2/10 · Minimal
- Unhealthy air days now
- 1 days/yr
- Unhealthy air days in 30 yrs
- 1 days/yr
Risk factors via First Street. Map © Google.
Why this score? — see what drove the F grade
The composite is a weighted blend of 9 inputs, each scored 0–100. Each bar is that input's sub-score; the figure is the points it added to the 100-point composite (weight × sub-score).
- Cash flow +13.4/30.0
- 1% rule +4.1/10.0
- DSCR +4.0/10.0
- Livability +4.0/5.0
- Rent growth +3.7/5.0
- Condition / age +2.5/5.0
- Schools +1.7/10.0
- ARV discount +0.0/15.0
- Appreciation +0.0/10.0
$116,900
🖨 Deal sheet (PDF) 📄 Offer letter ✓ Due diligence
Listing remarks MLS
Check out all that comes with this wonderful home. Great starter or home for downsizing...move right in to this cute 2 bedroom 1 bath home with wood floors, new windows, updated bath, freshly painted, roof 6-7 yrs old, partial finished basement with family room, nice large fenced back yard with 2.5 car garage. all appliances stay.
Key facts
- Soaking tub
- Hardwood floors
- Updated bathroom
Tags
Property features AI
Exterior
- Parking: Detached 2-car garage
- Utilities: Public water; Public sewer
- Home design: Single family residence; Built in 1946; One-story sections with additional upper and lower levels
- Construction: Not new construction
- Exterior features: Level lot; Shingle roof
Interior
- Kitchen: Kitchen with vinyl flooring
- Bedrooms: 2 bedrooms (both on the main level)
- Flooring: Hardwood in bedrooms and living room; Vinyl in kitchen
- Bathrooms: 1 full bathroom
- Heating & cooling: Forced air heating; Central air conditioning
- Interior features: Ceiling fan(s); Full basement
Neighborhood map
What this means for you Summary
Snapshot
- This is a 2-bed/1.0-bath single-family listed at $117k.
Deal economics
- At list price, monthly cash flow is $2 ($24/yr) — positive.
- The deal already cash-flows at list — no discount required.
- To meet the 1% rule (rent ≥ 1% of price), the offer needs to be $106k (9.4% below list).
- Recommended offer: $106k (9.4% below list) — sets the bar for 1% rule.
- Cap rate 6.3% vs local median 4.9% in Springfield — meaningfully above typical; check what's discounted (condition, days-on-market, listing class) to confirm the premium yield is real.
Location & tenants
- Location reads 79/100 on livability (#122 in IL, #2,138 nationally) — a middle-class / working-renter tenant base. Strengths: amenities A+, commute A+, cost of living A+; Watch: crime F.
- Springfield SD 186 (urban): math 17% / reading 22% proficiency, ranked #438 of 620 in IL (top 71%) — low school quality limits family demand, transient renter base, plan for 1-2y turnover; 64% free/reduced lunch — lower-income household profile, screen leases tightly.
- Zoned schools: Fairview Elem School (math 2% / reading 2%, grade F, #1,927 of 2,056 statewide, top 100%, 279 students, 0% FRL); Washington Middle School (math 3% / reading 6%, grade F, #650 of 665 statewide, top 98%, 531 students, 0% FRL); Lanphier High School (math 10% / reading 16%, grade F, #501 of 693 statewide, top 73%, 1,058 students, 0% FRL) — zoned schools average 0% FRL vs 64% district-wide (64 pts lower); this property's tenant base skews higher-income than the district average.
- Zoned-school proficiency averages 7% at this address vs 20% district-wide (-13 pts) — the specific schools serving this property underperform the Springfield SD 186 average; the district grade overstates school quality for this exact location.
- Market conditions: Rents rising fast (+5.0%/yr); 137 active listings in the ZIP; 2 comparable units currently listed for rent nearby; 225 units permitted in Sangamon County in 2024 (48 in 5+ unit buildings).
Forward outlook
- Local home prices are declining (-3.0%/yr); year-one equity from $808 of loan paydown is wiped out by about $4k of value loss. Plan a longer hold.
- Sangamon County population projected to shrink 9% by 2050 — rents likely to lag national; underwrite the cash flow, not the appreciation.
Negotiation context
- Only 3 days on market — expect competitive offers; lowballing is unlikely to land.
- 5 sale attempts since 29y ago with the ask held roughly flat each time — persistent listings suggest the price (not the market) is what's stuck; bring a comps-based counter.
- Current owner paid $69k; list at $117k implies a 69% gain — meaningful room to come down on a strong offer.
Risks & watch-outs
- Watch-outs: built in 1946 — expect roof / HVAC / electrical / plumbing capex.
Questions for the listing agent
- Built in 1946 — when were the roof, HVAC, electrical panel, plumbing, and water heater last replaced?
- Is there a deadline driving the sale (1031 exchange, divorce, estate, relocation)? That informs how much negotiation room exists.
- Schools are D-rated, which usually means shorter tenancies and higher turnover. Who's the typical renter profile here, and what's been the actual vacancy rate?
- Crime grade is F in this area — have there been break-ins, vandalism, or insurance claims at this property in the last 3 years? What carrier currently insures it and at what premium?
- The area grade is low — what's the realistic commute time and amenity access for the typical tenant pool here? Any planned neighborhood developments (good or bad) we should know about?
- What's the average days-on-market for RENTAL listings here right now (not sales)? A rising rental-DOM trend means longer vacancies and softer asking-rent achievability than the comps imply.
- What's the recent tenant-quality profile in this submarket — average credit score on applications, eviction rate, late-payment / NSF rate, and stable-employment percentage? A property-management company in the area should have these aggregated.
- How much new for-sale + rental construction is in the pipeline within 1–3 miles? Heavy new supply typically softens prices + rents 12–24 months out; constrained supply supports both.
Investment metrics
- 1% rule
- 0.91% ✗
- Cap rate
- 6.31%
- Cash-on-cash
- 0.07%
- DSCR
- 1.00
- GRM
- 9.2
CMA / ARV
- ARV (on-the-fly)
- $79,812
- Comps found
- 12
Show comp detail 12 sales within ~0.75 mi
| Address | Dist | Beds/Ba | Sqft | Sold | Price | $/sf | Match |
|---|---|---|---|---|---|---|---|
| 1702 N 20th St | 0.06mi | 1/1.0 (-1) | 746 (+1%) | 1mo | $65,000 | $87 | 90 |
| 1729 N 20th St | 0.07mi | 2/1.0 | 720 (-3%) | 8mo | $60,000 | $83 | 85 |
| 1621 N 21st St | 0.14mi | 2/1.0 | 775 (+5%) | 3mo | $89,000 | $115 | 83 |
| 2024 N 19th St | 0.26mi | 2/1.0 | 759 (+3%) | 8mo | $110,000 | $145 | 77 |
| 1336 N Ohio St | 0.37mi | 2/1.0 | 712 (-4%) | 2mo | $32,500 | $46 | 75 |
| 1620 N 12th St | 0.59mi | 2/1.0 | 744 (+1%) | 4mo | $45,000 | $60 | 68 |
| 2352 E Keys Ave | 0.69mi | 2/1.0 | 718 (-3%) | 2mo | $90,000 | $125 | 62 |
| 2373 E Keys | 0.71mi | 2/1.0 | 784 (+6%) | 1mo | $85,000 | $108 | 56 |
| 2277 E Converse Ave | 0.61mi | 2/1.0 | 828 (+12%) | 1mo | $83,500 | $101 | 50 |
| 1050 N 19th St | 0.70mi | 2/1.0 | 667 (-10%) | 2mo | $75,000 | $112 | 49 |
| 1001 Garfield Ave | 0.75mi | 2/1.0 | 812 (+10%) | 8mo | $115,000 | $142 | 42 |
| 1133 Indiana Ave | 0.62mi | 1/1.0 (-1) | 667 (-10%) | 10mo | $62,500 | $94 | 41 |
Match score weights: distance 35% · size 25% · config 20% · recency 20%. Top-matched comps best support the ARV.
Projected returns pro-forma
-3.0% appreciation · 4.95% rent growth · sell at horizon
- IRR
- -13.9%
- Equity multiple
- 0.49×
- Total profit
- $-16,664
- Equity at exit
- $17,430
- IRR
- -2.1%
- Equity multiple
- 0.84×
- Total profit
- $-5,167
- Equity at exit
- $10,107
Cash invested: $32,732 (down + closing). Projections, not guarantees.
Landlord ↔ Tenant lean methodology
- Overall (STATE)
- 43 Moderately Tenant-Leaning
- State Illinois
- 43 Moderately Tenant-Leaning · D+7
- County
- — inherits STATE
- City
- — inherits STATE
ZIP-level market 62702
- Home prices YoY
- -34.9%
- Rents YoY
- 5.0%
- Active inventory
- 137
- Price-to-rent
- 9.2×
Monthly cashflow live
- Estimated rent
- $1,059 medium interval (Pro) →
- Mortgage (P&I)
- −$613
- Tax from tax record
- −$173 /mo · $2,075/yr
- Insurance
- −$49
- HOA
- −$0
- Vacancy / Maint / Mgmt
- −$222
- Net cashflow
- $2
Break-even live
Sensitivity live
| Price | -10% $68 | -5% $35 | +0% $2 | +5% $-31 | +10% $-64 |
|---|---|---|---|---|---|
| Rent | -10% $-82 | -5% $-40 | +0% $2 | +5% $44 | +10% $86 |
| Rate | -1.0pp $61 | -0.5pp $32 | base $2 | +0.5pp $-28 | +1.0pp $-59 |
UW: 25.0% down · 7.5% · 30yr · 1.5% tax · 5.0% vac · 8.0% maint · 8.0% mgmt
Financing live
Cash to close
- Down payment
- $29,225
- Closing costs
- $3,507
- Reserves months
- —
- Total cash needed
- —
Loan-product check · same deal, 3 products live
Conventional
25% down · 7.5% · 30yr
- Down + closing
- —
- Monthly P&I
- —
- Monthly cashflow
- —
- DSCR
- —
- Eligible?
- —
Personal DTI + credit; lowest rate.
DSCR
20% down · 8.5% · 30yr
- Down + closing
- —
- Monthly P&I
- —
- Monthly cashflow
- —
- DSCR
- —
- Eligible?
- —
No personal income docs; deal must DSCR.
Hard money
10% down · 12.0% · 12mo
- Down + closing
- —
- Monthly P&I
- —
- Monthly cashflow
- —
- DSCR
- —
- Eligible?
- —
Short-term bridge; refi at stabilization.
Rent comps 2 comps
| Address | Beds | Baths | Sqft | Rent | $/sqft | DOM | Units | Dist |
|---|---|---|---|---|---|---|---|---|
| 2013 N 11th St Unit B Springfield, IL | 1.0 | 1.0 | 500 | $850 | $1.70 | 45d | 1 | 0.67mi |
| 1036 N Indiana Ave Springfield, IL | 2.0 | 1.0 | 672 | $1,100 | $1.64 | 45d | 1 | 0.76mi |
Listing history 16 events
-
2026-05-22$116,900 Active
-
2021-08-06historical
-
2018-05-10soldstatus $69,000
-
2018-05-08soldstatus $69,000 332-char remark
Show marketing remark (332 chars)
Check out all that comes with this wonderful home. Great starter or home for downsizing...move right in to this cute 2 bedroom 1 bath home with wood floors, new windows, updated bath, freshly painted, roof 6-7 yrs old, partial finished basement with family room, nice large fenced back yard with 2.5 car garage. all appliances stay.
-
2017-11-12$71,900 332-char remark
Show marketing remark (332 chars)
Check out all that comes with this wonderful home. Great starter or home for downsizing...move right in to this cute 2 bedroom 1 bath home with wood floors, new windows, updated bath, freshly painted, roof 6-7 yrs old, partial finished basement with family room, nice large fenced back yard with 2.5 car garage. all appliances stay.
-
2012-03-16soldstatus $65,000
-
2012-03-09soldstatus $65,000
-
2011-02-21$69,900
-
2007-01-31soldstatus $70,500
-
2003-09-10soldstatus $67,000
-
2001-12-17soldstatus $65,000
-
2001-12-14soldstatus $64,900
-
2001-10-13$64,900
-
1997-07-17soldstatus $38,666
-
1997-07-16soldstatus $58,000
-
1997-03-01$59,900
ⓘ Source: listings_history table (triggers on properties + properties_extension) + one-shot
backfill from property_details.listing_events for pre-trigger history.
Tax reassessment forecast IL · Partial reset (capped growth)
- Current annual tax
- $2,075 · $173/mo
- Projected year-2 tax
- $2,364 · $197/mo
- Expected delta
- +$289/yr (+$24/mo · 13.9%)
ⓘ Screening estimate from a state-policy table — verify with the county assessor before closing.
Climate risk First Street
- Flood 1/10 Low FEMA zone X (unshaded) · 0% chance over 30 yrs
- Wildfire 1/10 Low
- Heat 4/10 Moderate 7 d/yr ≥104°F today · 20 d/yr by 30 yrs out
- Wind 2/10 Low 100% chance of damaging wind over 30 yrs
- Air quality 2/10 Low 1 unhealthy d/yr today · 1 by 30 yrs out
Nearby sold comps map
Loading sold comps map…
Walkable amenities ~0.75 mi
Loading nearby amenities…
Taxation est. · year 1
- Rental income
- $12,709
- − Mortgage interest
- −$6,548
- − Property taxes
- −$2,075
- − Insurance
- −$584
- − Repairs & maintenance
- −$1,017
- − Management
- −$1,017
- − Depreciation
- −$3,401
- Taxable loss
- −$1,933
- Est. tax savings @ 24.0%
- +$464
- After-tax cash flow
- $488/yr
For passive investors: Depreciation is non-cash, so a rental often shows a tax loss while cash-flowing — sheltering income. Rental losses are passive: they offset passive income freely, and up to $25,000/yr can offset ordinary (W-2) income if you actively participate and your MAGI is under $100k (phasing out to $0 by $150k); unused losses carry forward. On sale, claimed depreciation is recaptured at up to 25%, and gains may owe capital-gains tax (a 1031 exchange can defer both). Figures are a year-1 estimate at your 24.0% rate — not tax advice; consult a CPA.
Schools (NCES district)
- District
- Springfield SD 186
- NCES district ID
- 1737080
- Math proficiency
- 17% ▼ -7.00%
- Reading proficiency
- 22% ▼ -5.00%
- Median HH income
- $43,744
- Composite
- 16.89/100
- National rank
- #9142
- State rank
- #438 of 620 in IL
Livability — Springfield
- Score
- 79/100
- State rank
- #122
- US rank
- #2138
Category grades
Schools grade is shown separately in the Schools card above.
Census & demographics
- Census place
- Springfield, IL
- County
- Sangamon County · 115,414 people
- City population
- 59,955
- Metro
- Springfield, IL
- Population (ZIP)
- 31,033
- Household income
- $51,136
- Rent vs Own
- Severe rent burden
- 1230.0
Population outlook (Sangamon County) Hauer SSP2
- Today (2025)
- 198,317 people
- By 2030
- 196,127 · -1.1%
- By 2040
- 188,664 · -4.9%
- By 2050
- 179,624 · -9.4%
- By 2075
- 155,027 · -21.8%
- By 2100
- 122,588 · -38.2%
Race, ethnicity, and origin ACS 2023
- Neighborhood character
- Predominantly White (72%)
- Race & ethnicity
- White 72% Black 17% Two or more races 8% Hispanic / Latino 3%
- Common ancestry
- Romanian 2% Slovak 2% Serbian 1%
- Foreign-born
- 2% · Canada
- Languages at home
- 96% English-only · Spanish 1% French/Haitian/Cajun 1% Other Indo-European 1%
Political lean MEDSL · Sangamon
- 2024 margin
- Toss-up / Even · D 46.6% · R 51.6% · Other 1.8%
- 2008→2024 swing
- -9.3pp toward R · 2008: 4.4pp · 2024: -5.0pp
- All cycles
- 2024: R+5.0 2020: R+4.4 2016: R+9.4 2012: R+8.7 2008: D+4.4
Not yet ingested
- Civics
- —
Market trends
- HPI YoY
- ▼ -79.98%
- Current HPI
- 149.1926
- Rent YoY
- ▲ 4.95%
- Metro
- Springfield, IL
- State GDP YoY
- ▲ 1.59%
- F500 in state
- 60
Industry mix (Fortune 500 HQ in IL)
| Industry | F500 HQs | Revenue |
|---|---|---|
| Insurance | 4 | $201B |
|
||
| Consumer Goods | 4 | $87B |
|
||
| Industrial Machinery | 3 | $64B |
|
||
| Healthcare | 2 | $55B |
|
||
| Retail / Pharmacy | 1 | $148B |
|
||
| Agriculture / Food | 1 | $86B |
|
||
Price history
+95.2% since first listed17 events — show timeline
- 2026-05-25 Pending — RMLSA as Distributed by MLS Grid
- 2026-05-22 Listed $116,900 RMLSA as Distributed by MLS Grid
- 2021-08-06 Listing Removed — RMLSA as Distributed by MLS Grid
- 2018-05-10 Sold (Public Records) $69,000 Public Records
- 2018-05-08 Sold (MLS) $69,000 RMLSA as Distributed by MLS Grid
- 2017-11-12 Listed $71,900 RMLSA as Distributed by MLS Grid
- 2012-03-16 Sold (Public Records) $65,000 Public Records
- 2012-03-09 Sold (MLS) $65,000 RMLSA as Distributed by MLS Grid
- 2011-02-21 Listed $69,900 RMLSA as Distributed by MLS Grid
- 2007-01-31 Sold (Public Records) $70,500 Public Records
- 2003-09-10 Sold (Public Records) $67,000 Public Records
- 2001-12-17 Sold (Public Records) $65,000 Public Records
- 2001-12-14 Sold (MLS) $64,900 RMLSA as Distributed by MLS Grid
- 2001-10-13 Listed $64,900 RMLSA as Distributed by MLS Grid
- 1997-07-17 Sold (Public Records) $38,666 Public Records
- 1997-07-16 Sold (MLS) $58,000 RMLSA as Distributed by MLS Grid
- 1997-03-01 Listed $59,900 RMLSA as Distributed by MLS Grid
Property tax history
+4.2%/yrLatest (2025): $2,075 · +5.1% YoY. Source: county tax records.
Cash-flow waterfall
monthlySold comps — $/sqft
last 12 mo · ≤1 miLoading sold comps…