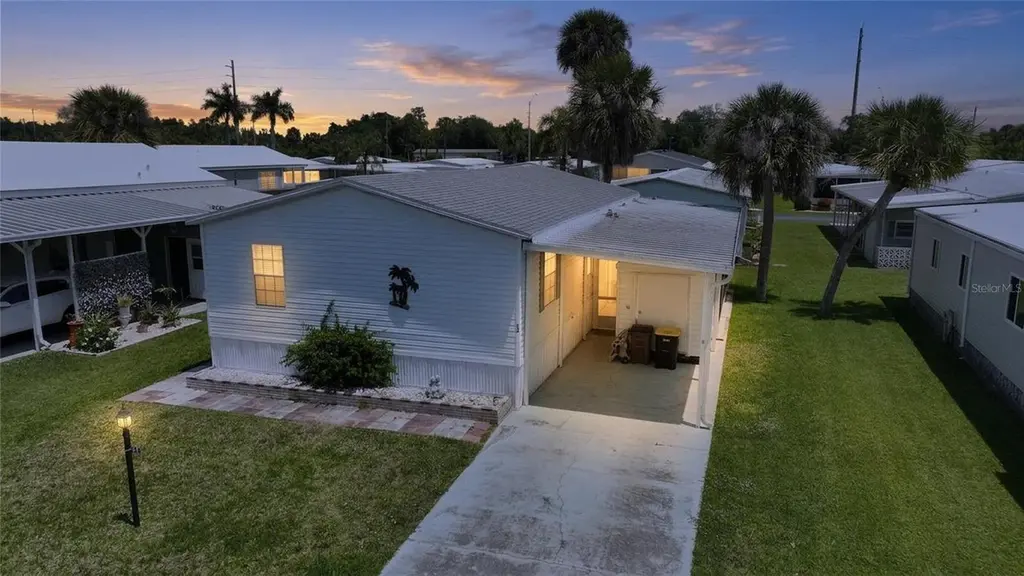
10303 Burnt Store Rd #35 · Punta Gorda, FL
Flood risk 10/10 · Severe
- FEMA flood zone
- AE
- Chance of flooding over 30 yrs
- 0.99%
- Est. flood insurance / yr
- $1,737 – $8,500
Fire risk 4/10 · Minor
- Est. fire insurance / yr
- $947 – $1,759
Heat risk 10/10 · Severe
- Hot days now (above 107°F)
- 7 days/yr
- Hot days in 30 yrs
- 28 days/yr
Wind risk 10/10 · Severe
- Chance of severe wind over 30 yrs
- 99.0%
Air-quality risk 3/10 · Minor
- Unhealthy air days now
- 2 days/yr
- Unhealthy air days in 30 yrs
- 2 days/yr
Risk factors via First Street. Map © Google.
Why this score? — see what drove the B+ grade
The composite is a weighted blend of 9 inputs, each scored 0–100. Each bar is that input's sub-score; the figure is the points it added to the 100-point composite (weight × sub-score).
- Cash flow +30.0/30.0
- ARV discount +15.0/15.0
- 1% rule +10.0/10.0
- DSCR +10.0/10.0
- Schools +4.6/10.0
- Livability +3.8/5.0
- Rent growth +2.5/5.0
- Condition / age +2.5/5.0
- Appreciation +0.0/10.0
$107,500
🖨 Deal sheet 📄 Offer letter ✓ Due diligence
Listing remarks
$5,000 credit for shares to be credited to the new buyer! Welcome to 10303 Burnt Store Road, Lot 35, in the desirable Eagle Point community—a peaceful and active 55+ neighborhood designed for comfortable Florida living. This well-maintained 2005 doublewide offers 3 bedrooms and 2 bathrooms across 1,056 square feet, with a spacious 44x24 layout that feels open and inviting. Sold fully furnished, this home is truly move-in ready, allowing you to settle in and start enjoying your new lifestyle right away. Recent updates include a new roof in 2022 and a water heater installed in 2025, providing added peace of mind. Eagle Point is a welcoming, pet-friendly community allowing two small pets
Key facts
- Community library
- Water heater
- Private boat ramp
Tags
Property features AI
Finance
- Other: Turnkey furnished option noted; Total acreage approximately 0.1 acres
- Financial info: Annual taxes listed (2025): $2,002; Lease restrictions apply
- HOA & community: Has HOA (Eagle Point - Jasmine) with required association approval; Monthly HOA fee approximately $281.80 (quarterly fee shown as $845.39); Association covers management, pool, private road, sewer, trash and water; Community clubhouse and pool; Deed restrictions; buyer approval required; Senior community; Pets allowed (cats and dogs with limits); Golf carts permitted; Community mailbox
Exterior
- Parking: Driveway; 1-car carport
- Utilities: Public water; Public sewer; Electricity connected
- Home design: Manufactured home (double wide); One story; East facing; Residential property
- Construction: Vinyl siding; Shingle roof; Crawlspace foundation; Built as double wide manufactured home
- Exterior features: Exterior lighting; Asphalt road access
Interior
- Kitchen: Dishwasher; Range; Microwave; Refrigerator
- Bedrooms: 3 bedrooms
- Flooring: Carpet; Ceramic tile
- Bathrooms: 2 full bathrooms
- Heating & cooling: Central heating; Central air conditioning
- Interior features: Open floorplan; Solid wood cabinets; Thermostat; Walk-in closet(s); Window treatments; Inside utility room
- Laundry & utility: Washer; Dryer; Indoor laundry
Neighborhood map
What this means for you Summary
Snapshot
- This is a 3-bed/2.0-bath manufactured listed at $108k.
Deal economics
- At list price, monthly cash flow is $393 ($5k/yr) — positive.
- The deal already cash-flows at list — no discount required.
- Meets the 1% rule at list price ($2k rent vs $108k).
- Recommended offer: $104k (3.0% below list) — sets the bar for market timing.
- Cap rate 15.4% vs local median 2.8% in Punta Gorda — top-decile yield for the area; either an underpriced asset or a hidden risk that comps aren't pricing in. Stress-test before assuming the spread holds.
Location & tenants
- Location reads 76/100 on livability (#225 in FL, #3,567 nationally) — a middle-class / working-renter tenant base. Strengths: schools A+, crime A+, health & safety A+; Watch: cost of living D+, amenities D-, commute F.
- Charlotte (suburban): math 54% / reading 54% proficiency, ranked #22 of 73 in FL (top 30%) — acceptable for families but not a draw, mixed tenant base, ~2y average lease.
- Market conditions: Rents soft (-0.1%/yr); 999 active listings in the ZIP; 8 comparable units currently listed for rent nearby; rentals at typical pace (median 21d on market — plan ~3-4 weeks tenant-placement turnaround); solid renter incomes; 4,585 units permitted in Charlotte County in 2024 (703 in 5+ unit buildings).
- This rent runs 37% of the median local income ($76k/yr) — at the standard rent-burdened threshold; future hikes will face affordability resistance.
Forward outlook
- Local home prices are declining (-3.0%/yr); year-one equity from $743 of loan paydown is wiped out by about $3k of value loss. Plan a longer hold.
- Charlotte County population projected at +24% by 2050 — long-run rental-demand tailwind backs the buy-and-hold thesis.
Negotiation context
- It's been on market 56 days — a 3% lower offer ($104k) is reasonable based on typical stale-listing flexibility.
Risks & watch-outs
- Watch-outs: flood insurance adds $427/mo.
- Climate carrying-cost: in FEMA flood zone AE (mandatory federal flood insurance); severe wind risk, 99% chance of damaging wind over 30y; extreme-heat days projected 7→28/yr by 2055 (HVAC capex compounding) — expect insurance premiums to compound above CPI over the hold.
Questions for the listing agent
- It's been on market 56 days. Have you received any prior offers? Is the seller open to a 3% concession, seller financing, or rate buy-down credit?
- What's the actual annual flood-insurance premium (NFIP or private), and is the property in a SFHA with mandatory coverage?
- What does the HOA fee cover, when was the last increase, and are there any pending special assessments or reserve-fund shortfalls?
- Is there a deadline driving the sale (1031 exchange, divorce, estate, relocation)? That informs how much negotiation room exists.
- Schools are A-rated — typically a magnet for longer-tenancy family renters. What's the average tenant stay here, and is there a school-zone premium baked into asking?
- What's the average days-on-market for RENTAL listings here right now (not sales)? A rising rental-DOM trend means longer vacancies and softer asking-rent achievability than the comps imply.
- What's the recent tenant-quality profile in this submarket — average credit score on applications, eviction rate, late-payment / NSF rate, and stable-employment percentage? A property-management company in the area should have these aggregated.
- How much new for-sale + rental construction is in the pipeline within 1–3 miles? Heavy new supply typically softens prices + rents 12–24 months out; constrained supply supports both.
Investment metrics
- 1% rule
- 2.21% ✓
- Cap rate
- 15.45%
- Cash-on-cash
- 32.69%
- DSCR
- 2.45
- GRM
- 3.8
CMA / ARV
- ARV (on-the-fly)
- $140,448
- Comps found
- 1
Show comp detail 1 sale within ~0.75 mi
| Address | Dist | Beds/Ba | Sqft | Sold | Price | $/sf | Match |
|---|---|---|---|---|---|---|---|
| 3220 Acline Rd | 0.70mi | 3/2.0 | 1,056 (0%) | 7mo | $140,000 | $133 | 61 |
Match score weights: distance 35% · size 25% · config 20% · recency 20%. Top-matched comps best support the ARV.
Projected returns pro-forma
-3.0% appreciation · 0.0% rent growth · sell at horizon
- IRR
- 1.1%
- Equity multiple
- 1.04×
- Total profit
- $1,163
- Equity at exit
- $16,029
- IRR
- 4.9%
- Equity multiple
- 1.28×
- Total profit
- $8,366
- Equity at exit
- $9,295
Cash invested: $30,100 (down + closing). Projections, not guarantees.
Landlord ↔ Tenant lean methodology
- Overall (STATE)
- 87 Strongly Landlord-Friendly
- State Florida
- 87 Strongly Landlord-Friendly · R+3
- County
- — inherits STATE
- City
- — inherits STATE
ZIP-level market 33950
- Home prices YoY
- -29.9%
- Rents YoY
- -0.1%
- Active inventory
- 999
- Price-to-rent
- 3.8×
Monthly cashflow live
- Estimated rent
- $2,375 high interval (Pro) →
- Mortgage (P&I)
- −$564
- Tax from tax record
- −$167 /mo · $2,002/yr
- Insurance
- −$45
- Flood insurance flood zone
- −$427 /mo · $5,118/yr
- HOA
- −$281
- Vacancy / Maint / Mgmt
- −$499
- Net cashflow
- $393
Break-even live
UW: 25.0% down · 7.5% · 30yr · 1.5% tax · 5.0% vac · 8.0% maint · 8.0% mgmt
Financing live
Cash to close
- Down payment
- $26,875
- Closing costs
- $3,225
- Reserves months
- —
- Total cash needed
- —
Loan-product check · same deal, 3 products live
Conventional
25% down · 7.5% · 30yr
- Down + closing
- —
- Monthly P&I
- —
- Monthly cashflow
- —
- DSCR
- —
- Eligible?
- —
Personal DTI + credit; lowest rate.
DSCR
20% down · 8.5% · 30yr
- Down + closing
- —
- Monthly P&I
- —
- Monthly cashflow
- —
- DSCR
- —
- Eligible?
- —
No personal income docs; deal must DSCR.
Hard money
10% down · 12.0% · 12mo
- Down + closing
- —
- Monthly P&I
- —
- Monthly cashflow
- —
- DSCR
- —
- Eligible?
- —
Short-term bridge; refi at stabilization.
Rent comps 8 comps
| Address | Beds | Baths | Sqft | Rent | $/sqft | DOM | Units | Dist |
|---|---|---|---|---|---|---|---|---|
| 26162 Stillwater Cir Punta Gorda, FL | 2.0 | 2.0 | 1266 | $2,000 | $1.58 | 21d | 1 | 0.45mi |
| 3845 Albacete Cir #50 Punta Gorda, FL | 2.0 | 2.0 | 1451 | $2,200 | $1.52 | 21d | 1 | 0.89mi |
| 3800 Tripoli Blvd #35 Punta Gorda, FL | 2.0 | 2.0 | 1451 | $4,200 | $2.89 | 21d | 1 | 0.93mi |
| 449 Royal Poinciana #221 Punta Gorda, FL | 2.0 | 2.0 | 1164 | $1,750 | $1.50 | 21d | 1 | 1.06mi |
| 26120 Jones Loop Rd Punta Gorda, FL | 3.0 | 1.0–2.0 | 1105 | $2,275 | $2.06 | 13d | 27 | 1.15mi |
| 3701 Albacete Cir #98 Punta Gorda, FL | 2.0 | 2.0 | 1451 | $3,250 | $2.24 | 21d | 1 | 1.17mi |
| 15 N Cardinal Unit B15 Punta Gorda, FL | 2.0 | 2.0 | 960 | $1,700 | $1.77 | 21d | 1 | 1.24mi |
| 7361 S Plum Tree Punta Gorda, FL | 3.0 | 2.0 | 1373 | $1,900 | $1.38 | 21d | 1 | 1.28mi |
HOA detail
- Monthly dues
- $281 · $3,372/yr
- Likely covers
- water
Listing history 18 events
-
2026-06-18days on market $107,500 Active 56 DOM
-
2026-06-17days on market $107,500 Active 55 DOM
-
2026-06-16days on market $107,500 Active 54 DOM
-
2026-06-15days on market $107,500 Active 53 DOM
-
2026-06-14days on market $107,500 Active 51 DOM
-
2026-06-13days on market $107,500 Active 50 DOM
-
2026-06-10days on market $107,500 Active 48 DOM
-
2026-06-09days on market $107,500 Active 47 DOM
-
2026-06-08days on market $107,500 Active 46 DOM
-
2026-06-07days on market $107,500 Active 45 DOM
-
2026-06-05days on market $107,500 Active 42 DOM
-
2026-06-03pricedays on market $107,500 Active 41 DOM
-
2026-06-02days on market $112,500 Active 40 DOM
-
2026-06-01days on market $112,500 Active 39 DOM
-
2026-05-31days on market $112,500 Active 38 DOM
-
2026-05-30days on market $112,500 Active 37 DOM
-
2026-05-11price $112,500
-
2026-04-23$115,500 Active
ⓘ Source: listings_history table (triggers on properties + properties_extension) + one-shot
backfill from property_details.listing_events for pre-trigger history.
Tax reassessment forecast FL · Resets to sale price
- Current annual tax
- $2,002 · $167/mo
- Projected year-2 tax
- $2,002 · $167/mo
- Expected delta
- $0/yr ($0/mo · 0.0%)
ⓘ Screening estimate from a state-policy table — verify with the county assessor before closing.
Climate risk First Street
- Flood 10/10 Extreme FEMA zone AE · 99% chance over 30 yrs
- Wildfire 4/10 Moderate
- Heat 10/10 Extreme 7 d/yr ≥107°F today · 28 d/yr by 30 yrs out
- Wind 10/10 Extreme 99% chance of damaging wind over 30 yrs
- Air quality 3/10 Moderate 2 unhealthy d/yr today · 2 by 30 yrs out
Nearby sold comps map
Loading sold comps map…
Walkable amenities ~0.75 mi
Loading nearby amenities…
Taxation est. · year 1
- Rental income
- $28,499
- − Mortgage interest
- −$6,022
- − Property taxes
- −$2,002
- − Insurance
- −$5,656
- − Repairs & maintenance
- −$2,280
- − Management
- −$2,280
- − HOA
- −$3,372
- − Depreciation
- −$3,127
- Taxable income
- $3,761
- Est. tax owed @ 24.0%
- −$903
- After-tax cash flow
- $3,817/yr
For passive investors: Depreciation is non-cash, so a rental often shows a tax loss while cash-flowing — sheltering income. Rental losses are passive: they offset passive income freely, and up to $25,000/yr can offset ordinary (W-2) income if you actively participate and your MAGI is under $100k (phasing out to $0 by $150k); unused losses carry forward. On sale, claimed depreciation is recaptured at up to 25%, and gains may owe capital-gains tax (a 1031 exchange can defer both). Figures are a year-1 estimate at your 24.0% rate — not tax advice; consult a CPA.
Schools (NCES district)
- District
- Charlotte
- NCES district ID
- 1200240
- Math proficiency
- 54% ▼ -6.00%
- Reading proficiency
- 54% ▼ -1.00%
- Median HH income
- $44,864
- Composite
- 45.62/100
- National rank
- #2586
- State rank
- #22 of 73 in FL
Livability — Punta Gorda
- Score
- 76/100
- State rank
- #225
- US rank
- #3567
Category grades
Schools grade is shown separately in the Schools card above.
Census & demographics
- Census place
- Punta Gorda, FL
- County
- Charlotte County · 196,994 people
- City population
- 68,831
- Metro
- Punta Gorda, FL
- Population (ZIP)
- 24,955
- Household income
- $76,369
- Rent vs Own
- Severe rent burden
- 608.0
Population outlook (Charlotte County) Hauer SSP2
- Today (2025)
- 198,646 people
- By 2030
- 210,507 · +6.0%
- By 2040
- 230,857 · +16.2%
- By 2050
- 247,148 · +24.4%
- By 2075
- 281,777 · +41.8%
- By 2100
- 293,609 · +47.8%
Race, ethnicity, and origin ACS 2023
- Neighborhood character
- Predominantly White (86%)
- Race & ethnicity
- White 86% Two or more races 5% Black 5% Hispanic / Latino 4% Asian 1%
- Common ancestry
- Lithuanian 5% Romanian 4% Italian 2%
- Foreign-born
- 7% · Canada
- Languages at home
- 95% English-only · Spanish 3% Other Indo-European 1% German/W. Germanic 1%
Political lean MEDSL · Charlotte
- 2024 margin
- Solid R (+34.0) · D 32.7% · R 66.7%
- 2008→2024 swing
- -26.7pp toward R · 2008: -7.2pp · 2024: -34.0pp
- All cycles
- 2024: R+34.0 2020: R+26.6 2016: R+27.8 2012: R+14.3 2008: R+7.2
Not yet ingested
- Civics
- —
Market trends
- HPI YoY
- ▼ -111.73%
- Current HPI
- 261.6573
- Rent YoY
- ▼ -0.06%
- Metro
- Punta Gorda, FL
- State GDP YoY
- ▲ 3.28%
- F500 in state
- 36
Industry mix (Fortune 500 HQ in FL)
| Industry | F500 HQs | Revenue |
|---|---|---|
| Industrial Technology | 2 | $29B |
|
||
| Insurance | 2 | $17B |
|
||
| Retail | 1 | $60B |
|
||
| Technology Distribution | 1 | $58B |
|
||
| Homebuilding | 1 | $35B |
|
||
| Technology Manufacturing | 1 | $35B |
|
||
Price history
-2.6% since first listed2 events — show timeline
- 2026-05-11 Price Changed $112,500 Stellar MLS as Distributed by MLS Grid
- 2026-04-23 Listed $115,500 Stellar MLS as Distributed by MLS Grid
Property tax history
+4.4%/yrLatest (2025): $2,002 · +0.9% YoY. Source: county tax records.
Cash-flow waterfall
monthlySold comps — $/sqft
last 12 mo · ≤1 miLoading sold comps…