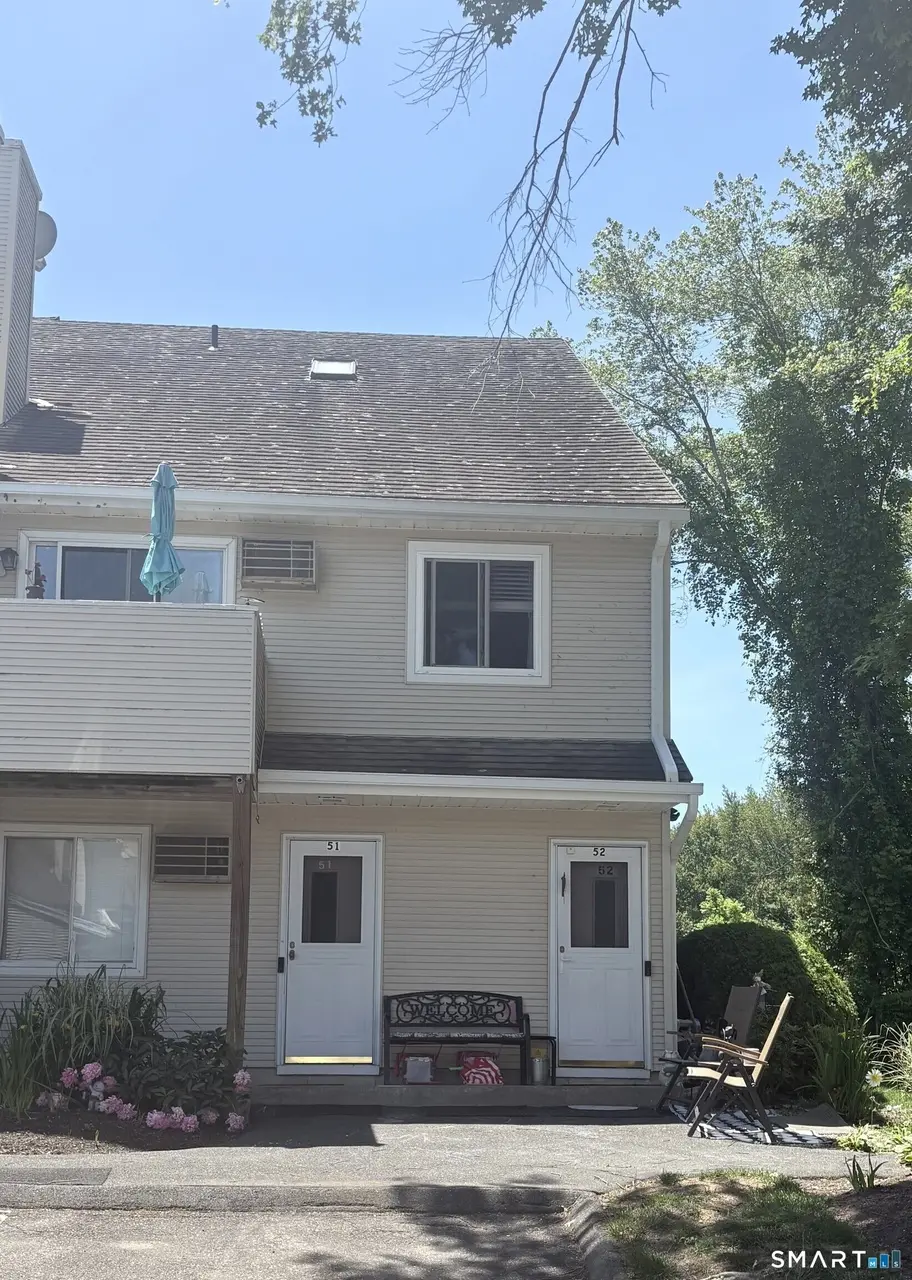
136 Pembroke Rd Unit 6-52 · Danbury, CT
Flood risk 1/10 · Minimal
- FEMA flood zone
- X (unshaded)
- Chance of flooding over 30 yrs
- 0.0%
- Est. flood insurance / yr
- $507 – $1,088
Fire risk 3/10 · Minor
- Est. fire insurance / yr
- $829 – $1,539
Heat risk 4/10 · Minor
- Hot days now (above 98°F)
- 7 days/yr
- Hot days in 30 yrs
- 15 days/yr
Wind risk 4/10 · Minor
- Chance of severe wind over 30 yrs
- 24.0%
Air-quality risk 3/10 · Minor
- Unhealthy air days now
- 3 days/yr
- Unhealthy air days in 30 yrs
- 4 days/yr
Risk factors via First Street. Map © Google.
Why this score? — see what drove the D grade
The composite is a weighted blend of 9 inputs, each scored 0–100. Each bar is that input's sub-score; the figure is the points it added to the 100-point composite (weight × sub-score).
- Cash flow +14.1/30.0
- ARV discount +7.5/15.0
- 1% rule +5.1/10.0
- DSCR +4.3/10.0
- Livability +3.8/5.0
- Rent growth +2.5/5.0
- Condition / age +2.5/5.0
- Schools +2.4/10.0
- Appreciation +0.0/10.0
$339,000
🖨 Deal sheet (PDF) 📄 Offer letter ✓ Due diligence
Listing remarks
Welcome to this well-maintained Danbury condominium offering comfort, convenience, and low-maintenance living. This bright and inviting unit features spacious living areas, an efficient floor plan, and plenty of natural light. The kitchen offers ample cabinet space and opens to the dining and living areas, perfect for everyday living or entertaining. Recent updates include a new washer and dryer in 2026, new carpet and ceiling fans in both bedrooms, a new toilet in the downstairs bathroom, new decking in 2025, and a new oven in 2025. Conveniently located near shopping, restaurants, schools, parks, and major commuter routes, this property is a wonderful opportunity for first-time buyers, dow
Key facts
- $366 HOA
- Parking
- Pool
Property features AI
Finance
- Other: Living area recorded as 1608 (public record); Complex amenities nearby: golf course, lake, library, medical facilities, shopping/mall
- HOA & community: Monthly HOA fee; HOA covers grounds maintenance, trash pickup, snow removal, water, sewer, property management, pool service, and road maintenance; Professional off-site property management; Pets allowed with restrictions (limit 2)
Exterior
- Parking: Paved parking; 1 parking space
- Utilities: Public water connected; Public sewer connected; Electric hot water
- Home design: Condominium (end unit); Part of a 108-unit complex (Lakewood); Light beige exterior color
- Construction: Frame construction
- Exterior features: Vinyl siding; Balcony; Deck; Level lot; In-ground swimming pool (community)
Interior
- Kitchen: Electric range; Range hood; Refrigerator; Dishwasher; Disposal
- Bedrooms: 2 bedrooms
- Bathrooms: 1 full bath; 1 half bath
- Heating & cooling: Baseboard heating (electric); Wall unit cooling
- Interior features: Two-level unit; One fireplace; Basement: none
- Laundry & utility: Washer and dryer located on the upper-level hallway
Neighborhood map
What this means for you Summary
Snapshot
- This is a 2-bed/1.5-bath condo listed at $339k.
Deal economics
- At list price, monthly cash flow is $52 ($629/yr) — positive.
- The deal already cash-flows at list — no discount required.
- Meets the 1% rule at list price ($3k rent vs $339k).
- Cap rate 6.5% vs local median 3.6% in Danbury — top-decile yield for the area; either an underpriced asset or a hidden risk that comps aren't pricing in. Stress-test before assuming the spread holds.
Location & tenants
- Location reads 76/100 on livability (#51 in CT, #3,379 nationally) — a middle-class / working-renter tenant base. Strengths: commute A+, housing A+, health & safety A+; Watch: amenities F, cost of living F.
- Danbury School District (urban): math 19% / reading 32% proficiency, ranked #131 of 153 in CT (top 86%) — low school quality limits family demand, transient renter base, plan for 1-2y turnover.
- Zoned schools: Pembroke School (math 17% / reading 32%, grade F, #424 of 553 statewide, top 78%, 366 students, 51% FRL); Danbury High School (math 19% / reading 41%, grade F, #137 of 194 statewide, top 70%, 3,590 students, 48% FRL).
- Market conditions: 117 active listings in the ZIP; 3 comparable units currently listed for rent nearby; rentals at typical pace (median 21d on market — plan ~3-4 weeks tenant-placement turnaround); solid renter incomes; 1,151 units permitted in Western Connecticut Planning Region in 2024 (714 in 5+ unit buildings).
- This rent runs 39% of the median local income ($105k/yr) — at the standard rent-burdened threshold; future hikes will face affordability resistance.
Forward outlook
- Local home prices are declining (-3.0%/yr); year-one equity from $2k of loan paydown is wiped out by about $10k of value loss. Plan a longer hold.
Negotiation context
- Only 4 days on market — expect competitive offers; lowballing is unlikely to land.
- Current owner paid $184k; list at $339k implies a 85% gain — meaningful room to come down on a strong offer.
Questions for the listing agent
- What does the HOA fee cover, when was the last increase, and are there any pending special assessments or reserve-fund shortfalls?
- Any open or pending special assessments — roof, HVAC, plumbing, elevator, façade? What's the per-unit balance and payoff schedule, and is the seller paying it off at close or rolling it to the buyer?
- Is there a deadline driving the sale (1031 exchange, divorce, estate, relocation)? That informs how much negotiation room exists.
- Schools are D-rated, which usually means shorter tenancies and higher turnover. Who's the typical renter profile here, and what's been the actual vacancy rate?
- The area grade is low — what's the realistic commute time and amenity access for the typical tenant pool here? Any planned neighborhood developments (good or bad) we should know about?
- What's the average days-on-market for RENTAL listings here right now (not sales)? A rising rental-DOM trend means longer vacancies and softer asking-rent achievability than the comps imply.
- What's the recent tenant-quality profile in this submarket — average credit score on applications, eviction rate, late-payment / NSF rate, and stable-employment percentage? A property-management company in the area should have these aggregated.
- How much new apartment / multifamily construction is in the pipeline within 1–3 miles? Heavy new supply (>2% of stock underway) typically softens rents 12–24 months out; light construction supports rent growth.
Investment metrics
- 1% rule
- 1.01% ✓
- Cap rate
- 6.48%
- Cash-on-cash
- 0.66%
- DSCR
- 1.03
- GRM
- 8.3
CMA / ARV
No comps found within radius.
Projected returns pro-forma
-3.0% appreciation · 3.0% rent growth · sell at horizon
- IRR
- -15.2%
- Equity multiple
- 0.46×
- Total profit
- $-51,353
- Equity at exit
- $50,546
- IRR
- -6.5%
- Equity multiple
- 0.58×
- Total profit
- $-39,446
- Equity at exit
- $29,311
Cash invested: $94,920 (down + closing). Projections, not guarantees.
Landlord ↔ Tenant lean methodology
- Overall (STATE)
- 27 Tenant-Leaning
- State Connecticut
- 27 Tenant-Leaning · D+7
- County
- — inherits STATE
- City
- — inherits STATE
ZIP-level market 06811
- Active inventory
- 117
- Price-to-rent
- 8.3×
Monthly cashflow live
- Estimated rent
- $3,418 medium interval (Pro) →
- Mortgage (P&I)
- −$1,778
- Tax from tax record
- −$363 /mo · $4,351/yr
- Insurance
- −$141
- HOA
- −$366
- Vacancy / Maint / Mgmt
- −$718
- Net cashflow
- $52
Break-even live
Sensitivity live
| Price | -10% $244 | -5% $148 | +0% $52 | +5% $-44 | +10% $-139 |
|---|---|---|---|---|---|
| Rent | -10% $-218 | -5% $-83 | +0% $52 | +5% $187 | +10% $322 |
| Rate | -1.0pp $223 | -0.5pp $139 | base $52 | +0.5pp $-35 | +1.0pp $-125 |
UW: 25.0% down · 7.5% · 30yr · 1.5% tax · 5.0% vac · 8.0% maint · 8.0% mgmt
Financing live
Cash to close
- Down payment
- $84,750
- Closing costs
- $10,170
- Reserves months
- —
- Total cash needed
- —
Loan-product check · same deal, 3 products live
Conventional
25% down · 7.5% · 30yr
- Down + closing
- —
- Monthly P&I
- —
- Monthly cashflow
- —
- DSCR
- —
- Eligible?
- —
Personal DTI + credit; lowest rate.
DSCR
20% down · 8.5% · 30yr
- Down + closing
- —
- Monthly P&I
- —
- Monthly cashflow
- —
- DSCR
- —
- Eligible?
- —
No personal income docs; deal must DSCR.
Hard money
10% down · 12.0% · 12mo
- Down + closing
- —
- Monthly P&I
- —
- Monthly cashflow
- —
- DSCR
- —
- Eligible?
- —
Short-term bridge; refi at stabilization.
Rent comps 3 comps
| Address | Beds | Baths | Sqft | Rent | $/sqft | DOM | Units | Dist |
|---|---|---|---|---|---|---|---|---|
| 8 Mendes Rd Danbury, CT | 3.0 | 1.5 | 1184 | $3,800 | $3.21 | 21d | 1 | 0.28mi |
| 8 Snug Harbor Dr Danbury, CT | 3.0 | 3.0 | 1639 | $2,950 | $1.80 | 4d | 1 | 1.22mi |
| 6 Brighton St Danbury, CT | 3.0 | 2.5 | 1272 | $4,700 | $3.69 | 45d | 1 | 1.23mi |
HOA detail condo
- Monthly dues
- $366 · $4,392/yr
- Assessments
- None detected in remarks — confirm with the listing agent.
Listing history 9 events
-
2026-06-22days on market $339,000 Active 4 DOM
-
2026-06-18statusdays on market $339,000 Active 1 DOM
-
2026-06-17days on market $339,000 Coming Soon 9 DOM
-
2026-06-16days on market $339,000 Coming Soon 8 DOM
-
2026-06-15days on market $339,000 Coming Soon 7 DOM
-
2026-06-13days on market $339,000 Coming Soon 5 DOM
-
2026-06-10days on market $339,000 Coming Soon 2 DOM
-
2026-06-08remarks 699-char remark
-
2026-06-08$339,000 Coming Soon 1 DOM
ⓘ Source: listings_history table (triggers on properties + properties_extension) + one-shot
backfill from property_details.listing_events for pre-trigger history.
Tax reassessment forecast CT · Partial reset (capped growth)
- Current annual tax
- $4,351 · $363/mo
- Projected year-2 tax
- $5,803 · $484/mo
- Expected delta
- +$1,452/yr (+$121/mo · 33.4%)
ⓘ Screening estimate from a state-policy table — verify with the county assessor before closing.
Climate risk First Street
- Flood 1/10 Low FEMA zone X (unshaded) · 0% chance over 30 yrs
- Wildfire 3/10 Moderate
- Heat 4/10 Moderate 7 d/yr ≥98°F today · 15 d/yr by 30 yrs out
- Wind 4/10 Moderate 24% chance of damaging wind over 30 yrs
- Air quality 3/10 Moderate 3 unhealthy d/yr today · 4 by 30 yrs out
Nearby sold comps map
Loading sold comps map…
Walkable amenities ~0.75 mi
Loading nearby amenities…
Taxation est. · year 1
- Rental income
- $41,013
- − Mortgage interest
- −$18,989
- − Property taxes
- −$4,351
- − Insurance
- −$1,695
- − Repairs & maintenance
- −$3,281
- − Management
- −$3,281
- − HOA
- −$4,392
- − Depreciation
- −$9,862
- Taxable loss
- −$4,838
- Est. tax savings @ 24.0%
- +$1,161
- After-tax cash flow
- $1,790/yr
For passive investors: Depreciation is non-cash, so a rental often shows a tax loss while cash-flowing — sheltering income. Rental losses are passive: they offset passive income freely, and up to $25,000/yr can offset ordinary (W-2) income if you actively participate and your MAGI is under $100k (phasing out to $0 by $150k); unused losses carry forward. On sale, claimed depreciation is recaptured at up to 25%, and gains may owe capital-gains tax (a 1031 exchange can defer both). Figures are a year-1 estimate at your 24.0% rate — not tax advice; consult a CPA.
Schools (NCES district)
- District
- Danbury School District
- NCES district ID
- 0901020
- Math proficiency
- 19% ▼ -17.00%
- Reading proficiency
- 32% ▼ -16.00%
- Median HH income
- $65,793
- Composite
- 23.93/100
- National rank
- #7784
- State rank
- #131 of 153 in CT
Livability — Danbury
- Score
- 76/100
- State rank
- #51
- US rank
- #3379
Category grades
Schools grade is shown separately in the Schools card above.
Census & demographics
- Census place
- Danbury, CT
- County
- Fairfield County · 765,532 people
- City population
- 87,061
- Metro
- Bridgeport-Stamford-Norwalk, CT
- Population (ZIP)
- 31,228
- Household income
- $104,640
- Rent vs Own
- Severe rent burden
- 551.0
Population outlook (Western Connecticut County) Hauer SSP2
- By 2040
- 685,031
Race, ethnicity, and origin ACS 2023
- Neighborhood character
- Diverse neighborhood (Simpson 0.59)
- Race & ethnicity
- White 60% Hispanic / Latino 19% Two or more races 10% Black 10% Asian 5%
- Hispanic origin (detail)
- Mexican 2% Puerto Rican 3% Dominican 6%
- Common ancestry
- Russian 4% Romanian 3% Estonian 3%
- Foreign-born
- 23% · Canada, Guatemala, China
- Languages at home
- 67% English-only · Spanish 16% Other Indo-European 8% Russian/Polish/Slavic 2%
Political lean MEDSL · Western Connecticut
- 2024 margin
- D (+19.1) · D 58.8% · R 39.7% · Other 1.6%
- All cycles
- 2024: D+19.1
Not yet ingested
- Civics
- —
Market trends
- HPI YoY
- ▼ -361.68%
- Current HPI
- 258.6639
- Rent YoY
- —
- Metro
- Bridgeport-Stamford-Norwalk, CT
- State GDP YoY
- ▲ 1.06%
- F500 in state
- 38
Industry mix (Fortune 500 HQ in CT)
| Industry | F500 HQs | Revenue |
|---|---|---|
| Industrial Machinery | 4 | $38B |
|
||
| Insurance | 3 | $71B |
|
||
| Financial Services | 2 | $25B |
|
||
| Transportation / Logistics | 2 | $18B |
|
||
| Healthcare | 1 | $247B |
|
||
| Telecommunications | 1 | $55B |
|
||
Price history
+145.7% since first listed5 events — show timeline
- 2026-06-08 Coming Soon $339,000 Smart MLS
- 2018-08-07 Sold (Public Records) $183,500 Public Records
- 2010-07-26 Sold (Public Records) $222,500 Public Records
- 1997-05-05 Sold (Public Records) $93,750 Public Records
- 1989-08-18 Sold (Public Records) $138,000 Public Records
Property tax history
+2.2%/yrLatest (2023): $4,351 · +30.5% YoY. Source: county tax records.
Cash-flow waterfall
monthlySold comps — $/sqft
last 12 mo · ≤1 miLoading sold comps…