813 Eaton St · Corning, AR
Flood risk 1/10 · Minimal
- FEMA flood zone
- X (unshaded)
- Chance of flooding over 30 yrs
- 0.0%
- Est. flood insurance / yr
- $507 – $1,088
Fire risk 1/10 · Minimal
- Est. fire insurance / yr
- $1,499 – $2,785
Heat risk 6/10 · Moderate
- Hot days now (above 110°F)
- 7 days/yr
- Hot days in 30 yrs
- 21 days/yr
Wind risk 3/10 · Minor
- Chance of severe wind over 30 yrs
- 6.0%
Air-quality risk 1/10 · Minimal
- Unhealthy air days now
- 0 days/yr
- Unhealthy air days in 30 yrs
- 0 days/yr
Risk factors via First Street. Map © Google.
Why this score? — see what drove the A- grade
The composite is a weighted blend of 9 inputs, each scored 0–100. Each bar is that input's sub-score; the figure is the points it added to the 100-point composite (weight × sub-score).
- Cash flow +30.0/30.0
- ARV discount +15.0/15.0
- 1% rule +10.0/10.0
- DSCR +10.0/10.0
- Appreciation +5.9/10.0
- Livability +3.6/5.0
- Schools +2.9/10.0
- Rent growth +2.5/5.0
- Condition / age +2.5/5.0
$60,000
🖨 Deal sheet 📄 Offer letter ✓ Due diligence
Listing remarks MLS
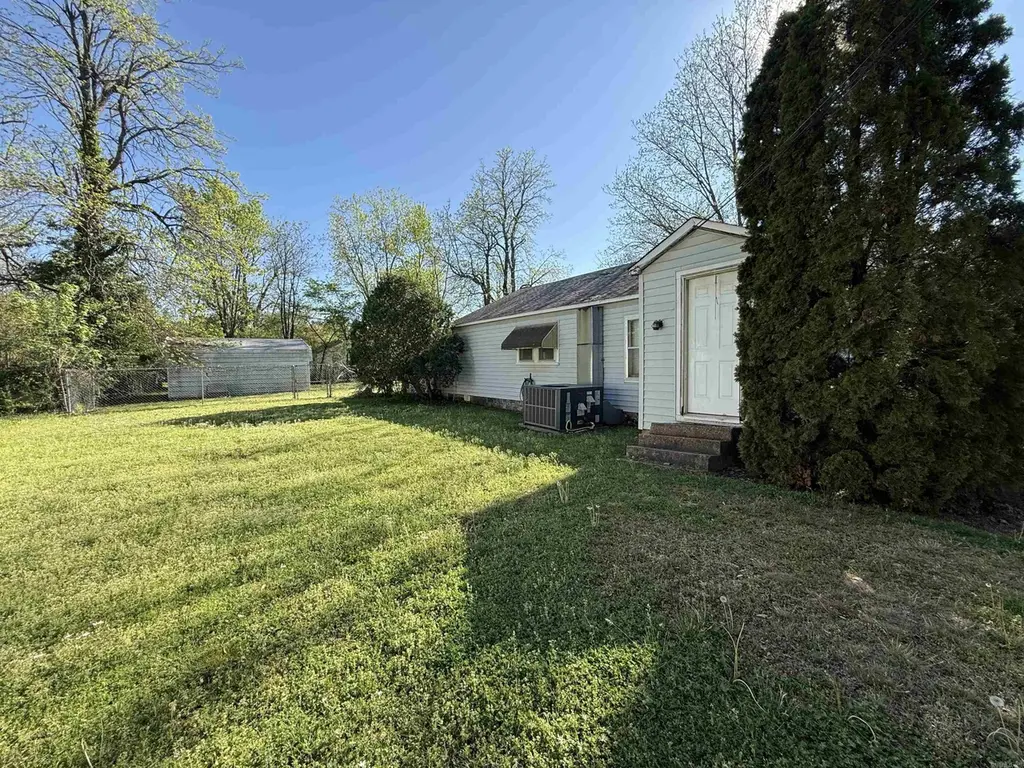
Check out this cozy 2 bedroom home located in Corning, AR! Situated on a huge corner lot, this home has everything that you need. The carport was closed in creating extra living space, drive way has a covered parking pad, and don't miss the 20 x 30 outbuilding out back with a fenced-in back yard too. HVAC is a 2023 and the refrigerator stays. Call for an appointment. Selling AS IS, WHERE IS.
Key facts
- Outbuilding
- Covered parking pad
- Extra living space
Tags
Neighborhood map
What this means for you Summary
Snapshot
- This is a 2-bed/1.0-bath single-family listed at $60k.
Deal economics
- At list price, monthly cash flow is $425 ($5k/yr) — positive.
- The deal already cash-flows at list — no discount required.
- Meets the 1% rule at list price ($1k rent vs $60k).
- Recommended offer: $56k (6.0% below list) — sets the bar for market timing.
- Cap rate 14.8% vs local median 7.0% in Corning — top-decile yield for the area; either an underpriced asset or a hidden risk that comps aren't pricing in. Stress-test before assuming the spread holds.
Location & tenants
- Location reads 71/100 on livability (#38 in AR) — a middle-class / working-renter tenant base. Strengths: cost of living A+, housing A+, health & safety A+; Watch: schools D-, amenities F, commute F.
- Corning School District (town): math 33% / reading 38% proficiency, ranked #123 of 238 in AR (top 52%) — families likely to look elsewhere, expect single-tenant / working-renter base with shorter leases.
- Market conditions: 44 active listings in the ZIP; 4 units permitted in Clay County in 2024 (0 in 5+ unit buildings).
Forward outlook
- In year one you build about $2k of equity ($415 loan paydown + $1k appreciation (1.8% local appreciation)).
- Clay County population projected at -24% by 2050 — secular population decline; favor cash flow + early exit over multi-decade hold.
- At projected returns (1.8% appreciation + 3.0% rent growth), your $17k cash investment doubles in ~3 years — after that, you're playing with house money.
Negotiation context
- It's been on market 73 days — a 6% lower offer ($56k) is reasonable based on typical stale-listing flexibility.
- 2 sale attempts; this cycle's ask has dropped $15k (20%) from the opening price — seller is motivated, your offer sets the floor, not the list.
- Current owner paid $23k; list at $60k implies a 161% gain — meaningful room to come down on a strong offer.
Risks & watch-outs
- Climate carrying-cost: extreme-heat days projected 7→21/yr by 2055 (HVAC capex compounding) — expect insurance premiums to compound above CPI over the hold.
Questions for the listing agent
- It's been on market 73 days. Have you received any prior offers? Is the seller open to a 6% concession, seller financing, or rate buy-down credit?
- Why hasn't it sold? Are there any deal-killer items the seller is aware of (foundation, flood, title, zoning, code violations)?
- Is there a deadline driving the sale (1031 exchange, divorce, estate, relocation)? That informs how much negotiation room exists.
- Schools are D-rated, which usually means shorter tenancies and higher turnover. Who's the typical renter profile here, and what's been the actual vacancy rate?
- What's the average days-on-market for RENTAL listings here right now (not sales)? A rising rental-DOM trend means longer vacancies and softer asking-rent achievability than the comps imply.
- What's the recent tenant-quality profile in this submarket — average credit score on applications, eviction rate, late-payment / NSF rate, and stable-employment percentage? A property-management company in the area should have these aggregated.
- How much new for-sale + rental construction is in the pipeline within 1–3 miles? Heavy new supply typically softens prices + rents 12–24 months out; constrained supply supports both.
Investment metrics
- 1% rule
- 1.77% ✓
- Cap rate
- 14.79%
- Cash-on-cash
- 30.34%
- DSCR
- 2.35
- GRM
- 4.7
CMA / ARV
- ARV (median comp)
- $89,841
- List price
- $60,000
- Delta
- -33.22%
- Verdict
- UNDERPRICED
- Comps
- 20 within 1.0 mi
Show comp detail 12 sales within ~0.75 mi
| Address | Dist | Beds/Ba | Sqft | Sold | Price | $/sf | Match |
|---|---|---|---|---|---|---|---|
| 902 Polk St | 0.09mi | 2/1.0 | 1,368 (+6%) | 9mo | $78,000 | $57 | 79 |
| 803 Sand Ave | 0.37mi | 3/2.0 (+1) | 1,316 (+2%) | 2mo | $76,000 | $58 | 70 |
| 1400 Lockwood | 0.33mi | 3/1.0 (+1) | 1,345 (+4%) | 12mo | $107,000 | $80 | 63 |
| 901 W 6th St | 0.11mi | 3/1.0 (+1) | 1,133 (-13%) | 13mo | $115,000 | $102 | 58 |
| 409 SW 3rd St | 0.39mi | 3/1.0 (+1) | 1,120 (-14%) | 2mo | $93,000 | $83 | 52 |
| 204 N Mckinley Ave N | 0.62mi | 2/1.0 | 1,188 (-8%) | 6mo | $15,000 | $13 | 52 |
| 1405 Plainview St | 0.68mi | 3/1.0 (+1) | 1,200 (-7%) | 0mo | $142,000 | $118 | 51 |
| 1405 Plainview St | 0.68mi | 3/1.0 (+1) | 1,200 (-7%) | 6mo | $15,000 | $13 | 46 |
| 1300 Overdene St | 0.73mi | 2/1.0 | 1,196 (-8%) | 11mo | $92,500 | $77 | 44 |
| 202 E Main St | 0.67mi | 3/1.0 (+1) | 1,156 (-11%) | 10mo | $107,900 | $93 | 37 |
| 100 N Stephans Ln | 0.72mi | 2/1.0 | 1,468 (+13%) | 15mo | $90,000 | $61 | 32 |
| 105 NW 1st St | 0.71mi | 3/1.0 (+1) | 1,144 (-12%) | 14mo | $85,000 | $74 | 31 |
Match score weights: distance 35% · size 25% · config 20% · recency 20%. Top-matched comps best support the ARV.
Projected returns pro-forma
1.83% appreciation · 3.0% rent growth · sell at horizon
- IRR
- 34.2%
- Equity multiple
- 2.82×
- Total profit
- $30,658
- Equity at exit
- $23,110
- IRR
- 35.5%
- Equity multiple
- 5.52×
- Total profit
- $76,010
- Equity at exit
- $32,856
Cash invested: $16,800 (down + closing). Projections, not guarantees.
Landlord ↔ Tenant lean methodology
- Overall (STATE)
- 92 Strongly Landlord-Friendly
- State Arkansas
- 92 Strongly Landlord-Friendly · R+14
- County
- — inherits STATE
- City
- — inherits STATE
ZIP-level market 72422
- Home prices YoY
- 1.0%
- Active inventory
- 44
- Price-to-rent
- 4.7×
Monthly cashflow live
- Estimated rent
- $1,062 medium interval (Pro) →
- Mortgage (P&I)
- −$315
- Tax est. 1.5%
- −$75 /mo · $900/yr
- Insurance
- −$25
- HOA
- −$0
- Vacancy / Maint / Mgmt
- −$223
- Net cashflow
- $425
Break-even live
UW: 25.0% down · 7.5% · 30yr · 1.5% tax · 5.0% vac · 8.0% maint · 8.0% mgmt
Financing live
Cash to close
- Down payment
- $15,000
- Closing costs
- $1,800
- Reserves months
- —
- Total cash needed
- —
Loan-product check · same deal, 3 products live
Conventional
25% down · 7.5% · 30yr
- Down + closing
- —
- Monthly P&I
- —
- Monthly cashflow
- —
- DSCR
- —
- Eligible?
- —
Personal DTI + credit; lowest rate.
DSCR
20% down · 8.5% · 30yr
- Down + closing
- —
- Monthly P&I
- —
- Monthly cashflow
- —
- DSCR
- —
- Eligible?
- —
No personal income docs; deal must DSCR.
Hard money
10% down · 12.0% · 12mo
- Down + closing
- —
- Monthly P&I
- —
- Monthly cashflow
- —
- DSCR
- —
- Eligible?
- —
Short-term bridge; refi at stabilization.
Listing history 20 events
-
2026-06-19days on market $60,000 Active 73 DOM
-
2026-06-18days on market $60,000 Active 72 DOM
-
2026-06-17days on market $60,000 Active 71 DOM
-
2026-06-16days on market $60,000 Active 70 DOM
-
2026-06-15days on market $60,000 Active 69 DOM
-
2026-06-14days on market $60,000 Active 67 DOM
-
2026-06-12days on market $60,000 Active 66 DOM
-
2026-06-09days on market $60,000 Active 63 DOM
-
2026-06-08statusdays on market $60,000 Active 62 DOM
-
2026-06-07days on market $60,000 Price Change 61 DOM
-
2026-06-03days on market $60,000 Price Change 57 DOM
-
2026-06-02days on market $60,000 Price Change 56 DOM
-
2026-06-01pricestatusdays on market $60,000 Price Change 55 DOM
-
2026-05-31days on market $65,000 Active 54 DOM
-
2026-05-30days on market $65,000 Active 53 DOM
-
2026-04-28price $65,000 394-char remark
Show marketing remark (394 chars)
Check out this cozy 2 bedroom home located in Corning, AR! Situated on a huge corner lot, this home has everything that you need. The carport was closed in creating extra living space, drive way has a covered parking pad, and don't miss the 20 x 30 outbuilding out back with a fenced-in back yard too. HVAC is a 2023 and the refrigerator stays. Call for an appointment. Selling AS IS, WHERE IS.
-
2026-04-27price $65,000 394-char remark
Show marketing remark (394 chars)
Check out this cozy 2 bedroom home located in Corning, AR! Situated on a huge corner lot, this home has everything that you need. The carport was closed in creating extra living space, drive way has a covered parking pad, and don't miss the 20 x 30 outbuilding out back with a fenced-in back yard too. HVAC is a 2023 and the refrigerator stays. Call for an appointment. Selling AS IS, WHERE IS.
-
2026-04-08$75,000 Active 394-char remark
Show marketing remark (394 chars)
Check out this cozy 2 bedroom home located in Corning, AR! Situated on a huge corner lot, this home has everything that you need. The carport was closed in creating extra living space, drive way has a covered parking pad, and don't miss the 20 x 30 outbuilding out back with a fenced-in back yard too. HVAC is a 2023 and the refrigerator stays. Call for an appointment. Selling AS IS, WHERE IS.
-
2026-04-07$75,000 New Listing 394-char remark
Show marketing remark (394 chars)
Check out this cozy 2 bedroom home located in Corning, AR! Situated on a huge corner lot, this home has everything that you need. The carport was closed in creating extra living space, drive way has a covered parking pad, and don't miss the 20 x 30 outbuilding out back with a fenced-in back yard too. HVAC is a 2023 and the refrigerator stays. Call for an appointment. Selling AS IS, WHERE IS.
-
1997-09-23soldstatus $23,000
ⓘ Source: listings_history table (triggers on properties + properties_extension) + one-shot
backfill from property_details.listing_events for pre-trigger history.
Climate risk First Street
- Flood 1/10 Low FEMA zone X (unshaded) · 0% chance over 30 yrs
- Wildfire 1/10 Low
- Heat 6/10 Major 7 d/yr ≥110°F today · 21 d/yr by 30 yrs out
- Wind 3/10 Moderate 6% chance of damaging wind over 30 yrs
- Air quality 1/10 Low 0 unhealthy d/yr today · 0 by 30 yrs out
Nearby sold comps map
Loading sold comps map…
Walkable amenities ~0.75 mi
Loading nearby amenities…
Taxation est. · year 1
- Rental income
- $12,750
- − Mortgage interest
- −$3,361
- − Property taxes
- −$900
- − Insurance
- −$300
- − Repairs & maintenance
- −$1,020
- − Management
- −$1,020
- − Depreciation
- −$1,745
- Taxable income
- $4,404
- Est. tax owed @ 24.0%
- −$1,057
- After-tax cash flow
- $4,040/yr
For passive investors: Depreciation is non-cash, so a rental often shows a tax loss while cash-flowing — sheltering income. Rental losses are passive: they offset passive income freely, and up to $25,000/yr can offset ordinary (W-2) income if you actively participate and your MAGI is under $100k (phasing out to $0 by $150k); unused losses carry forward. On sale, claimed depreciation is recaptured at up to 25%, and gains may owe capital-gains tax (a 1031 exchange can defer both). Figures are a year-1 estimate at your 24.0% rate — not tax advice; consult a CPA.
Schools (NCES district)
- District
- Corning School District
- NCES district ID
- 0500009
- Math proficiency
- 33% ▼ -8.00%
- Reading proficiency
- 38% ▼ -8.00%
- Median HH income
- $28,919
- Composite
- 28.73/100
- National rank
- #6679
- State rank
- #123 of 238 in AR
Livability — Corning
- Score
- 71/100
- State rank
- #38
- US rank
- #6594
Category grades
Schools grade is shown separately in the Schools card above.
Census & demographics
- Census place
- Corning, AR
- Population (ZIP)
- 4,302
Population outlook (Clay County) Hauer SSP2
- Today (2025)
- 13,564 people
- By 2030
- 12,834 · -5.4%
- By 2040
- 11,498 · -15.2%
- By 2050
- 10,325 · -23.9%
- By 2075
- 8,228 · -39.3%
- By 2100
- 6,675 · -50.8%
Race, ethnicity, and origin ACS 2023
- Neighborhood character
- Predominantly White (93%)
- Race & ethnicity
- White 93% Two or more races 6%
- Common ancestry
- Lithuanian 2% Italian 1%
- Foreign-born
- 1% · Canada
- Languages at home
- 99% English-only · Spanish 1%
Political lean MEDSL · Clay
- 2024 margin
- Solid R (+61.6) · D 18.3% · R 79.9% · Other 1.9%
- 2008→2024 swing
- -47.3pp toward R · 2008: -14.3pp · 2024: -61.6pp
- All cycles
- 2024: R+61.6 2020: R+60.3 2016: R+29.8 2012: R+29.1 2008: R+14.3
Not yet ingested
- Civics
- —
Market trends
- HPI YoY
- ▲ 1.83%
- Current HPI
- 191.7305
- Rent YoY
- —
- Metro
- —
- State GDP YoY
- ▲ 3.80%
- F500 in state
- 10
Industry mix (Fortune 500 HQ in AR)
| Industry | F500 HQs | Revenue |
|---|---|---|
| Retail | 1 | $681B |
|
||
| Food / Agriculture | 1 | $53B |
|
||
| Retail / Energy | 1 | $22B |
|
||
| Transportation / Logistics | 1 | $12B |
|
||
| Energy | 1 | $4B |
|
||
Price history
+182.6% since first listed5 events — show timeline
- 2026-04-28 Price Changed $65,000 CARMLS
- 2026-04-27 Price Changed $65,000 NEABOR MLS
- 2026-04-08 Listed $75,000 NEABOR MLS
- 2026-04-07 Listed $75,000 CARMLS
- 1997-09-23 Sold (Public Records) $23,000 Public Records
Property tax history
+0.0%/yrLatest (2018): $2 · +0.0% YoY. Source: county tax records.
Cash-flow waterfall
monthlySold comps — $/sqft
last 12 mo · ≤1 miLoading sold comps…