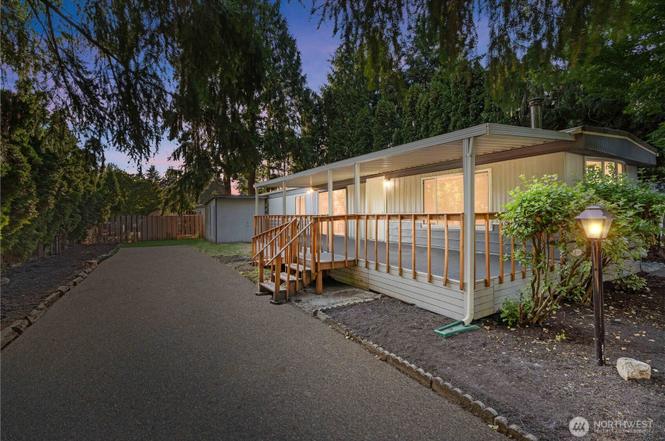
800 29 TH St SE Unit G-12 · Auburn, WA
Flood risk 1/10 · Minimal
- FEMA flood zone
- X (unshaded)
- Chance of flooding over 30 yrs
- 0.0%
- Est. flood insurance / yr
- $507 – $1,088
Fire risk 1/10 · Minimal
- Est. fire insurance / yr
- $604 – $1,122
Heat risk 3/10 · Minor
- Hot days now (above 87°F)
- 7 days/yr
- Hot days in 30 yrs
- 15 days/yr
Wind risk 1/10 · Minimal
- Chance of severe wind over 30 yrs
- —
Air-quality risk 7/10 · Major
- Unhealthy air days now
- 10 days/yr
- Unhealthy air days in 30 yrs
- 11 days/yr
Risk factors via First Street. Map © Google.
Why this score? — see what drove the B+ grade
The composite is a weighted blend of 9 inputs, each scored 0–100. Each bar is that input's sub-score; the figure is the points it added to the 100-point composite (weight × sub-score).
- Cash flow +30.0/30.0
- ARV discount +15.0/15.0
- 1% rule +10.0/10.0
- DSCR +10.0/10.0
- Schools +4.7/10.0
- Livability +4.0/5.0
- Rent growth +2.9/5.0
- Condition / age +2.5/5.0
- Appreciation +0.0/10.0
$89,000
🖨 Deal sheet 📄 Offer letter ✓ Due diligence
Listing remarks
WELCOME to your new home located in this peaceful 55+ community of Auburn. This cozy, light-filled 2 bed/1 bath retreat is ready for you to start your next chapter in life. Equipped with so many updates throughout - these include a BRAND NEW roof, New freshly painted interior walls, New flooring, New recessed lighting, New oven, New toilet, New washer/dryer & a New furnace equipped with foils to add a heat pump. The built-ins and wood burning fireplace add charm & function, while the Newly carpeted front deck invites you to relax or entertain w/ ease. Its spacious driveway & low maintenance yard make daily living simple. The insulated storage shed offers extra space for y
Key facts
- New furnace
- New flooring
- New oven
Tags
Property features AI
Finance
- Other: Manufactured home park approved for sale
- Financial info: Listing terms: Cash or Conventional
- HOA & community: Located in SkyLark Village II (senior community); Land lease of $1,248
Exterior
- Parking: Uncovered parking
- Utilities: Public water (billed by park); Public sewer (billed by park); Puget Sound Energy power; Comcast cable and internet; Energy sources: Electric and wood
- Home design: Manufactured home (single wide); One story; Manufacturer: KENTWOOD, Model 70/14; Good condition; Composition roof
- Construction: Single wide manufactured construction; Composition roof; Mobile home remains on site
- Exterior features: Patio/porch/deck; Double pane windows; Ceiling fan(s); Bath off primary
Interior
- Kitchen: Dishwasher; Garbage disposal; Microwave; Refrigerator; Stove/Range
- Bedrooms: 2 bedrooms
- Flooring: Laminate flooring
- Bathrooms: 1 full bathroom (includes bathtub and shower)
- Heating & cooling: Forced air heating; Wall unit(s) for heating/cooling; Cooling available
- Interior features: Fireplace (wood burning)
- Laundry & utility: Utility room
Neighborhood map
What this means for you Summary
Snapshot
- This is a 2-bed/1.0-bath manufactured listed at $89k.
Deal economics
- At list price, monthly cash flow is $730 ($9k/yr) — positive.
- The deal already cash-flows at list — no discount required.
- Meets the 1% rule at list price ($2k rent vs $89k).
- Recommended offer: $78k (12.0% below list) — sets the bar for market timing.
- Cap rate 16.1% vs local median 2.7% in Auburn — top-decile yield for the area; either an underpriced asset or a hidden risk that comps aren't pricing in. Stress-test before assuming the spread holds.
Location & tenants
- Location reads 81/100 on livability (#75 in WA, #1,371 nationally) — a professional / high-income tenant draw. Strengths: amenities A+, commute A+, employment A+; Watch: crime F, cost of living F.
- Auburn School District (urban): math 47% / reading 56% proficiency, ranked #125 of 291 in WA (top 43%) — acceptable for families but not a draw, mixed tenant base, ~2y average lease.
- Market conditions: Rents rising (+1.5%/yr); 171 active listings in the ZIP; 15 comparable units currently listed for rent nearby; rentals leasing fast (median 5d on market — plan ~1-2 weeks tenant-placement turnaround); solid renter incomes; 10,555 units permitted in King County in 2024 (7,119 in 5+ unit buildings).
Forward outlook
- Local home prices are declining (-3.0%/yr); year-one equity from $615 of loan paydown is wiped out by about $3k of value loss. Plan a longer hold.
- King County population projected at +44% by 2050 — long-run rental-demand tailwind backs the buy-and-hold thesis.
- At projected returns (-3.0% appreciation + 1.5% rent growth), your $25k cash investment doubles in ~4 years — after that, you're playing with house money.
Negotiation context
- It's been on market 150 days — a 12% lower offer ($78k) is reasonable based on typical stale-listing flexibility.
- 2 sale attempts since 20y ago with the ask held roughly flat each time — persistent listings suggest the price (not the market) is what's stuck; bring a comps-based counter.
- Current owner paid $14k; list at $89k implies a 514% gain — meaningful room to come down on a strong offer.
Questions for the listing agent
- It's been on market 150 days. Have you received any prior offers? Is the seller open to a 12% concession, seller financing, or rate buy-down credit?
- Built in 1977 — when were the roof, HVAC, electrical panel, plumbing, and water heater last replaced?
- Why hasn't it sold? Are there any deal-killer items the seller is aware of (foundation, flood, title, zoning, code violations)?
- Is there a deadline driving the sale (1031 exchange, divorce, estate, relocation)? That informs how much negotiation room exists.
- Crime grade is F in this area — have there been break-ins, vandalism, or insurance claims at this property in the last 3 years? What carrier currently insures it and at what premium?
- What's the average days-on-market for RENTAL listings here right now (not sales)? A rising rental-DOM trend means longer vacancies and softer asking-rent achievability than the comps imply.
- What's the recent tenant-quality profile in this submarket — average credit score on applications, eviction rate, late-payment / NSF rate, and stable-employment percentage? A property-management company in the area should have these aggregated.
- How much new for-sale + rental construction is in the pipeline within 1–3 miles? Heavy new supply typically softens prices + rents 12–24 months out; constrained supply supports both.
Investment metrics
- 1% rule
- 1.91% ✓
- Cap rate
- 16.14%
- Cash-on-cash
- 35.17%
- DSCR
- 2.56
- GRM
- 4.4
CMA / ARV
- ARV (on-the-fly)
- $114,660
- Comps found
- 12
Show comp detail 12 sales within ~0.75 mi
| Address | Dist | Beds/Ba | Sqft | Sold | Price | $/sf | Match |
|---|---|---|---|---|---|---|---|
| 800 29 TH St SE Unit G-12 | 0.00mi | 2/1.0 | 980 (0%) | 0mo | $86,000 | $88 | 100 |
| 900 29th St SE Unit D-11 | 0.12mi | 3/2.0 (+1) | 960 (-2%) | 3mo | $71,750 | $75 | 80 |
| 401 37th St SE #110 | 0.40mi | 3/1.0 (+1) | 980 (0%) | 3mo | $127,000 | $130 | 74 |
| 3225 M St SE #131 | 0.30mi | 2/2.0 | 900 (-8%) | 8mo | $105,000 | $117 | 62 |
| 401 37th St SE #112 | 0.49mi | 3/2.0 (+1) | 980 (0%) | 11mo | $134,000 | $137 | 60 |
| 401 37th St SE #109 | 0.48mi | 3/2.0 (+1) | 980 (0%) | 14mo | $126,500 | $129 | 57 |
| 210 37th St SE #64 | 0.67mi | 2/2.0 | 960 (-2%) | 7mo | $72,000 | $75 | 55 |
| 401 37th St SE #20 | 0.49mi | 2/1.0 | 896 (-9%) | 12mo | $100,000 | $112 | 53 |
| 418 37th St SE | 0.54mi | 3/2.0 (+1) | 924 (-6%) | 8mo | $225,000 | $244 | 50 |
| 2302 R St SE #55 | 0.69mi | 2/1.0 | 849 (-13%) | 1mo | $23,500 | $28 | 45 |
| 607 37th St SE #77 | 0.45mi | 3/2.0 (+1) | 1,120 (+14%) | 4mo | $135,000 | $121 | 43 |
| 2302 R St SE #59 | 0.69mi | 2/1.5 | 1,100 (+12%) | 14mo | $55,000 | $50 | 34 |
Match score weights: distance 35% · size 25% · config 20% · recency 20%. Top-matched comps best support the ARV.
Projected returns pro-forma
-3.0% appreciation · 1.51% rent growth · sell at horizon
- IRR
- 29.0%
- Equity multiple
- 2.19×
- Total profit
- $29,605
- Equity at exit
- $13,270
- IRR
- 35.5%
- Equity multiple
- 4.04×
- Total profit
- $75,762
- Equity at exit
- $7,695
Cash invested: $24,920 (down + closing). Projections, not guarantees.
Landlord ↔ Tenant lean methodology
- Overall (STATE)
- 28 Tenant-Leaning
- State Washington
- 28 Tenant-Leaning · D+8
- County
- — inherits STATE
- City
- — inherits STATE
ZIP-level market 98002
- Rents YoY
- 1.5%
- Active inventory
- 171
- Price-to-rent
- 4.4×
Monthly cashflow live
- Estimated rent
- $1,703 high interval (Pro) →
- Mortgage (P&I)
- −$467
- Tax est. 1.5%
- −$111 /mo · $1,335/yr
- Insurance
- −$37
- HOA
- −$0
- Vacancy / Maint / Mgmt
- −$358
- Net cashflow
- $730
Break-even live
UW: 25.0% down · 7.5% · 30yr · 1.5% tax · 5.0% vac · 8.0% maint · 8.0% mgmt
Financing live
Cash to close
- Down payment
- $22,250
- Closing costs
- $2,670
- Reserves months
- —
- Total cash needed
- —
Loan-product check · same deal, 3 products live
Conventional
25% down · 7.5% · 30yr
- Down + closing
- —
- Monthly P&I
- —
- Monthly cashflow
- —
- DSCR
- —
- Eligible?
- —
Personal DTI + credit; lowest rate.
DSCR
20% down · 8.5% · 30yr
- Down + closing
- —
- Monthly P&I
- —
- Monthly cashflow
- —
- DSCR
- —
- Eligible?
- —
No personal income docs; deal must DSCR.
Hard money
10% down · 12.0% · 12mo
- Down + closing
- —
- Monthly P&I
- —
- Monthly cashflow
- —
- DSCR
- —
- Eligible?
- —
Short-term bridge; refi at stabilization.
Rent comps 15 comps
| Address | Beds | Baths | Sqft | Rent | $/sqft | DOM | Units | Dist |
|---|---|---|---|---|---|---|---|---|
| 404 27th St SE Unit 19-1 Auburn, WA | 2.0 | 1.0 | 1000 | $1,750 | $1.75 | 12d | 1 | 0.24mi |
| 2455 F St SE Auburn, WA | 1.0–3.0 | 1.0–2.0 | 757 | $1,678 | $2.21 | 2d | 6 | 0.32mi |
| 2952 O St SE Unit F Auburn, WA | 2.0 | 1.0 | 1051 | $1,495 | $1.42 | 2d | 1 | 0.41mi |
| 2952 O St SE Unit D Auburn, WA | 2.0 | 1.0 | 795 | $1,375 | $1.73 | 2d | 1 | 0.41mi |
| 1526 29th St SE Auburn, WA | 2.0 | 1.0 | 912 | $1,595 | $1.75 | 24d | 1 | 0.48mi |
| 402 21st St SE Auburn, WA | 1.0–2.0 | 1.0–1.5 | 747 | $1,695 | $2.27 | 14d | 4 | 0.50mi |
| 1120 37th St SE Auburn, WA | 2.0 | 1.0 | 788 | $1,695 | $2.15 | 12d | 1 | 0.53mi |
| 1014 37th St SE Apt 4 Auburn, WA | 2.0 | 2.0 | 1005 | $1,780 | $1.77 | 5d | 1 | 0.53mi |
| 2020 F St SE Auburn, WA | 1.0–2.0 | 1.0 | 725 | $1,599 | $2.21 | 24d | 1 | 0.54mi |
| 1420 17th St SE Auburn, WA | 1.0–2.0 | 1.0 | 725 | $1,695 | $2.34 | 3d | 4 | 0.85mi |
| 732 4th Ave NE Pacific, WA | 2.0 | 1.0 | 850 | $1,805 | $2.12 | 5d | 2 | 1.01mi |
| 703 47th St SE Auburn, WA | 2.0 | 1.0–2.0 | 781 | $1,970 | $2.52 | 1d | 7 | 1.16mi |
| 111 10th St SE Unit 4 Auburn, WA | 1.0 | 1.0 | 560 | $1,295 | $2.31 | 5d | 1 | 1.19mi |
| 111 10th St SE Apt 1 Auburn, WA | 1.0 | 1.0 | 560 | $1,295 | $2.31 | 24d | 1 | 1.19mi |
| 2901 Auburn Way S Auburn, WA | 1.0–2.0 | 1.0 | 667 | $2,175 | $3.26 | 1d | 20 | 1.36mi |
Listing history 17 events
-
2026-06-17status $89,000 Pending 150 DOM
-
2026-06-17days on market $89,000 Active Under Contract 150 DOM
-
2026-06-16days on market $89,000 Active Under Contract 149 DOM
-
2026-06-15days on market $89,000 Active Under Contract 148 DOM
-
2026-06-13days on market $89,000 Active Under Contract 146 DOM
-
2026-06-13days on market $89,000 Active Under Contract 145 DOM
-
2026-06-09days on market $89,000 Active Under Contract 142 DOM
-
2026-06-08days on market $89,000 Active Under Contract 141 DOM
-
2026-06-07days on market $89,000 Active Under Contract 140 DOM
-
2026-06-04days on market $89,000 Active Under Contract 137 DOM
-
2026-06-03days on market $89,000 Active Under Contract 136 DOM
-
2026-06-02days on market $89,000 Active Under Contract 135 DOM
-
2026-06-01days on market $89,000 Active Under Contract 134 DOM
-
2026-05-31days on market $89,000 Active Under Contract 133 DOM
-
2026-01-18$89,000 Active
-
2006-08-14soldstatus $14,500
-
2006-06-15$14,500
ⓘ Source: listings_history table (triggers on properties + properties_extension) + one-shot
backfill from property_details.listing_events for pre-trigger history.
Climate risk First Street
- Flood 1/10 Low FEMA zone X (unshaded) · 0% chance over 30 yrs
- Wildfire 1/10 Low
- Heat 3/10 Moderate 7 d/yr ≥87°F today · 15 d/yr by 30 yrs out
- Wind 1/10 Low
- Air quality 7/10 Severe 10 unhealthy d/yr today · 11 by 30 yrs out
Nearby sold comps map
Loading sold comps map…
Walkable amenities ~0.75 mi
Loading nearby amenities…
Taxation est. · year 1
- Rental income
- $20,437
- − Mortgage interest
- −$4,985
- − Property taxes
- −$1,335
- − Insurance
- −$445
- − Repairs & maintenance
- −$1,635
- − Management
- −$1,635
- − Depreciation
- −$2,589
- Taxable income
- $7,812
- Est. tax owed @ 24.0%
- −$1,875
- After-tax cash flow
- $6,889/yr
For passive investors: Depreciation is non-cash, so a rental often shows a tax loss while cash-flowing — sheltering income. Rental losses are passive: they offset passive income freely, and up to $25,000/yr can offset ordinary (W-2) income if you actively participate and your MAGI is under $100k (phasing out to $0 by $150k); unused losses carry forward. On sale, claimed depreciation is recaptured at up to 25%, and gains may owe capital-gains tax (a 1031 exchange can defer both). Figures are a year-1 estimate at your 24.0% rate — not tax advice; consult a CPA.
Schools (NCES district)
- District
- Auburn School District
- NCES district ID
- 5300300
- Math proficiency
- 47% ▼ -3.00%
- Reading proficiency
- 56% ▼ -1.00%
- Median HH income
- $58,048
- Composite
- 46.73/100
- National rank
- #5240
- State rank
- #125 of 291 in WA
Livability — Auburn
- Score
- 81/100
- State rank
- #75
- US rank
- #1371
Category grades
Schools grade is shown separately in the Schools card above.
Census & demographics
- Census place
- Auburn, WA
- County
- King County · 2,251,916 people
- City population
- 74,969
- Metro
- Seattle-Tacoma-Bellevue, WA
- Population (ZIP)
- 37,509
- Household income
- $78,684
- Rent vs Own
- Severe rent burden
- 2202.0
Population outlook (King County) Hauer SSP2
- Today (2025)
- 2,576,485 people
- By 2030
- 2,803,316 · +8.8%
- By 2040
- 3,255,921 · +26.4%
- By 2050
- 3,706,444 · +43.9%
- By 2075
- 4,746,063 · +84.2%
- By 2100
- 5,407,730 · +109.9%
Race, ethnicity, and origin ACS 2023
- Neighborhood character
- Highly diverse neighborhood (Simpson 0.72)
- Race & ethnicity
- White 46% Hispanic / Latino 24% Two or more races 13% Black 12% Asian 6% Pacific Islander 4% Native American 2%
- Hispanic origin (detail)
- Mexican 20%
- Common ancestry
- Portuguese 4% Subsaharan African 4% Lithuanian 3%
- Foreign-born
- 24% · Canada, Vietnam
- Languages at home
- 63% English-only · Spanish 19% Russian/Polish/Slavic 6% Other Asian/Pacific 3%
Political lean MEDSL · King
- 2024 margin
- Solid D (+51.7) · D 74.2% · R 22.5% · Other 3.4%
- 2008→2024 swing
- +9.6pp toward D · 2008: 42.1pp · 2024: 51.7pp
- All cycles
- 2024: D+51.7 2020: D+52.7 2016: D+50.4 2012: D+39.9 2008: D+42.1
Not yet ingested
- Civics
- —
Market trends
- HPI YoY
- ▼ -677.96%
- Current HPI
- 298.0849
- Rent YoY
- ▲ 1.51%
- Metro
- Seattle-Tacoma-Bellevue, WA
- State GDP YoY
- ▲ 4.65%
- F500 in state
- 22
Industry mix (Fortune 500 HQ in WA)
| Industry | F500 HQs | Revenue |
|---|---|---|
| Retail | 2 | $269B |
|
||
| Technology / Retail | 1 | $638B |
|
||
| Technology | 1 | $245B |
|
||
| Telecommunications | 1 | $38B |
|
||
| Food / Beverage | 1 | $36B |
|
||
| Automotive / Trucks | 1 | $34B |
|
||
Price history
+513.8% since first listed3 events — show timeline
- 2026-01-18 Listed $89,000 NWMLS as Distributed by MLS Grid
- 2006-08-14 Sold (MLS) $14,500 NWMLS as Distributed by MLS Grid
- 2006-06-15 Listed $14,500 NWMLS as Distributed by MLS Grid
Cash-flow waterfall
monthlySold comps — $/sqft
last 12 mo · ≤1 miLoading sold comps…