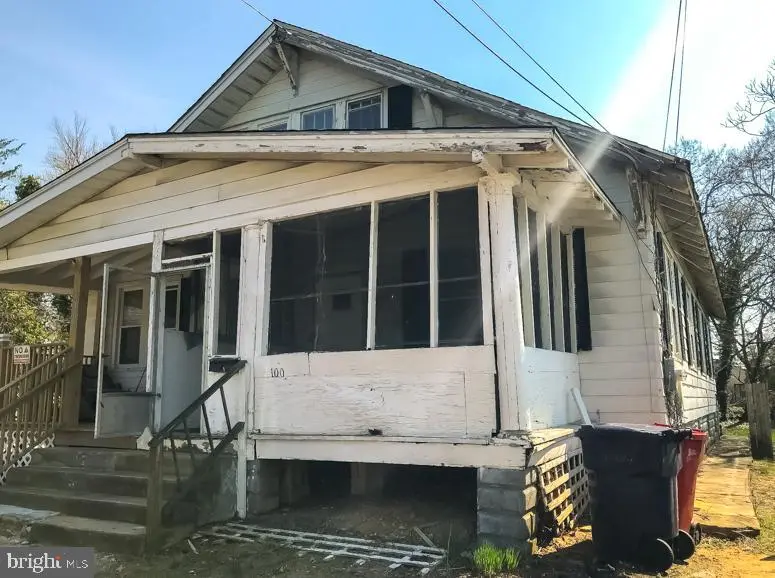
100 Martin Luther King Jr · Bridgeton, NJ
Flood risk 1/10 · Minimal
- FEMA flood zone
- X (unshaded)
- Chance of flooding over 30 yrs
- 0.0%
- Est. flood insurance / yr
- $507 – $1,088
Fire risk 3/10 · Minor
- Est. fire insurance / yr
- $526 – $976
Heat risk 7/10 · Major
- Hot days now (above 102°F)
- 7 days/yr
- Hot days in 30 yrs
- 15 days/yr
Wind risk 6/10 · Moderate
- Chance of severe wind over 30 yrs
- 75.0%
Air-quality risk 3/10 · Minor
- Unhealthy air days now
- 2 days/yr
- Unhealthy air days in 30 yrs
- 3 days/yr
Risk factors via First Street. Map © Google.
Why this score? — see what drove the B grade
The composite is a weighted blend of 9 inputs, each scored 0–100. Each bar is that input's sub-score; the figure is the points it added to the 100-point composite (weight × sub-score).
- Cash flow +30.0/30.0
- ARV discount +15.0/15.0
- 1% rule +10.0/10.0
- DSCR +10.0/10.0
- Livability +3.6/5.0
- Rent growth +2.5/5.0
- Condition / age +2.5/5.0
- Schools +1.0/10.0
- Appreciation +0.0/10.0
$79,500
🖨 Deal sheet 📄 Offer letter ✓ Due diligence
Listing remarks
Prepped for renovation. Fixer upper. Large twin. Excellent opportunity for a D. I. Y owner occupant or Investor. As-Is Sale. Buyer responsible for Certificate of Occupancy, permits, certifications, due diligence, and any building requirements.
Key facts
- 4 parking spots
- Built 1940
- Listed 23 days
Property features AI
Finance
- Other: Ownership: Fee simple
Exterior
- Parking: Driveway parking; Driveway holds about 4 vehicles; Total of 4 garage and parking spaces
- Utilities: Public water; Public sewer
- Home design: Semi-detached property; Main entrance faces northeast
- Construction: Block construction; Block foundation; Year built source: assessor
- Exterior features: Lot approximately 36 x 148; No tidal water; Other structures listed as above grade and below grade
Interior
- Kitchen: Kitchen (appliances not specified)
- Bedrooms: Two bedrooms on the upper level
- Bathrooms: One full bathroom on the main level; One full bathroom total
- Heating & cooling: Baseboard hot water heating; Oil-fired heating
- Interior features: Living room; Dining room; Kitchen; Basement (unfinished)
- Laundry & utility: Hot water system (other type)
Neighborhood map
What this means for you Summary
Snapshot
- This is a 2-bed/1.0-bath townhouse listed at $80k.
Deal economics
- At list price, monthly cash flow is $579 ($7k/yr) — positive.
- The deal already cash-flows at list — no discount required.
- Meets the 1% rule at list price ($2k rent vs $80k).
- Recommended offer: $78k (1.5% below list) — sets the bar for market timing.
- Cap rate 15.0% vs local median 4.9% in Bridgeton — top-decile yield for the area; either an underpriced asset or a hidden risk that comps aren't pricing in. Stress-test before assuming the spread holds.
Location & tenants
- Location reads 71/100 on livability (#240 in NJ) — a middle-class / working-renter tenant base. Strengths: commute A+, health & safety A+, housing A-; Watch: employment D, schools F, crime F.
- Bridgeton City School District (town): math 4% / reading 21% proficiency, ranked #468 of 472 in NJ (top 99%) — low school quality limits family demand, transient renter base, plan for 1-2y turnover.
- Market conditions: 201 active listings in the ZIP; 6 comparable units currently listed for rent nearby; rentals at typical pace (median 24d on market — plan ~3-4 weeks tenant-placement turnaround); 216 units permitted in Cumberland County in 2024 (73 in 5+ unit buildings).
Forward outlook
- Local home prices are declining (-3.0%/yr); year-one equity from $550 of loan paydown is wiped out by about $2k of value loss. Plan a longer hold.
- Cumberland County population projected to shrink 7% by 2050 — rents likely to lag national; underwrite the cash flow, not the appreciation.
- At projected returns (-3.0% appreciation + 3.0% rent growth), your $22k cash investment doubles in ~4 years — after that, you're playing with house money.
Negotiation context
- It's been on market 23 days — a 2% lower offer ($78k) is reasonable based on typical stale-listing flexibility.
- Current owner paid $28k; list at $80k implies a 184% gain — meaningful room to come down on a strong offer.
Risks & watch-outs
- Watch-outs: property tax is 2.6% of price; built in 1940 — expect roof / HVAC / electrical / plumbing capex.
- Climate carrying-cost: major wind risk, 75% chance of damaging wind over 30y; extreme-heat days projected 7→15/yr by 2055 (HVAC capex compounding) — expect insurance premiums to compound above CPI over the hold.
Questions for the listing agent
- Built in 1940 — when were the roof, HVAC, electrical panel, plumbing, and water heater last replaced?
- Property tax is high relative to price — has the assessment been appealed recently, and will the sale trigger a re-assessment?
- Is there a deadline driving the sale (1031 exchange, divorce, estate, relocation)? That informs how much negotiation room exists.
- Schools are F-rated, which usually means shorter tenancies and higher turnover. Who's the typical renter profile here, and what's been the actual vacancy rate?
- Crime grade is F in this area — have there been break-ins, vandalism, or insurance claims at this property in the last 3 years? What carrier currently insures it and at what premium?
- What's the average days-on-market for RENTAL listings here right now (not sales)? A rising rental-DOM trend means longer vacancies and softer asking-rent achievability than the comps imply.
- What's the recent tenant-quality profile in this submarket — average credit score on applications, eviction rate, late-payment / NSF rate, and stable-employment percentage? A property-management company in the area should have these aggregated.
- How much new for-sale + rental construction is in the pipeline within 1–3 miles? Heavy new supply typically softens prices + rents 12–24 months out; constrained supply supports both.
Investment metrics
- 1% rule
- 1.91% ✓
- Cap rate
- 15.04%
- Cash-on-cash
- 31.22%
- DSCR
- 2.39
- GRM
- 4.4
CMA / ARV
- ARV (on-the-fly)
- $106,920
- Comps found
- 4
Show comp detail 4 sales within ~0.75 mi
| Address | Dist | Beds/Ba | Sqft | Sold | Price | $/sf | Match |
|---|---|---|---|---|---|---|---|
| 174 South Ave | 0.26mi | 2/1.0 | 1,071 (-1%) | 21mo | $100,000 | $93 | 69 |
| 27 Church St | 0.42mi | 2/1.0 | 990 (-8%) | 7mo | $110,000 | $111 | 61 |
| 53 Elmer St | 0.52mi | 3/1.0 (+1) | 1,178 (+9%) | 1mo | $116,600 | $99 | 55 |
| 65 Vine St | 0.69mi | 2/1.0 | 1,205 (+12%) | 13mo | $115,000 | $95 | 37 |
Match score weights: distance 35% · size 25% · config 20% · recency 20%. Top-matched comps best support the ARV.
Projected returns pro-forma
-3.0% appreciation · 3.0% rent growth · sell at horizon
- IRR
- 26.1%
- Equity multiple
- 2.08×
- Total profit
- $24,074
- Equity at exit
- $11,854
- IRR
- 33.8%
- Equity multiple
- 4.09×
- Total profit
- $68,733
- Equity at exit
- $6,874
Cash invested: $22,260 (down + closing). Projections, not guarantees.
Landlord ↔ Tenant lean methodology
- Overall (STATE)
- 21 Tenant-Leaning
- State New Jersey
- 21 Tenant-Leaning · D+6
- County
- — inherits STATE
- City
- — inherits STATE
ZIP-level market 08302
- Home prices YoY
- -24.0%
- Active inventory
- 201
- Price-to-rent
- 4.4×
Monthly cashflow live
- Estimated rent
- $1,517 high interval (Pro) →
- Mortgage (P&I)
- −$417
- Tax from tax record
- −$169 /mo · $2,032/yr
- Insurance
- −$33
- HOA
- −$0
- Vacancy / Maint / Mgmt
- −$319
- Net cashflow
- $579
Break-even live
UW: 25.0% down · 7.5% · 30yr · 1.5% tax · 5.0% vac · 8.0% maint · 8.0% mgmt
Financing live
Cash to close
- Down payment
- $19,875
- Closing costs
- $2,385
- Reserves months
- —
- Total cash needed
- —
Loan-product check · same deal, 3 products live
Conventional
25% down · 7.5% · 30yr
- Down + closing
- —
- Monthly P&I
- —
- Monthly cashflow
- —
- DSCR
- —
- Eligible?
- —
Personal DTI + credit; lowest rate.
DSCR
20% down · 8.5% · 30yr
- Down + closing
- —
- Monthly P&I
- —
- Monthly cashflow
- —
- DSCR
- —
- Eligible?
- —
No personal income docs; deal must DSCR.
Hard money
10% down · 12.0% · 12mo
- Down + closing
- —
- Monthly P&I
- —
- Monthly cashflow
- —
- DSCR
- —
- Eligible?
- —
Short-term bridge; refi at stabilization.
Rent comps 6 comps
| Address | Beds | Baths | Sqft | Rent | $/sqft | DOM | Units | Dist |
|---|---|---|---|---|---|---|---|---|
| 4 N Pearl St Bridgeton, NJ | 3.0 | 2.0 | 800 | $2,500 | $3.12 | 24d | 1 | 0.48mi |
| 105 Atlantic St Apt B2 Bridgeton, NJ | 3.0 | 1.0 | 1000 | $1,500 | $1.50 | 10d | 1 | 0.62mi |
| 105 Atlantic St Apt F1 Bridgeton, NJ | 2.0 | 1.0 | 1270 | $1,500 | $1.18 | 17d | 1 | 0.62mi |
| 114 Wayne Rd Unit 2A Bridgeton, NJ | 2.0 | 1.0 | 1400 | $1,625 | $1.16 | 24d | 1 | 0.92mi |
| 114 Wayne Rd Unit 1A Bridgeton, NJ | 1.0 | 1.0 | 1200 | $1,375 | $1.15 | 24d | 1 | 0.92mi |
| 111 Wayne Rd Bridgeton, NJ | 1.0–2.0 | 1.0 | 1275 | $1,625 | $1.27 | 1d | 1 | 0.93mi |
Listing history 15 events
-
2026-06-18days on market $79,500 Active 23 DOM
-
2026-06-17days on market $79,500 Active 22 DOM
-
2026-06-16days on market $79,500 Active 21 DOM
-
2026-06-15days on market $79,500 Active 20 DOM
-
2026-06-13days on market $79,500 Active 18 DOM
-
2026-06-12days on market $79,500 Active 17 DOM
-
2026-06-09days on market $79,500 Active 14 DOM
-
2026-06-08days on market $79,500 Active 13 DOM
-
2026-06-07days on market $79,500 Active 12 DOM
-
2026-06-04days on market $79,500 Active 8 DOM
-
2026-06-02days on market $79,500 Active 7 DOM
-
2026-06-01days on market $79,500 Active 6 DOM
-
2026-05-31days on market $79,500 Active 5 DOM
-
2026-05-25historical $79,500
-
1994-03-11soldstatus $28,000
ⓘ Source: listings_history table (triggers on properties + properties_extension) + one-shot
backfill from property_details.listing_events for pre-trigger history.
Tax reassessment forecast NJ · Partial reset (capped growth)
- Current annual tax
- $2,032 · $169/mo
- Projected year-2 tax
- $2,032 · $169/mo
- Expected delta
- $0/yr ($0/mo · 0.0%)
ⓘ Screening estimate from a state-policy table — verify with the county assessor before closing.
Climate risk First Street
- Flood 1/10 Low FEMA zone X (unshaded) · 0% chance over 30 yrs
- Wildfire 3/10 Moderate
- Heat 7/10 Severe 7 d/yr ≥102°F today · 15 d/yr by 30 yrs out
- Wind 6/10 Major 75% chance of damaging wind over 30 yrs
- Air quality 3/10 Moderate 2 unhealthy d/yr today · 3 by 30 yrs out
Nearby sold comps map
Loading sold comps map…
Walkable amenities ~0.75 mi
Loading nearby amenities…
Taxation est. · year 1
- Rental income
- $18,207
- − Mortgage interest
- −$4,453
- − Property taxes
- −$2,032
- − Insurance
- −$398
- − Repairs & maintenance
- −$1,457
- − Management
- −$1,457
- − Depreciation
- −$2,313
- Taxable income
- $6,098
- Est. tax owed @ 24.0%
- −$1,463
- After-tax cash flow
- $5,487/yr
For passive investors: Depreciation is non-cash, so a rental often shows a tax loss while cash-flowing — sheltering income. Rental losses are passive: they offset passive income freely, and up to $25,000/yr can offset ordinary (W-2) income if you actively participate and your MAGI is under $100k (phasing out to $0 by $150k); unused losses carry forward. On sale, claimed depreciation is recaptured at up to 25%, and gains may owe capital-gains tax (a 1031 exchange can defer both). Figures are a year-1 estimate at your 24.0% rate — not tax advice; consult a CPA.
Schools (NCES district)
- District
- Bridgeton City School District
- NCES district ID
- 3402250
- Math proficiency
- 4% ▼ -8.00%
- Reading proficiency
- 21% ▲ 3.00%
- Median HH income
- $34,542
- Composite
- 10.15/100
- National rank
- #9797
- State rank
- #468 of 472 in NJ
Livability — Bridgeton
- Score
- 71/100
- State rank
- #240
- US rank
- #6660
Category grades
Schools grade is shown separately in the Schools card above.
Census & demographics
- Census place
- Bridgeton, NJ
- Population (ZIP)
- 47,003
Population outlook (Cumberland County) Hauer SSP2
- Today (2025)
- 152,743 people
- By 2030
- 150,373 · -1.6%
- By 2040
- 146,881 · -3.8%
- By 2050
- 142,653 · -6.6%
- By 2075
- 129,468 · -15.2%
- By 2100
- 107,456 · -29.6%
Race, ethnicity, and origin ACS 2023
- Neighborhood character
- Diverse neighborhood (Simpson 0.69)
- Race & ethnicity
- Hispanic / Latino 39% White 30% Black 25% Two or more races 19% Native American 2% Asian 1%
- Hispanic origin (detail)
- Mexican 25% Puerto Rican 8% Dominican 2%
- Common ancestry
- Romanian 2%
- Foreign-born
- 17% · Canada, Jamaica
- Languages at home
- 64% English-only · Spanish 34% Other Indo-European 1%
Political lean MEDSL · Cumberland
- 2024 margin
- Toss-up / Even · D 47.6% · R 51.3% · Other 1.1%
- 2008→2024 swing
- -25.4pp toward R · 2008: 21.6pp · 2024: -3.8pp
- All cycles
- 2024: R+3.8 2020: D+6.0 2016: D+5.3 2012: D+23.1 2008: D+21.6
Not yet ingested
- Civics
- —
Market trends
- HPI YoY
- ▼ -91.94%
- Current HPI
- 290.6461
- Rent YoY
- —
- Metro
- —
- State GDP YoY
- ▲ 2.05%
- F500 in state
- 34
Industry mix (Fortune 500 HQ in NJ)
| Industry | F500 HQs | Revenue |
|---|---|---|
| Consumer Goods | 3 | $31B |
|
||
| Pharmaceuticals | 2 | $153B |
|
||
| Technology | 2 | $21B |
|
||
| Insurance | 2 | $20B |
|
||
| Healthcare | 2 | $19B |
|
||
| Financial Services | 1 | $70B |
|
||
Price history
+183.9% since first listed2 events — show timeline
- 2026-05-25 Coming Soon $79,500 BRIGHT MLS
- 1994-03-11 Sold (Public Records) $28,000 Public Records
Property tax history
+2.1%/yrLatest (2025): $2,032 · +9.5% YoY. Source: county tax records.
Cash-flow waterfall
monthlySold comps — $/sqft
last 12 mo · ≤1 miLoading sold comps…