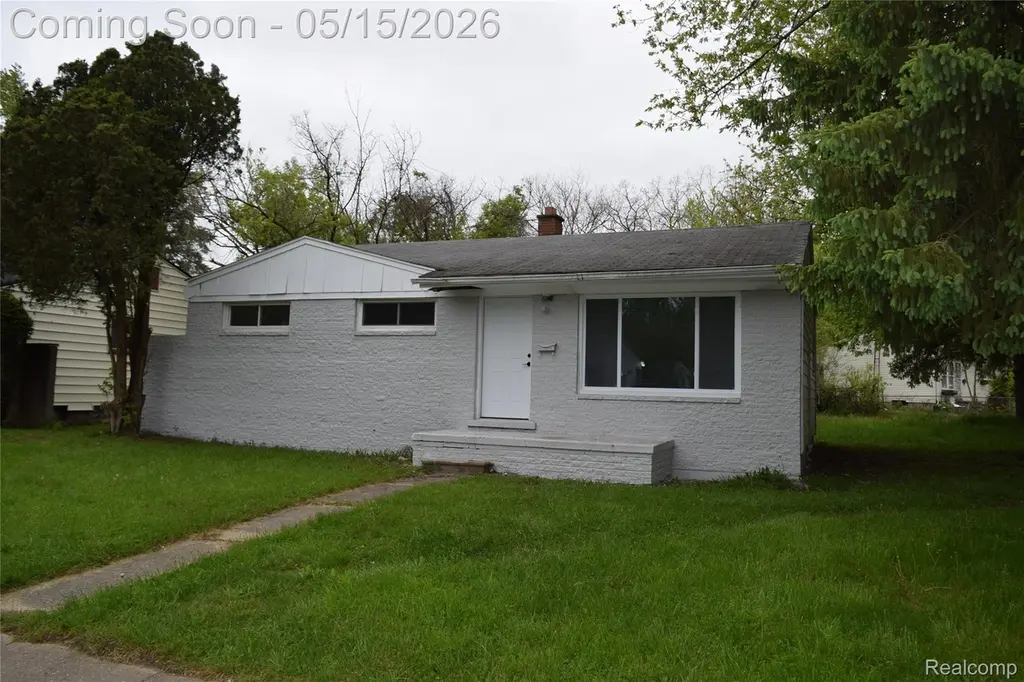
6087 Natchez Dr · Beecher, MI
Flood risk 3/10 · Minor
- FEMA flood zone
- X (unshaded)
- Chance of flooding over 30 yrs
- 0.1%
- Est. flood insurance / yr
- $473 – $860
Fire risk 1/10 · Minimal
- Est. fire insurance / yr
- $784 – $1,456
Heat risk 2/10 · Minimal
- Hot days now (above 97°F)
- 7 days/yr
- Hot days in 30 yrs
- 14 days/yr
Wind risk 2/10 · Minimal
- Chance of severe wind over 30 yrs
- —
Air-quality risk 2/10 · Minimal
- Unhealthy air days now
- 1 days/yr
- Unhealthy air days in 30 yrs
- 3 days/yr
Risk factors via First Street. Map © Google.
Why this score? — see what drove the B grade
The composite is a weighted blend of 9 inputs, each scored 0–100. Each bar is that input's sub-score; the figure is the points it added to the 100-point composite (weight × sub-score).
- Cash flow +30.0/30.0
- ARV discount +12.4/15.0
- 1% rule +10.0/10.0
- DSCR +10.0/10.0
- Livability +3.0/5.0
- Rent growth +2.5/5.0
- Condition / age +2.5/5.0
- Schools +1.0/10.0
- Appreciation +0.0/10.0
$52,000
🖨 Deal sheet 📄 Offer letter ✓ Due diligence
Listing remarks
Investor or Handyman Special. Great opportunity for a 'Flip' project or Rental Property. All the heavy lifting is done. .. the investor/owner has cleaned up this forgotten property of all the debris inside and out. This is a typical 3-bedroom ranch floor plan, with a full unfinished basement. New front and side entry doors have been installed. Some new windows have been installed, along with the newer windows already there. There are real Oak floors in the living room, hallway, and all 3 bedrooms. The wood floors are in good shape, ready to be refinished. The exterior has been painted. You are basically getting a foundation, structure, and land. The home will need: a furnace, a water heater
Key facts
- 0.24 acre lot
- Built 1957
- Listed 19 days
Property features AI
Exterior
- Parking: No garage
- Utilities: Public water; Public sewer; Circuit breaker electrical panel; Cable available
- Home design: Single-family residential; One story; Ground-level entry with steps
- Construction: Aluminum siding; Asphalt roof
- Exterior features: Front porch; Corner, irregular lot; Paved road access; Sidewalks in the community
Interior
- Bathrooms: One full bathroom
- Heating & cooling: Forced air heating; Natural gas heating; No cooling
- Interior features: Gas water heater; Full unfinished basement; Six total rooms
- Laundry & utility: Washer hookup; Electric dryer hookup
Neighborhood map
What this means for you Summary
Snapshot
- This is a 3-bed/1.0-bath single-family listed at $52k.
Deal economics
- At list price, monthly cash flow is $538 ($6k/yr) — positive.
- The deal already cash-flows at list — no discount required.
- Meets the 1% rule at list price ($1k rent vs $52k).
- Recommended offer: $51k (1.5% below list) — sets the bar for market timing.
Location & tenants
- Location reads 59/100 on livability (#603 in MI) — a working-class tenant base; expect higher turnover. Strengths: cost of living A+, housing A-; Watch: schools C-, crime F, amenities F.
- Beecher Community School District (suburban): math 7% / reading 10% proficiency, ranked #722 of 760 in MI (top 95%) — low school quality limits family demand, transient renter base, plan for 1-2y turnover; 90% free/reduced lunch — lower-income household profile, screen leases tightly.
- Market conditions: 144 active listings in the ZIP; 9 comparable units currently listed for rent nearby; rentals leasing fast (median 13d on market — plan ~1-2 weeks tenant-placement turnaround); 419 units permitted in Genesee County in 2024 (68 in 5+ unit buildings).
Forward outlook
- Local home prices are declining (-3.0%/yr); year-one equity from $360 of loan paydown is wiped out by about $2k of value loss. Plan a longer hold.
- Genesee County population projected at -27% by 2050 — secular population decline; favor cash flow + early exit over multi-decade hold.
- At projected returns (-3.0% appreciation + 3.0% rent growth), your $15k cash investment doubles in ~3 years — after that, you're playing with house money.
Negotiation context
- It's been on market 20 days — a 2% lower offer ($51k) is reasonable based on typical stale-listing flexibility.
- 2 sale attempts with the ask held roughly flat each time — persistent listings suggest the price (not the market) is what's stuck; bring a comps-based counter.
Risks & watch-outs
- Watch-outs: built in 1957 — expect roof / HVAC / electrical / plumbing capex.
Questions for the listing agent
- Built in 1957 — when were the roof, HVAC, electrical panel, plumbing, and water heater last replaced?
- Is there a deadline driving the sale (1031 exchange, divorce, estate, relocation)? That informs how much negotiation room exists.
- Crime grade is F in this area — have there been break-ins, vandalism, or insurance claims at this property in the last 3 years? What carrier currently insures it and at what premium?
- What's the average days-on-market for RENTAL listings here right now (not sales)? A rising rental-DOM trend means longer vacancies and softer asking-rent achievability than the comps imply.
- What's the recent tenant-quality profile in this submarket — average credit score on applications, eviction rate, late-payment / NSF rate, and stable-employment percentage? A property-management company in the area should have these aggregated.
- How much new for-sale + rental construction is in the pipeline within 1–3 miles? Heavy new supply typically softens prices + rents 12–24 months out; constrained supply supports both.
Investment metrics
- 1% rule
- 2.12% ✓
- Cap rate
- 18.71%
- Cash-on-cash
- 44.34%
- DSCR
- 2.97
- GRM
- 3.9
CMA / ARV
- ARV (median comp)
- $58,408
- List price
- $52,000
- Delta
- -10.97%
- Verdict
- UNDERPRICED
- Comps
- 20 within 1.0 mi
Show comp detail 12 sales within ~0.75 mi
| Address | Dist | Beds/Ba | Sqft | Sold | Price | $/sf | Match |
|---|---|---|---|---|---|---|---|
| 6069 Natchez Dr | 0.03mi | 3/1.0 | 900 (-4%) | 2mo | $65,000 | $72 | 91 |
| 6137 Natchez Dr | 0.09mi | 3/1.0 | 864 (-8%) | 2mo | $65,000 | $75 | 81 |
| 1297 W Kurtz Ave | 0.27mi | 3/1.0 | 852 (-9%) | 6mo | $38,000 | $45 | 68 |
| 6242 Palmetto Dr | 0.32mi | 3/1.0 | 1,056 (+13%) | 1mo | $8,000 | $8 | 63 |
| 1061 Harvard Ave | 0.72mi | 3/1.0 | 960 (+3%) | 2mo | $57,500 | $60 | 60 |
| 5428 Farmhill Rd | 0.59mi | 3/1.5 | 923 (-1%) | 9mo | $45,000 | $49 | 60 |
| 1395 W Yale Ave | 0.56mi | 3/1.0 | 1,002 (+7%) | 3mo | $8,800 | $9 | 60 |
| 5395 Stiffler Rd | 0.59mi | 3/2.0 | 912 (-3%) | 6mo | $10,000 | $11 | 59 |
| 2162 W Coldwater Rd | 0.65mi | 3/1.0 | 888 (-5%) | 9mo | $101,000 | $114 | 54 |
| 1498 W Genesee Ave | 0.73mi | 3/1.0 | 864 (-8%) | 7mo | $77,900 | $90 | 47 |
| 1148 N Cornell Ave | 0.72mi | 2/1.0 (-1) | 900 (-4%) | 10mo | $24,250 | $27 | 47 |
| 5516 Mendel Berger Dr | 0.74mi | 3/1.0 | 1,035 (+11%) | 9mo | $15,250 | $15 | 41 |
Match score weights: distance 35% · size 25% · config 20% · recency 20%. Top-matched comps best support the ARV.
Projected returns pro-forma
-3.0% appreciation · 3.0% rent growth · sell at horizon
- IRR
- 41.3%
- Equity multiple
- 2.77×
- Total profit
- $25,834
- Equity at exit
- $7,753
- IRR
- 47.5%
- Equity multiple
- 5.57×
- Total profit
- $66,610
- Equity at exit
- $4,496
Cash invested: $14,560 (down + closing). Projections, not guarantees.
Landlord ↔ Tenant lean methodology
- Overall (STATE)
- 62 Landlord-Friendly
- State Michigan
- 62 Landlord-Friendly · EVEN
- County
- — inherits STATE
- City
- — inherits STATE
ZIP-level market 48458
- Home prices YoY
- -16.0%
- Active inventory
- 144
- Price-to-rent
- 3.9×
Monthly cashflow live
- Estimated rent
- $1,100 high interval (Pro) →
- Mortgage (P&I)
- −$273
- Tax from tax record
- −$37 /mo · $441/yr
- Insurance
- −$22
- HOA
- −$0
- Vacancy / Maint / Mgmt
- −$231
- Net cashflow
- $538
Break-even live
UW: 25.0% down · 7.5% · 30yr · 1.5% tax · 5.0% vac · 8.0% maint · 8.0% mgmt
Financing live
Cash to close
- Down payment
- $13,000
- Closing costs
- $1,560
- Reserves months
- —
- Total cash needed
- —
Loan-product check · same deal, 3 products live
Conventional
25% down · 7.5% · 30yr
- Down + closing
- —
- Monthly P&I
- —
- Monthly cashflow
- —
- DSCR
- —
- Eligible?
- —
Personal DTI + credit; lowest rate.
DSCR
20% down · 8.5% · 30yr
- Down + closing
- —
- Monthly P&I
- —
- Monthly cashflow
- —
- DSCR
- —
- Eligible?
- —
No personal income docs; deal must DSCR.
Hard money
10% down · 12.0% · 12mo
- Down + closing
- —
- Monthly P&I
- —
- Monthly cashflow
- —
- DSCR
- —
- Eligible?
- —
Short-term bridge; refi at stabilization.
Rent comps 9 comps
| Address | Beds | Baths | Sqft | Rent | $/sqft | DOM | Units | Dist |
|---|---|---|---|---|---|---|---|---|
| 6113 Natchez Dr Mount Morris, MI | 3.0 | 1.0 | 1100 | $990 | $0.90 | 43d | 1 | 0.03mi |
| 6230 Natchez Dr Mount Morris, MI | 3.0 | 1.0 | 1060 | $1,000 | $0.94 | 13d | 1 | 0.25mi |
| 1 Sunny Ln Mount Morris, MI | 3.0 | 2.0 | 1100 | $1,100 | $1.00 | 43d | 1 | 0.55mi |
| 6203 Hilton Ln Mount Morris, MI | 3.0 | 1.0 | 860 | $900 | $1.05 | 43d | 1 | 0.57mi |
| 2216 Obrien Rd Mount Morris, MI | 3.0 | 2.0 | 1080 | $1,000 | $0.93 | 13d | 1 | 0.68mi |
| 7028 Rosewood Dr Mt Morris, MI | 2.0 | 1.0 | 967 | $1,020 | $1.05 | 13d | 1 | 0.86mi |
| 5280 Cedar Shores Ct Flint, MI | 2.0–3.0 | 2.0 | 1150 | $1,148 | $1.00 | 13d | 6 | 1.35mi |
| 246 E York Ave Flint, MI | 2.0 | 1.0 | 800 | $895 | $1.12 | 13d | 1 | 1.37mi |
| 514 W Alma Ave Flint, MI | 3.0 | 1.0 | 894 | $925 | $1.03 | 13d | 1 | 1.37mi |
Listing history 8 events
-
2026-06-03days on market $52,000 Active 20 DOM
-
2026-06-02days on market $52,000 Active 19 DOM
-
2026-06-01days on market $52,000 Active 18 DOM
-
2026-05-31days on market $52,000 Active 17 DOM
-
2026-05-30days on market $52,000 Active 16 DOM
-
2026-05-15$52,000 Active 848-char remark
-
2026-05-15$52,000 Active 848-char remark
-
2026-05-13historical $52,000 848-char remark
ⓘ Source: listings_history table (triggers on properties + properties_extension) + one-shot
backfill from property_details.listing_events for pre-trigger history.
Tax reassessment forecast MI · Partial reset (capped growth)
- Current annual tax
- $441 · $37/mo
- Projected year-2 tax
- $621 · $52/mo
- Expected delta
- +$180/yr (+$15/mo · 40.8%)
ⓘ Screening estimate from a state-policy table — verify with the county assessor before closing.
Climate risk First Street
- Flood 3/10 Moderate FEMA zone X (unshaded) · 10% chance over 30 yrs
- Wildfire 1/10 Low
- Heat 2/10 Low 7 d/yr ≥97°F today · 14 d/yr by 30 yrs out
- Wind 2/10 Low
- Air quality 2/10 Low 1 unhealthy d/yr today · 3 by 30 yrs out
Nearby sold comps map
Loading sold comps map…
Walkable amenities ~0.75 mi
Loading nearby amenities…
Taxation est. · year 1
- Rental income
- $13,201
- − Mortgage interest
- −$2,913
- − Property taxes
- −$441
- − Insurance
- −$260
- − Repairs & maintenance
- −$1,056
- − Management
- −$1,056
- − Depreciation
- −$1,513
- Taxable income
- $5,962
- Est. tax owed @ 24.0%
- −$1,431
- After-tax cash flow
- $5,024/yr
For passive investors: Depreciation is non-cash, so a rental often shows a tax loss while cash-flowing — sheltering income. Rental losses are passive: they offset passive income freely, and up to $25,000/yr can offset ordinary (W-2) income if you actively participate and your MAGI is under $100k (phasing out to $0 by $150k); unused losses carry forward. On sale, claimed depreciation is recaptured at up to 25%, and gains may owe capital-gains tax (a 1031 exchange can defer both). Figures are a year-1 estimate at your 24.0% rate — not tax advice; consult a CPA.
Schools (NCES district)
- District
- Beecher Community School District
- NCES district ID
- 2604500
- Math proficiency
- 7% ▲ 3.00%
- Reading proficiency
- 10% ▼ -2.00%
- Median HH income
- $27,719
- Composite
- 9.96/100
- National rank
- #14685
- State rank
- #722 of 760 in MI
Livability — Beecher
- Score
- 59/100
- State rank
- #603
- US rank
- #19782
Category grades
Schools grade is shown separately in the Schools card above.
Census & demographics
- Census place
- Beecher, MI
- County
- Genesee County · 221,329 people
- Metro
- Flint, MI
- Population (ZIP)
- 19,519
- Household income
- $46,797
- Rent vs Own
- Severe rent burden
- 724.0
Population outlook (Genesee County) Hauer SSP2
- Today (2025)
- 381,312 people
- By 2030
- 362,731 · -4.9%
- By 2040
- 321,550 · -15.7%
- By 2050
- 279,212 · -26.8%
- By 2075
- 193,336 · -49.3%
- By 2100
- 128,118 · -66.4%
Race, ethnicity, and origin ACS 2023
- Neighborhood character
- Predominantly White (66%)
- Race & ethnicity
- White 66% Black 22% Two or more races 7% Hispanic / Latino 7%
- Hispanic origin (detail)
- Mexican 5%
- Common ancestry
- Lithuanian 5% Romanian 3% Slovak 1%
- Foreign-born
- 2% · Canada
- Languages at home
- 97% English-only · Spanish 2%
Political lean MEDSL · Genesee
- 2024 margin
- Toss-up / Even · D 51.4% · R 47.2% · Other 1.4%
- 2008→2024 swing
- -28.3pp toward R · 2008: 32.5pp · 2024: 4.2pp
- All cycles
- 2024: D+4.2 2020: D+9.3 2016: D+9.5 2012: D+28.2 2008: D+32.5
Not yet ingested
- Civics
- —
Market trends
- HPI YoY
- ▼ -46.45%
- Current HPI
- 244.2061
- Rent YoY
- —
- Metro
- Flint, MI
- State GDP YoY
- ▲ 1.37%
- F500 in state
- 28
Industry mix (Fortune 500 HQ in MI)
| Industry | F500 HQs | Revenue |
|---|---|---|
| Automotive Parts | 3 | $48B |
|
||
| Automotive | 2 | $372B |
|
||
| Chemicals | 1 | $45B |
|
||
| Automotive Retail | 1 | $29B |
|
||
| Healthcare / Medical Devices | 1 | $23B |
|
||
| Automotive Technology | 1 | $20B |
|
||
Price history
+0.0% since first listed5 events — show timeline
- 2026-06-06 Listing Removed — MiRealSource-MiMLS
- 2026-06-06 Listing Removed — REALCOMP
- 2026-05-15 Listed $52,000 MiRealSource-MiMLS
- 2026-05-15 Listed $52,000 REALCOMP
- 2026-05-13 Coming Soon — MiRealSource-MiMLS
Property tax history
+0.1%/yrLatest (2025): $441 · -1.3% YoY. Source: county tax records.
Cash-flow waterfall
monthlySold comps — $/sqft
last 12 mo · ≤1 miLoading sold comps…