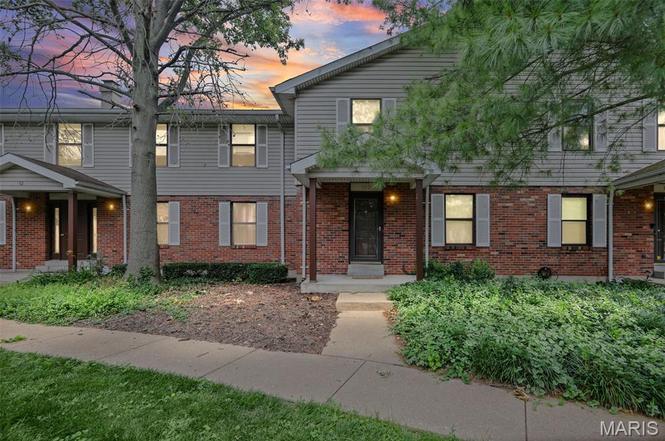
1812 Suns Up Ct · Florissant, MO
Flood risk 5/10 · Moderate
- FEMA flood zone
- X (unshaded)
- Chance of flooding over 30 yrs
- 0.24%
- Est. flood insurance / yr
- $473 – $860
Fire risk 1/10 · Minimal
- Est. fire insurance / yr
- $1,054 – $1,958
Heat risk 5/10 · Moderate
- Hot days now (above 106°F)
- 7 days/yr
- Hot days in 30 yrs
- 21 days/yr
Wind risk 2/10 · Minimal
- Chance of severe wind over 30 yrs
- 1.0%
Air-quality risk 3/10 · Minor
- Unhealthy air days now
- 3 days/yr
- Unhealthy air days in 30 yrs
- 5 days/yr
Risk factors via First Street. Map © Google.
Why this score? — see what drove the C- grade
The composite is a weighted blend of 9 inputs, each scored 0–100. Each bar is that input's sub-score; the figure is the points it added to the 100-point composite (weight × sub-score).
- Cash flow +20.8/30.0
- 1% rule +8.5/10.0
- ARV discount +7.5/15.0
- DSCR +6.6/10.0
- Livability +3.7/5.0
- Rent growth +3.6/5.0
- Condition / age +2.5/5.0
- Schools +1.7/10.0
- Appreciation +0.0/10.0
$120,000
🖨 Deal sheet 📄 Offer letter ✓ Due diligence
Listing remarks MLS
Welcome home to 1812 Suns Up Ct! This home features an open floor plan and large bedrooms. The updated kitchen with breakfast bar and separate dining features a custom backsplash and a new refrigerator that will be staying. You will love the nicely finished basement with extra living space and plenty of storage. The washer and dryer to stay as well. The back deck and level back yard are perfect for relaxing, entertaining, and cooking out. This home is completely move in ready and waiting for you to call it home! Close to schools, restaurants and shopping. Schedule your appointment today before it's gone!
Key facts
- $330 HOA
- Built 1985
Property features AI
Finance
- HOA & community: Sunset Park Condominiums HOA; Monthly HOA fee of $330 covering common area maintenance, sewer, snow removal, trash and water; No listed association amenities
Exterior
- Utilities: Ameren electric
- Home design: Residential condominium; Two stories; Facing direction not specified
- Construction: Vinyl siding
- Exterior features: Public water; Public sewer; Cable available; Electricity connected; Natural gas connected; Sewer connected; Water connected; Lot features: Other
Interior
- Bedrooms: 2 bedrooms (both on upper level)
- Bathrooms: 1 full bath; 1 half bath (main level)
- Heating & cooling: Forced air heating; Central air conditioning
- Interior features: Two-level condo; Full basement
Neighborhood map
What this means for you Summary
Snapshot
- This is a 2-bed/1.5-bath condo listed at $120k.
Deal economics
- At list price, monthly cash flow is $164 ($2k/yr) — positive.
- The deal already cash-flows at list — no discount required.
- Meets the 1% rule at list price ($2k rent vs $120k).
- Cap rate 7.9% vs local median 6.3% in Florissant — meaningfully above typical; check what's discounted (condition, days-on-market, listing class) to confirm the premium yield is real.
Location & tenants
- Location reads 73/100 on livability (#82 in MO) — a middle-class / working-renter tenant base. Strengths: cost of living A+, housing A+, health & safety B+; Watch: crime C-, amenities D+, commute F.
- Hazelwood (suburban): math 11% / reading 26% proficiency, ranked #306 of 324 in MO (top 94%) — low school quality limits family demand, transient renter base, plan for 1-2y turnover.
- Zoned schools: Lusher Elem. (math 12% / reading 22%, grade F, #967 of 1,115 statewide, top 88%, 379 students, 64% FRL); Hazelwood West High (math 16% / reading 42%, grade F, #407 of 521 statewide, top 78%, 2,042 students, 54% FRL).
- Market conditions: Rents rising fast (+4.3%/yr); 271 active listings in the ZIP; 25 comparable units currently listed for rent nearby; rentals leasing fast (median 8d on market — plan ~1-2 weeks tenant-placement turnaround); 920 units permitted in St. Louis County in 2024 (250 in 5+ unit buildings).
Forward outlook
- Local home prices are declining (-3.0%/yr); year-one equity from $830 of loan paydown is wiped out by about $4k of value loss. Plan a longer hold.
Negotiation context
- Only 1 days on market — expect competitive offers; lowballing is unlikely to land.
- 4 sale attempts since 8y ago with the ask held roughly flat each time — persistent listings suggest the price (not the market) is what's stuck; bring a comps-based counter.
Risks & watch-outs
- Watch-outs: HOA is 20% of rent.
- Climate carrying-cost: moderate flood risk; extreme-heat days projected 7→21/yr by 2055 (HVAC capex compounding) — expect insurance premiums to compound above CPI over the hold.
Questions for the listing agent
- What does the HOA fee cover, when was the last increase, and are there any pending special assessments or reserve-fund shortfalls?
- Any open or pending special assessments — roof, HVAC, plumbing, elevator, façade? What's the per-unit balance and payoff schedule, and is the seller paying it off at close or rolling it to the buyer?
- Is there a deadline driving the sale (1031 exchange, divorce, estate, relocation)? That informs how much negotiation room exists.
- Schools are D-rated, which usually means shorter tenancies and higher turnover. Who's the typical renter profile here, and what's been the actual vacancy rate?
- What's the average days-on-market for RENTAL listings here right now (not sales)? A rising rental-DOM trend means longer vacancies and softer asking-rent achievability than the comps imply.
- What's the recent tenant-quality profile in this submarket — average credit score on applications, eviction rate, late-payment / NSF rate, and stable-employment percentage? A property-management company in the area should have these aggregated.
- How much new apartment / multifamily construction is in the pipeline within 1–3 miles? Heavy new supply (>2% of stock underway) typically softens rents 12–24 months out; light construction supports rent growth.
Investment metrics
- 1% rule
- 1.35% ✓
- Cap rate
- 7.93%
- Cash-on-cash
- 5.85%
- DSCR
- 1.26
- GRM
- 6.2
CMA / ARV
No comps found within radius.
Projected returns pro-forma
-3.0% appreciation · 4.27% rent growth · sell at horizon
- IRR
- -5.3%
- Equity multiple
- 0.80×
- Total profit
- $-6,729
- Equity at exit
- $17,892
- IRR
- 6.3%
- Equity multiple
- 1.51×
- Total profit
- $17,174
- Equity at exit
- $10,375
Cash invested: $33,600 (down + closing). Projections, not guarantees.
Landlord ↔ Tenant lean methodology
- Overall (STATE)
- 81 Strongly Landlord-Friendly
- State Missouri
- 81 Strongly Landlord-Friendly · R+10
- County
- — inherits STATE
- City
- — inherits STATE
ZIP-level market 63031
- Rents YoY
- 4.3%
- Active inventory
- 271
- Price-to-rent
- 6.2×
Monthly cashflow live
- Estimated rent
- $1,615 high interval (Pro) →
- Mortgage (P&I)
- −$629
- Tax from tax record
- −$103 /mo · $1,234/yr
- Insurance
- −$50
- HOA
- −$330
- Vacancy / Maint / Mgmt
- −$339
- Net cashflow
- $164
Break-even live
UW: 25.0% down · 7.5% · 30yr · 1.5% tax · 5.0% vac · 8.0% maint · 8.0% mgmt
Financing live
Cash to close
- Down payment
- $30,000
- Closing costs
- $3,600
- Reserves months
- —
- Total cash needed
- —
Loan-product check · same deal, 3 products live
Conventional
25% down · 7.5% · 30yr
- Down + closing
- —
- Monthly P&I
- —
- Monthly cashflow
- —
- DSCR
- —
- Eligible?
- —
Personal DTI + credit; lowest rate.
DSCR
20% down · 8.5% · 30yr
- Down + closing
- —
- Monthly P&I
- —
- Monthly cashflow
- —
- DSCR
- —
- Eligible?
- —
No personal income docs; deal must DSCR.
Hard money
10% down · 12.0% · 12mo
- Down + closing
- —
- Monthly P&I
- —
- Monthly cashflow
- —
- DSCR
- —
- Eligible?
- —
Short-term bridge; refi at stabilization.
Rent comps 25 comps
| Address | Beds | Baths | Sqft | Rent | $/sqft | DOM | Units | Dist |
|---|---|---|---|---|---|---|---|---|
| 1939 Suns Up Way Florissant, MO | 2.0 | 2.5 | 1544 | $1,700 | $1.10 | 3d | 1 | 0.14mi |
| 1545 Swan Dr Florissant, MO | 3.0 | 1.0 | 1064 | $1,590 | $1.49 | 7d | 1 | 0.29mi |
| 1315 Bobolink Dr Florissant, MO | 3.0 | 2.0 | 1025 | $1,700 | $1.66 | 12d | 1 | 0.30mi |
| 2160 Splendor Dr Florissant, MO | 3.0 | 2.0 | 1100 | $1,800 | $1.64 | 3d | 1 | 0.31mi |
| 2316 Millvalley Dr Florissant, MO | 3.0 | 3.0 | 1189 | $1,696 | $1.43 | 14d | 1 | 0.44mi |
| 1395 Bluebird Dr Florissant, MO | 3.0 | 2.0 | 1168 | $1,599 | $1.37 | 16d | 1 | 0.54mi |
| 1540 Aspen Dr Florissant, MO | 3.0 | 2.0 | 912 | $1,395 | $1.53 | 7d | 1 | 0.56mi |
| 2400 Teakwood Manor Dr Florissant, MO | 3.0 | 2.0 | 1380 | $1,725 | $1.25 | 43d | 1 | 0.56mi |
| 1095 Cedar Pl Florissant, MO | 3.0 | 1.5 | 1107 | $1,710 | $1.54 | 1d | 1 | 0.61mi |
| 1095 Humes Ln Florissant, MO | 3.0 | 1.5 | 1100 | $1,650 | $1.50 | 4d | 1 | 0.68mi |
| 1145 Swallow Ln Florissant, MO | 3.0 | 2.0 | 1288 | $1,645 | $1.28 | 3d | 1 | 0.74mi |
| 9 Charlotte Dr Florissant, MO | 3.0 | 1.5 | 1404 | $1,641 | $1.17 | 4d | 1 | 0.95mi |
| 1015 Lindsay Ln Florissant, MO | 3.0 | 2.0 | 988 | $1,600 | $1.62 | 23d | 1 | 0.95mi |
| 2485 Jenkee Dr Florissant, MO | 3.0 | 1.0 | 960 | $1,376 | $1.43 | 1d | 1 | 0.96mi |
| 855 Daniel Boone Dr Florissant, MO | 3.0 | 1.0 | 964 | $1,400 | $1.45 | 43d | 1 | 1.03mi |
| 765 Babler Dr Florissant, MO | 3.0 | 2.0 | 888 | $1,700 | $1.91 | 7d | 1 | 1.12mi |
| 2857 Dawnview Dr Florissant, MO | 3.0 | 1.0 | 890 | $1,325 | $1.49 | 7d | 1 | 1.13mi |
| 3015 Matlock Dr Florissant, MO | 3.0 | 1.0 | 950 | $1,475 | $1.55 | 43d | 1 | 1.14mi |
| 775 Sherwood Dr Florissant, MO | 3.0 | 1.0 | 1023 | $1,690 | $1.65 | 43d | 1 | 1.19mi |
| 470 Hundley Dr Florissant, MO | 3.0 | 2.0 | 962 | $1,595 | $1.66 | 43d | 1 | 1.30mi |
| 4 Sharon Ct Florissant, MO | 3.0 | 2.0 | 1108 | $1,800 | $1.62 | 2d | 1 | 1.31mi |
| 2942 Chance Dr Florissant, MO | 3.0 | 1.0 | 912 | $1,700 | $1.86 | 12d | 1 | 1.33mi |
| 17 Elwood Ct Florissant, MO | 3.0 | 2.0 | 1572 | $1,945 | $1.24 | 1d | 1 | 1.35mi |
| 2280 Keeven Ln Florissant, MO | 1.0–3.0 | 1.0–1.5 | 805 | $1,065 | $1.32 | 1d | 14 | 1.38mi |
| 330 Moule Dr Florissant, MO | 3.0 | 1.0 | 1014 | $1,575 | $1.55 | 43d | 1 | 1.47mi |
HOA detail condo
- Monthly dues
- $330 · $3,960/yr
- Assessments
- None detected in remarks — confirm with the listing agent.
Listing history 2 events
-
2026-06-19remarks 378-char remark
-
2026-06-19$120,000 Active 1 DOM
ⓘ Source: listings_history table (triggers on properties + properties_extension) + one-shot
backfill from property_details.listing_events for pre-trigger history.
Tax reassessment forecast MO · Resets to sale price
- Current annual tax
- $1,234 · $103/mo
- Projected year-2 tax
- $1,234 · $103/mo
- Expected delta
- $0/yr ($0/mo · 0.0%)
ⓘ Screening estimate from a state-policy table — verify with the county assessor before closing.
Climate risk First Street
- Flood 5/10 Major FEMA zone X (unshaded) · 24% chance over 30 yrs
- Wildfire 1/10 Low
- Heat 5/10 Major 7 d/yr ≥106°F today · 21 d/yr by 30 yrs out
- Wind 2/10 Low 100% chance of damaging wind over 30 yrs
- Air quality 3/10 Moderate 3 unhealthy d/yr today · 5 by 30 yrs out
Nearby sold comps map
Loading sold comps map…
Walkable amenities ~0.75 mi
Loading nearby amenities…
Taxation est. · year 1
- Rental income
- $19,380
- − Mortgage interest
- −$6,722
- − Property taxes
- −$1,234
- − Insurance
- −$600
- − Repairs & maintenance
- −$1,550
- − Management
- −$1,550
- − HOA
- −$3,960
- − Depreciation
- −$3,491
- Taxable income
- $273
- Est. tax owed @ 24.0%
- −$65
- After-tax cash flow
- $1,899/yr
For passive investors: Depreciation is non-cash, so a rental often shows a tax loss while cash-flowing — sheltering income. Rental losses are passive: they offset passive income freely, and up to $25,000/yr can offset ordinary (W-2) income if you actively participate and your MAGI is under $100k (phasing out to $0 by $150k); unused losses carry forward. On sale, claimed depreciation is recaptured at up to 25%, and gains may owe capital-gains tax (a 1031 exchange can defer both). Figures are a year-1 estimate at your 24.0% rate — not tax advice; consult a CPA.
Schools (NCES district)
- District
- Hazelwood
- NCES district ID
- 2913830
- Math proficiency
- 11% ▼ -13.00%
- Reading proficiency
- 26% ▼ -6.00%
- Median HH income
- $51,621
- Composite
- 16.77/100
- National rank
- #9156
- State rank
- #306 of 324 in MO
Livability — Florissant
- Score
- 73/100
- State rank
- #82
- US rank
- #5406
Category grades
Schools grade is shown separately in the Schools card above.
Census & demographics
- County
- Saint Louis County · 888,823 people
- City population
- 69,104
- Metro
- St. Louis, MO-IL
- Population (ZIP)
- 50,196
- Household income
- $70,811
- Rent vs Own
- Severe rent burden
- 1279.0
Population outlook (St. Louis County) Hauer SSP2
- Today (2025)
- 1,025,227 people
- By 2030
- 1,028,023 · +0.3%
- By 2040
- 1,020,940 · -0.4%
- By 2050
- 1,007,280 · -1.8%
- By 2075
- 987,277 · -3.7%
- By 2100
- 921,984 · -10.1%
Race, ethnicity, and origin ACS 2023
- Neighborhood character
- Diverse neighborhood (Simpson 0.58)
- Race & ethnicity
- White 49% Black 41% Two or more races 7% Hispanic / Latino 2%
- Common ancestry
- Romanian 3% Lithuanian 3% Swedish 1%
- Foreign-born
- 5% · Canada, Jamaica
- Languages at home
- 94% English-only · Spanish 2% Arabic 1%
Political lean MEDSL · St. Louis
- 2024 margin
- Strong D (+23.4) · D 60.8% · R 37.4% · Other 1.7%
- 2008→2024 swing
- +3.5pp toward D · 2008: 19.9pp · 2024: 23.4pp
- All cycles
- 2024: D+23.4 2020: D+24.0 2016: D+16.2 2012: D+13.7 2008: D+19.9
Not yet ingested
- Civics
- —
Market trends
- HPI YoY
- ▼ -223.57%
- Current HPI
- 202.7192
- Rent YoY
- ▲ 4.27%
- Metro
- St. Louis, MO-IL
- State GDP YoY
- ▲ 1.84%
- F500 in state
- 20
Industry mix (Fortune 500 HQ in MO)
| Industry | F500 HQs | Revenue |
|---|---|---|
| Healthcare | 1 | $163B |
|
||
| Insurance | 1 | $21B |
|
||
| Industrial Technology | 1 | $17B |
|
||
| Retail | 1 | $16B |
|
||
| Industrial Distribution | 1 | $10B |
|
||
| Utilities | 1 | $9B |
|
||
Price history
+81.8% since first listed16 events — show timeline
- 2026-06-18 Listed $120,000 MARIS as Distributed by MLS Grid
- 2022-05-05 Sold (Public Records) $110,000 Public Records
- 2022-05-03 Pending — MARIS as Distributed by MLS Grid
- 2022-05-03 Sold (MLS) — MARIS as Distributed by MLS Grid
- 2022-04-05 Contingent — MARIS as Distributed by MLS Grid
- 2022-03-30 Listed $94,900 MARIS as Distributed by MLS Grid
- 2022-03-27 Coming Soon $94,900 MARIS as Distributed by MLS Grid
- 2018-10-28 Sold (MLS) — MARIS as Distributed by MLS Grid
- 2018-08-21 Pending — MARIS as Distributed by MLS Grid
- 2018-08-11 Relisted — MARIS as Distributed by MLS Grid
- 2018-08-03 Pending — MARIS as Distributed by MLS Grid
- 2018-04-11 Contingent — MARIS as Distributed by MLS Grid
- 2018-04-09 Listed $59,900 MARIS as Distributed by MLS Grid
- 2000-07-13 Sold (Public Records) $66,000 Public Records
- 1995-07-14 Sold (Public Records) — Public Records
- 1995-07-14 Sold (Public Records) — Public Records
Property tax history
-0.1%/yrLatest (2022): $1,234 · +1.4% YoY. Source: county tax records.
Cash-flow waterfall
monthlySold comps — $/sqft
last 12 mo · ≤1 miLoading sold comps…