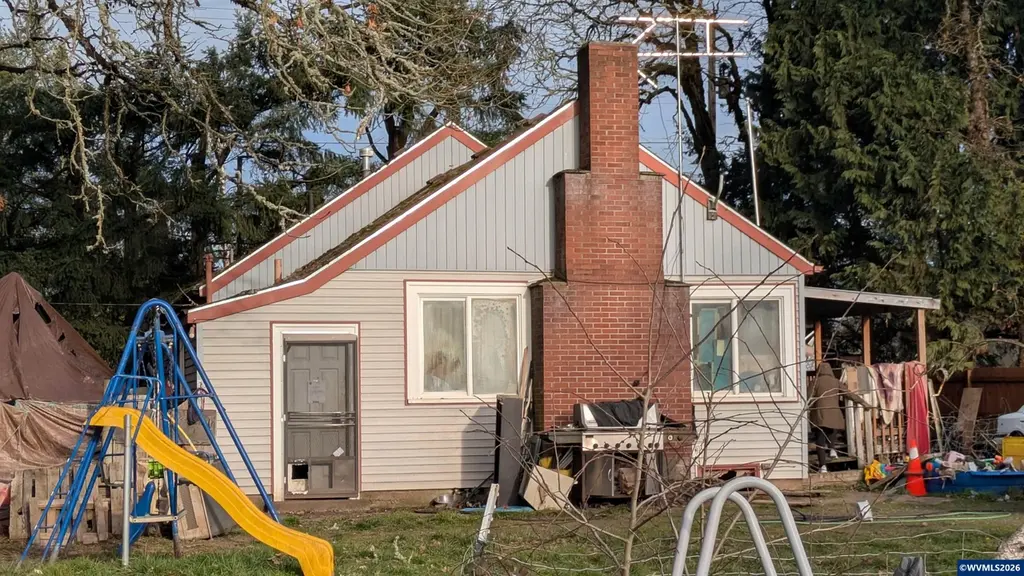
30626 Santiam Hwy · Waterloo, OR
Flood risk 1/10 · Minimal
- FEMA flood zone
- X (unshaded)
- Chance of flooding over 30 yrs
- 0.0%
- Est. flood insurance / yr
- $507 – $1,088
Fire risk 6/10 · Moderate
- Est. fire insurance / yr
- $498 – $926
Heat risk 4/10 · Minor
- Hot days now (above 91°F)
- 7 days/yr
- Hot days in 30 yrs
- 16 days/yr
Wind risk 1/10 · Minimal
- Chance of severe wind over 30 yrs
- —
Air-quality risk 10/10 · Severe
- Unhealthy air days now
- 12 days/yr
- Unhealthy air days in 30 yrs
- 15 days/yr
Risk factors via First Street. Map © Google.
Why this score? — see what drove the C grade
The composite is a weighted blend of 9 inputs, each scored 0–100. Each bar is that input's sub-score; the figure is the points it added to the 100-point composite (weight × sub-score).
- Cash flow +21.0/30.0
- ARV discount +15.0/15.0
- DSCR +6.7/10.0
- 1% rule +5.1/10.0
- Rent growth +3.6/5.0
- Livability +3.1/5.0
- Schools +3.0/10.0
- Condition / age +2.5/5.0
- Appreciation +0.0/10.0
$226,500
🖨 Deal sheet 📄 Offer letter ✓ Due diligence
Listing remarks MLS
COURT AUTHORIZED REPRESENTATIVE SALE. Big project in the country– small price. Good insurable title. Not a foreclosure or a trustee's sale. Offers must be submitted via EquityVaultAuctions.com. A 4.5% buyer’s premium applies. Cash or hard money buyers, investors, and flippers. Run the numbers and place a bid that works for you. No cost to place a bid and only the winning bidder pays the buyer premium.
Key facts
- 0.61 acre lot
- Built 1955
- Listed 37 days
Neighborhood map
What this means for you Summary
Snapshot
- This is a 3-bed/2.0-bath single-family listed at $226k.
Deal economics
- At list price, monthly cash flow is $320 ($4k/yr) — positive.
- The deal already cash-flows at list — no discount required.
- Meets the 1% rule at list price ($2k rent vs $226k).
- Recommended offer: $220k (3.0% below list) — sets the bar for market timing.
Location & tenants
- Location reads 62/100 on livability (#245 in OR) — a middle-class / working-renter tenant base. Strengths: cost of living A+, housing A+, employment A-; Watch: health & safety C-, schools F, crime F.
- Lebanon Community SD 9 (town): math 27% / reading 43% proficiency, ranked #26 of 58 in OR (top 45%) — families likely to look elsewhere, expect single-tenant / working-renter base with shorter leases.
- Market conditions: Rents rising fast (+4.5%/yr); 246 active listings in the ZIP; 311 units permitted in Linn County in 2024 (60 in 5+ unit buildings).
- This rent runs 40% of the median local income ($69k/yr) — at the standard rent-burdened threshold; future hikes will face affordability resistance.
Forward outlook
- Local home prices are declining (-3.0%/yr); year-one equity from $2k of loan paydown is wiped out by about $7k of value loss. Plan a longer hold.
- Linn County population projected at +5% by 2050 — modest demand growth; plan on rents tracking national, not racing it.
Negotiation context
- It's been on market 37 days — a 3% lower offer ($220k) is reasonable based on typical stale-listing flexibility.
- 6 sale attempts since 23y ago with the ask held roughly flat each time — persistent listings suggest the price (not the market) is what's stuck; bring a comps-based counter.
- Current owner paid $72k; list at $226k implies a 215% gain — meaningful room to come down on a strong offer.
Risks & watch-outs
- Watch-outs: built in 1955 — expect roof / HVAC / electrical / plumbing capex.
- Climate carrying-cost: major wildfire risk — expect insurance premiums to compound above CPI over the hold.
Questions for the listing agent
- It's been on market 37 days. Have you received any prior offers? Is the seller open to a 3% concession, seller financing, or rate buy-down credit?
- Built in 1955 — when were the roof, HVAC, electrical panel, plumbing, and water heater last replaced?
- Is there a deadline driving the sale (1031 exchange, divorce, estate, relocation)? That informs how much negotiation room exists.
- Schools are F-rated, which usually means shorter tenancies and higher turnover. Who's the typical renter profile here, and what's been the actual vacancy rate?
- Crime grade is F in this area — have there been break-ins, vandalism, or insurance claims at this property in the last 3 years? What carrier currently insures it and at what premium?
- What's the average days-on-market for RENTAL listings here right now (not sales)? A rising rental-DOM trend means longer vacancies and softer asking-rent achievability than the comps imply.
- What's the recent tenant-quality profile in this submarket — average credit score on applications, eviction rate, late-payment / NSF rate, and stable-employment percentage? A property-management company in the area should have these aggregated.
- How much new for-sale + rental construction is in the pipeline within 1–3 miles? Heavy new supply typically softens prices + rents 12–24 months out; constrained supply supports both.
Investment metrics
- 1% rule
- 1.01% ✓
- Cap rate
- 7.99%
- Cash-on-cash
- 6.05%
- DSCR
- 1.27
- GRM
- 8.3
CMA / ARV
- ARV (median comp)
- $416,127
- List price
- $226,500
- Delta
- -45.57%
- Verdict
- UNDERPRICED
- Comps
- 6 within 1.0 mi
Show comp detail 3 sales within ~0.75 mi
| Address | Dist | Beds/Ba | Sqft | Sold | Price | $/sf | Match |
|---|---|---|---|---|---|---|---|
| 30626 Santiam Hwy | 0.00mi | 3/1.5 | 2,128 (0%) | 1mo | $206,000 | $97 | 97 |
| 30935 Old Santiam Hwy | 0.65mi | 2/2.0 (-1) | 2,239 (+5%) | 2mo | $325,000 | $145 | 54 |
| 30563 Fairview Rd | 0.41mi | 3/2.0 | 1,868 (-12%) | 10mo | $543,000 | $291 | 52 |
Match score weights: distance 35% · size 25% · config 20% · recency 20%. Top-matched comps best support the ARV.
Projected returns pro-forma
-3.0% appreciation · 4.55% rent growth · sell at horizon
- IRR
- -5.3%
- Equity multiple
- 0.80×
- Total profit
- $-12,744
- Equity at exit
- $33,772
- IRR
- 6.0%
- Equity multiple
- 1.48×
- Total profit
- $30,346
- Equity at exit
- $19,584
Cash invested: $63,420 (down + closing). Projections, not guarantees.
Landlord ↔ Tenant lean methodology
- Overall (STATE)
- 28 Tenant-Leaning
- State Oregon
- 28 Tenant-Leaning · D+6
- County
- — inherits STATE
- City
- — inherits STATE
ZIP-level market 97355
- Rents YoY
- 4.5%
- Active inventory
- 246
- Price-to-rent
- 8.3×
Monthly cashflow live
- Estimated rent
- $2,279 medium interval (Pro) →
- Mortgage (P&I)
- −$1,188
- Tax from tax record
- −$199 /mo · $2,385/yr
- Insurance
- −$94
- HOA
- −$0
- Vacancy / Maint / Mgmt
- −$479
- Net cashflow
- $320
Break-even live
UW: 25.0% down · 7.5% · 30yr · 1.5% tax · 5.0% vac · 8.0% maint · 8.0% mgmt
Financing live
Cash to close
- Down payment
- $56,625
- Closing costs
- $6,795
- Reserves months
- —
- Total cash needed
- —
Loan-product check · same deal, 3 products live
Conventional
25% down · 7.5% · 30yr
- Down + closing
- —
- Monthly P&I
- —
- Monthly cashflow
- —
- DSCR
- —
- Eligible?
- —
Personal DTI + credit; lowest rate.
DSCR
20% down · 8.5% · 30yr
- Down + closing
- —
- Monthly P&I
- —
- Monthly cashflow
- —
- DSCR
- —
- Eligible?
- —
No personal income docs; deal must DSCR.
Hard money
10% down · 12.0% · 12mo
- Down + closing
- —
- Monthly P&I
- —
- Monthly cashflow
- —
- DSCR
- —
- Eligible?
- —
Short-term bridge; refi at stabilization.
Listing history 18 events
-
2026-05-08status Pending 422-char remark
Show marketing remark (422 chars)
COURT AUTHORIZED REPRESENTATIVE SALE. Big project in the country– small price. Good insurable title. Not a foreclosure or a trustee's sale. Offers must be submitted via EquityVaultAuctions.com. A 4.5% buyer’s premium applies. Cash or hard money buyers, investors, and flippers. Run the numbers and place a bid that works for you. No cost to place a bid and only the winning bidder pays the buyer premium.
-
2026-04-01$226,500 Active 422-char remark
Show marketing remark (422 chars)
COURT AUTHORIZED REPRESENTATIVE SALE. Big project in the country– small price. Good insurable title. Not a foreclosure or a trustee's sale. Offers must be submitted via EquityVaultAuctions.com. A 4.5% buyer’s premium applies. Cash or hard money buyers, investors, and flippers. Run the numbers and place a bid that works for you. No cost to place a bid and only the winning bidder pays the buyer premium.
-
2013-04-03historical
-
2013-03-26soldstatus $72,000 Sold
-
2013-03-05status Pending
-
2013-01-17$89,900 Active
-
2013-01-03historical
-
2012-11-06price $100,000
-
2012-07-28price $114,200
-
2012-06-29status Active
-
2012-06-29historical
-
2012-06-22$119,900 Active
-
2004-11-17soldstatus $105,000
-
2004-11-17soldstatus $105,000
-
2004-11-11soldstatus $105,000
-
2004-09-22$99,900
-
2004-09-02historical
-
2003-06-03$124,900
ⓘ Source: listings_history table (triggers on properties + properties_extension) + one-shot
backfill from property_details.listing_events for pre-trigger history.
Tax reassessment forecast OR · Resets to sale price
- Current annual tax
- $2,385 · $199/mo
- Projected year-2 tax
- $2,385 · $199/mo
- Expected delta
- $0/yr ($0/mo · 0.0%)
ⓘ Screening estimate from a state-policy table — verify with the county assessor before closing.
Climate risk First Street
- Flood 1/10 Low FEMA zone X (unshaded) · 0% chance over 30 yrs
- Wildfire 6/10 Major
- Heat 4/10 Moderate 7 d/yr ≥91°F today · 16 d/yr by 30 yrs out
- Wind 1/10 Low
- Air quality 10/10 Extreme 12 unhealthy d/yr today · 15 by 30 yrs out
Nearby sold comps map
Loading sold comps map…
Walkable amenities ~0.75 mi
Loading nearby amenities…
Taxation est. · year 1
- Rental income
- $27,352
- − Mortgage interest
- −$12,688
- − Property taxes
- −$2,385
- − Insurance
- −$1,132
- − Repairs & maintenance
- −$2,188
- − Management
- −$2,188
- − Depreciation
- −$6,589
- Taxable income
- $182
- Est. tax owed @ 24.0%
- −$44
- After-tax cash flow
- $3,794/yr
For passive investors: Depreciation is non-cash, so a rental often shows a tax loss while cash-flowing — sheltering income. Rental losses are passive: they offset passive income freely, and up to $25,000/yr can offset ordinary (W-2) income if you actively participate and your MAGI is under $100k (phasing out to $0 by $150k); unused losses carry forward. On sale, claimed depreciation is recaptured at up to 25%, and gains may owe capital-gains tax (a 1031 exchange can defer both). Figures are a year-1 estimate at your 24.0% rate — not tax advice; consult a CPA.
Schools (NCES district)
- District
- Lebanon Community SD 9
- NCES district ID
- 4107380
- Math proficiency
- 27% ▼ -10.00%
- Reading proficiency
- 43% ▼ -4.00%
- Median HH income
- $45,264
- Composite
- 29.83/100
- National rank
- #6418
- State rank
- #26 of 58 in OR
Livability — Waterloo
- Score
- 62/100
- State rank
- #245
- US rank
- #16998
Category grades
Schools grade is shown separately in the Schools card above.
Census & demographics
- County
- Linn County · 70,700 people
- Metro
- Albany-Lebanon, OR
- Population (ZIP)
- 34,292
- Household income
- $68,595
- Rent vs Own
- Severe rent burden
- 1051.0
Population outlook (Linn County) Hauer SSP2
- Today (2025)
- 127,026 people
- By 2030
- 129,540 · +2.0%
- By 2040
- 132,780 · +4.5%
- By 2050
- 133,614 · +5.2%
- By 2075
- 129,061 · +1.6%
- By 2100
- 112,224 · -11.7%
Race, ethnicity, and origin ACS 2023
- Neighborhood character
- Predominantly White (87%)
- Race & ethnicity
- White 87% Hispanic / Latino 7% Two or more races 7%
- Hispanic origin (detail)
- Mexican 6%
- Common ancestry
- Italian 5% Slovak 3% Portuguese 3%
- Foreign-born
- 4% · Canada
- Languages at home
- 93% English-only · Spanish 5% French/Haitian/Cajun 1%
Political lean MEDSL · Linn
- 2024 margin
- Strong R (+24.4) · D 36.2% · R 60.6% · Other 3.1%
- 2008→2024 swing
- -13.0pp toward R · 2008: -11.4pp · 2024: -24.4pp
- All cycles
- 2024: R+24.4 2020: R+23.4 2016: R+27.8 2012: R+17.2 2008: R+11.4
Not yet ingested
- Civics
- —
Market trends
- HPI YoY
- ▼ -528.42%
- Current HPI
- 221.8977
- Rent YoY
- ▲ 4.55%
- Metro
- Albany-Lebanon, OR
- State GDP YoY
- ▲ 2.05%
- F500 in state
- 2
Industry mix (Fortune 500 HQ in OR)
| Industry | F500 HQs | Revenue |
|---|---|---|
| Consumer Goods | 1 | $51B |
|
||
Price history
+81.3% since first listed18 events — show timeline
- 2026-05-08 Pending — WVMLS
- 2026-04-01 Listed $226,500 WVMLS
- 2013-04-03 Listing Removed — WVMLS
- 2013-03-26 Sold (MLS) $72,000 WVMLS
- 2013-03-05 Pending — WVMLS
- 2013-01-17 Listed $89,900 WVMLS
- 2013-01-03 Listing Removed — WVMLS
- 2012-11-06 Price Changed $100,000 WVMLS
- 2012-07-28 Price Changed $114,200 WVMLS
- 2012-06-29 Relisted — WVMLS
- 2012-06-29 Listing Removed — WVMLS
- 2012-06-22 Listed $119,900 WVMLS
- 2004-11-17 Sold (Public Records) $105,000 Public Records
- 2004-11-17 Sold (Public Records) $105,000 Public Records
- 2004-11-11 Sold (MLS) $105,000 WVMLS
- 2004-09-22 Listed $99,900 WVMLS
- 2004-09-02 Listing Removed — WVMLS
- 2003-06-03 Listed $124,900 WVMLS
Property tax history
+2.4%/yrLatest (2025): $2,385 · +2.7% YoY. Source: county tax records.
Cash-flow waterfall
monthlySold comps — $/sqft
last 12 mo · ≤1 miLoading sold comps…