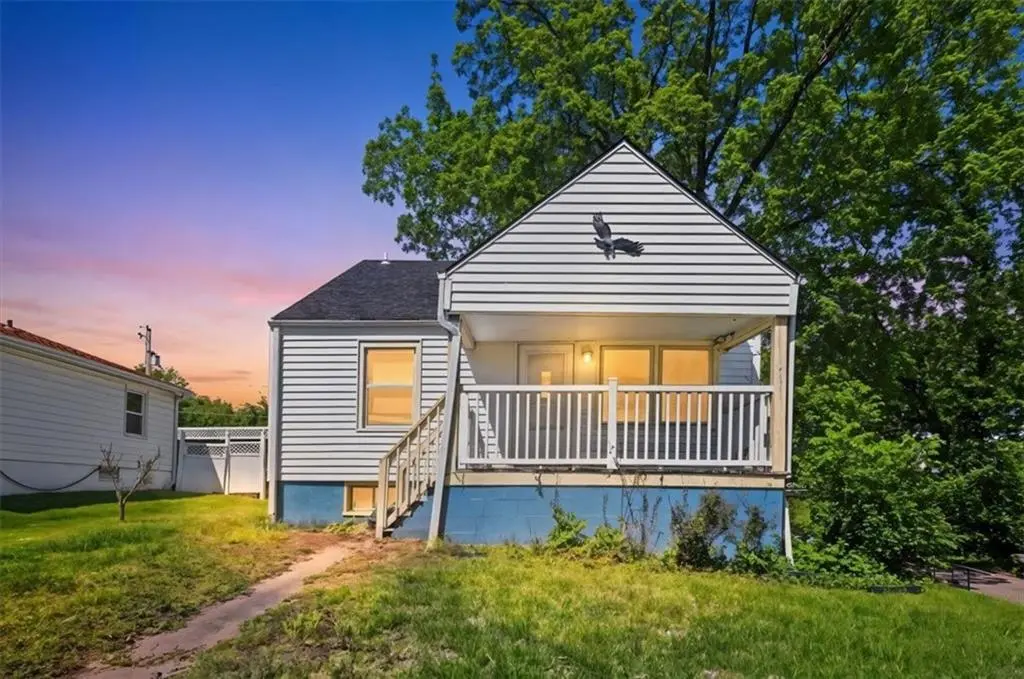
3622 N Garfield Ave · Kansas City, MO
Flood risk 1/10 · Minimal
- FEMA flood zone
- X (unshaded)
- Chance of flooding over 30 yrs
- 0.0%
- Est. flood insurance / yr
- $473 – $860
Fire risk 1/10 · Minimal
- Est. fire insurance / yr
- $1,054 – $1,958
Heat risk 4/10 · Minor
- Hot days now (above 108°F)
- 7 days/yr
- Hot days in 30 yrs
- 17 days/yr
Wind risk 2/10 · Minimal
- Chance of severe wind over 30 yrs
- —
Air-quality risk 3/10 · Minor
- Unhealthy air days now
- 2 days/yr
- Unhealthy air days in 30 yrs
- 3 days/yr
Risk factors via First Street. Map © Google.
Why this score? — see what drove the B grade
The composite is a weighted blend of 9 inputs, each scored 0–100. Each bar is that input's sub-score; the figure is the points it added to the 100-point composite (weight × sub-score).
- Cash flow +30.0/30.0
- DSCR +10.0/10.0
- 1% rule +8.7/10.0
- ARV discount +7.5/15.0
- Livability +3.9/5.0
- Schools +3.8/10.0
- Rent growth +3.7/5.0
- Condition / age +2.5/5.0
- Appreciation +0.0/10.0
$150,000
🖨 Deal sheet 📄 Offer letter ✓ Due diligence
Listing remarks MLS
Great Corner lot in Kansas City North, conveniently located to North Kansas City Health/North Kansas City Hospital and the Cities of NKC and Gladstone MO. Seller is selling in its present condition. All information is deemed reliable but not guaranteed. Buyers and their agents are responsible for verifying room sizes, square footage, HOA details, taxes, lot size and boundaries, and school boundaries.
Key facts
- Garage
- Listed 3 days
Neighborhood map
What this means for you Summary
Snapshot
- This is a 3-bed/1.0-bath single-family listed at $150k.
Deal economics
- At list price, monthly cash flow is $598 ($7k/yr) — positive.
- The deal already cash-flows at list — no discount required.
- Meets the 1% rule at list price ($2k rent vs $150k).
- Cap rate 11.1% vs local median 3.9% in Kansas City — top-decile yield for the area; either an underpriced asset or a hidden risk that comps aren't pricing in. Stress-test before assuming the spread holds.
Location & tenants
- Location reads 78/100 on livability (#28 in MO, #2,671 nationally) — a middle-class / working-renter tenant base. Strengths: amenities A+, commute A+, cost of living A+; Watch: schools C-, crime F.
- North Kansas City 74 (urban): math 38% / reading 49% proficiency, ranked #98 of 324 in MO (top 30%) — families likely to look elsewhere, expect single-tenant / working-renter base with shorter leases.
- Market conditions: Rents rising fast (+4.7%/yr); 88 active listings in the ZIP; 12 comparable units currently listed for rent nearby; rentals leasing fast (median 3d on market — plan ~1-2 weeks tenant-placement turnaround); 341 units permitted in Clay County in 2024 (40 in 5+ unit buildings).
- This rent runs 39% of the median local income ($64k/yr) — at the standard rent-burdened threshold; future hikes will face affordability resistance.
Forward outlook
- Local home prices are declining (-3.0%/yr); year-one equity from $1k of loan paydown is wiped out by about $4k of value loss. Plan a longer hold.
- Clay County population projected at +24% by 2050 — long-run rental-demand tailwind backs the buy-and-hold thesis.
- At projected returns (-3.0% appreciation + 4.7% rent growth), your $42k cash investment doubles in ~7 years — after that, you're playing with house money.
Negotiation context
- Only 3 days on market — expect competitive offers; lowballing is unlikely to land.
- 4 sale attempts since 21y ago with the ask held roughly flat each time — persistent listings suggest the price (not the market) is what's stuck; bring a comps-based counter.
Risks & watch-outs
- Watch-outs: built in 1948 — expect roof / HVAC / electrical / plumbing capex.
Questions for the listing agent
- Built in 1948 — when were the roof, HVAC, electrical panel, plumbing, and water heater last replaced?
- Is there a deadline driving the sale (1031 exchange, divorce, estate, relocation)? That informs how much negotiation room exists.
- Crime grade is F in this area — have there been break-ins, vandalism, or insurance claims at this property in the last 3 years? What carrier currently insures it and at what premium?
- What's the average days-on-market for RENTAL listings here right now (not sales)? A rising rental-DOM trend means longer vacancies and softer asking-rent achievability than the comps imply.
- What's the recent tenant-quality profile in this submarket — average credit score on applications, eviction rate, late-payment / NSF rate, and stable-employment percentage? A property-management company in the area should have these aggregated.
- How much new for-sale + rental construction is in the pipeline within 1–3 miles? Heavy new supply typically softens prices + rents 12–24 months out; constrained supply supports both.
Investment metrics
- 1% rule
- 1.37% ✓
- Cap rate
- 11.07%
- Cash-on-cash
- 17.08%
- DSCR
- 1.76
- GRM
- 6.1
CMA / ARV
- ARV (median comp)
- $301,468
- List price
- $150,000
- Delta
- -50.24%
- Verdict
- UNDERPRICED
- Comps
- 20 within 1.0 mi
Show comp detail 12 sales within ~0.75 mi
| Address | Dist | Beds/Ba | Sqft | Sold | Price | $/sf | Match |
|---|---|---|---|---|---|---|---|
| 3542 NE Rock Creek Dr | 0.10mi | 3/2.5 | 1,676 (+6%) | 5mo | $305,000 | $182 | 75 |
| 3628 N Flora Ave | 0.35mi | 4/2.0 (+1) | 1,552 (-2%) | 2mo | $175,000 | $113 | 70 |
| 3632 N Olive St | 0.17mi | 3/3.0 | 1,731 (+10%) | 1mo | $299,500 | $173 | 66 |
| 3800 Prather Rd | 0.24mi | 3/2.0 | 1,772 (+12%) | 1mo | $250,000 | $141 | 63 |
| 3801 NE Antioch Rd | 0.53mi | 3/1.5 | 1,664 (+6%) | 1mo | $205,000 | $123 | 63 |
| 2425 NE 38th St | 0.33mi | 3/1.5 | 1,372 (-13%) | 0mo | $289,000 | $211 | 61 |
| 1911 E 28th Ave | 0.75mi | 3/2.0 | 1,584 (+1%) | 2mo | $275,000 | $174 | 58 |
| 3715 N Euclid Ave | 0.11mi | 2/2.0 (-1) | 1,344 (-15%) | 4mo | $225,000 | $167 | 58 |
| 2920 NE 39th St | 0.67mi | 2/1.0 (-1) | 1,668 (+6%) | 3mo | $75,000 | $45 | 52 |
| 3537 N Walrond Ave | 0.71mi | 3/1.5 | 1,698 (+8%) | 0mo | $250,000 | $147 | 52 |
| 2808 NE 39th St | 0.59mi | 3/2.5 | 1,418 (-10%) | 0mo | $235,000 | $166 | 49 |
| 3523 N Bellefontaine Ave | 0.65mi | 2/1.0 (-1) | 1,705 (+8%) | 5mo | $274,900 | $161 | 47 |
Match score weights: distance 35% · size 25% · config 20% · recency 20%. Top-matched comps best support the ARV.
Projected returns pro-forma
-3.0% appreciation · 4.74% rent growth · sell at horizon
- IRR
- 10.3%
- Equity multiple
- 1.42×
- Total profit
- $17,457
- Equity at exit
- $22,365
- IRR
- 20.8%
- Equity multiple
- 2.90×
- Total profit
- $79,928
- Equity at exit
- $12,969
Cash invested: $42,000 (down + closing). Projections, not guarantees.
Landlord ↔ Tenant lean methodology
- Overall (STATE)
- 81 Strongly Landlord-Friendly
- State Missouri
- 81 Strongly Landlord-Friendly · R+10
- County
- — inherits STATE
- City
- — inherits STATE
ZIP-level market 64116
- Rents YoY
- 4.7%
- Active inventory
- 88
- Price-to-rent
- 6.1×
Monthly cashflow live
- Estimated rent
- $2,060 high interval (Pro) →
- Mortgage (P&I)
- −$787
- Tax from tax record
- −$181 /mo · $2,166/yr
- Insurance
- −$62
- HOA
- −$0
- Vacancy / Maint / Mgmt
- −$433
- Net cashflow
- $598
Break-even live
UW: 25.0% down · 7.5% · 30yr · 1.5% tax · 5.0% vac · 8.0% maint · 8.0% mgmt
Financing live
Cash to close
- Down payment
- $37,500
- Closing costs
- $4,500
- Reserves months
- —
- Total cash needed
- —
Loan-product check · same deal, 3 products live
Conventional
25% down · 7.5% · 30yr
- Down + closing
- —
- Monthly P&I
- —
- Monthly cashflow
- —
- DSCR
- —
- Eligible?
- —
Personal DTI + credit; lowest rate.
DSCR
20% down · 8.5% · 30yr
- Down + closing
- —
- Monthly P&I
- —
- Monthly cashflow
- —
- DSCR
- —
- Eligible?
- —
No personal income docs; deal must DSCR.
Hard money
10% down · 12.0% · 12mo
- Down + closing
- —
- Monthly P&I
- —
- Monthly cashflow
- —
- DSCR
- —
- Eligible?
- —
Short-term bridge; refi at stabilization.
Rent comps 12 comps
| Address | Beds | Baths | Sqft | Rent | $/sqft | DOM | Units | Dist |
|---|---|---|---|---|---|---|---|---|
| 1321a NE 39th St Unit 1304B Kansas City, MO | 2.0 | 2.5 | 1200 | $1,509 | $1.26 | 44d | 1 | 0.57mi |
| 1321a NE 39th St Unit 1309A Kansas City, MO | 2.0 | 2.0 | 1500 | $1,699 | $1.13 | 15d | 1 | 0.57mi |
| 1321a NE 39th St Kansas City, MO | 3.0 | 2.0 | 1800 | $1,965 | $1.09 | 7d | 1 | 0.57mi |
| 1300 NE Parvin Rd Kansas City, MO | 1.0–2.0 | 1.0–2.0 | 881 | $1,530 | $1.74 | 2d | 15 | 0.88mi |
| 3350 N Holmes St Kansas City, MO | 2.0 | 1.0–2.5 | 975 | $3,329 | $3.41 | 2d | 91 | 0.91mi |
| 1619 Orleans Cir North Kansas City, MO | 3.0 | 1.0–2.5 | 1119 | $1,505 | $1.34 | 44d | 1 | 0.92mi |
| 2913 N Oak Trfy North Kansas City, MO | 3.0 | 2.5 | 1976 | $3,695 | $1.87 | 2d | 1 | 1.22mi |
| 1801 Diamond Pkwy North Kansas City, MO | 3.0 | 1.0–2.0 | 926 | $2,244 | $2.42 | 2d | 27 | 1.42mi |
| 2935 N Oak Trfy Bldg B (R23) North Kansas City, MO | 3.0 | 2.5 | 1976 | $3,695 | $1.87 | 24d | 1 | 1.43mi |
| 531 NE 45th St Kansas City, MO | 3.0 | 2.0 | 1886 | $1,700 | $0.90 | 3d | 1 | 1.45mi |
| 2600 Cityview Dr Kansas City, MO | 2.0 | 1.0–2.0 | 955 | $1,840 | $1.93 | 2d | 23 | 1.47mi |
| 1770 Diamond Pkwy Kansas City, MO | 2.0 | 1.0–2.0 | 921 | $1,763 | $1.91 | 2d | 28 | 1.49mi |
Listing history 13 events
-
2026-05-08status Pending 403-char remark
Show marketing remark (403 chars)
Great Corner lot in Kansas City North, conveniently located to North Kansas City Health/North Kansas City Hospital and the Cities of NKC and Gladstone MO. Seller is selling in its present condition. All information is deemed reliable but not guaranteed. Buyers and their agents are responsible for verifying room sizes, square footage, HOA details, taxes, lot size and boundaries, and school boundaries.
-
2026-05-06$150,000 Active 403-char remark
Show marketing remark (403 chars)
Great Corner lot in Kansas City North, conveniently located to North Kansas City Health/North Kansas City Hospital and the Cities of NKC and Gladstone MO. Seller is selling in its present condition. All information is deemed reliable but not guaranteed. Buyers and their agents are responsible for verifying room sizes, square footage, HOA details, taxes, lot size and boundaries, and school boundaries.
-
2026-04-08historical $150,000 403-char remark
Show marketing remark (403 chars)
Great Corner lot in Kansas City North, conveniently located to North Kansas City Health/North Kansas City Hospital and the Cities of NKC and Gladstone MO. Seller is selling in its present condition. All information is deemed reliable but not guaranteed. Buyers and their agents are responsible for verifying room sizes, square footage, HOA details, taxes, lot size and boundaries, and school boundaries.
-
2017-01-23soldstatus
-
2017-01-20soldstatus Sold 520-char remark
Show marketing remark (520 chars)
BEAUTIFUL! Redone from top to bottom. Gleaming wood floors. New plumbing fixtures, new lighting fixture, finished basement, totally redone kitchen and bathrooms, fresh interior paint, new high efficiency heating and new cooling system, new hot water heater, wonderful room sizes. Could be 4th bedroom in basement. Detached garage and greenhouse come with property. The open floor plain, neutral colors, and great sunlight in this mid century home make it a spectacular find and a pleasure to show! (Updating almost done)
-
2016-12-27status Pending 520-char remark
Show marketing remark (520 chars)
BEAUTIFUL! Redone from top to bottom. Gleaming wood floors. New plumbing fixtures, new lighting fixture, finished basement, totally redone kitchen and bathrooms, fresh interior paint, new high efficiency heating and new cooling system, new hot water heater, wonderful room sizes. Could be 4th bedroom in basement. Detached garage and greenhouse come with property. The open floor plain, neutral colors, and great sunlight in this mid century home make it a spectacular find and a pleasure to show! (Updating almost done)
-
2016-11-11price $124,900 520-char remark
Show marketing remark (520 chars)
BEAUTIFUL! Redone from top to bottom. Gleaming wood floors. New plumbing fixtures, new lighting fixture, finished basement, totally redone kitchen and bathrooms, fresh interior paint, new high efficiency heating and new cooling system, new hot water heater, wonderful room sizes. Could be 4th bedroom in basement. Detached garage and greenhouse come with property. The open floor plain, neutral colors, and great sunlight in this mid century home make it a spectacular find and a pleasure to show! (Updating almost done)
-
2016-10-10$129,900 Active 520-char remark
Show marketing remark (520 chars)
BEAUTIFUL! Redone from top to bottom. Gleaming wood floors. New plumbing fixtures, new lighting fixture, finished basement, totally redone kitchen and bathrooms, fresh interior paint, new high efficiency heating and new cooling system, new hot water heater, wonderful room sizes. Could be 4th bedroom in basement. Detached garage and greenhouse come with property. The open floor plain, neutral colors, and great sunlight in this mid century home make it a spectacular find and a pleasure to show! (Updating almost done)
-
2013-08-13soldstatus
-
2013-06-25$44,000
-
2006-03-03soldstatus
-
2006-03-01soldstatus
-
2005-11-02$100,000
ⓘ Source: listings_history table (triggers on properties + properties_extension) + one-shot
backfill from property_details.listing_events for pre-trigger history.
Tax reassessment forecast MO · Resets to sale price
- Current annual tax
- $2,166 · $181/mo
- Projected year-2 tax
- $2,166 · $181/mo
- Expected delta
- $0/yr ($0/mo · 0.0%)
ⓘ Screening estimate from a state-policy table — verify with the county assessor before closing.
Climate risk First Street
- Flood 1/10 Low FEMA zone X (unshaded) · 0% chance over 30 yrs
- Wildfire 1/10 Low
- Heat 4/10 Moderate 7 d/yr ≥108°F today · 17 d/yr by 30 yrs out
- Wind 2/10 Low
- Air quality 3/10 Moderate 2 unhealthy d/yr today · 3 by 30 yrs out
Nearby sold comps map
Loading sold comps map…
Walkable amenities ~0.75 mi
Loading nearby amenities…
Taxation est. · year 1
- Rental income
- $24,719
- − Mortgage interest
- −$8,402
- − Property taxes
- −$2,166
- − Insurance
- −$750
- − Repairs & maintenance
- −$1,978
- − Management
- −$1,978
- − Depreciation
- −$4,364
- Taxable income
- $5,082
- Est. tax owed @ 24.0%
- −$1,220
- After-tax cash flow
- $5,953/yr
For passive investors: Depreciation is non-cash, so a rental often shows a tax loss while cash-flowing — sheltering income. Rental losses are passive: they offset passive income freely, and up to $25,000/yr can offset ordinary (W-2) income if you actively participate and your MAGI is under $100k (phasing out to $0 by $150k); unused losses carry forward. On sale, claimed depreciation is recaptured at up to 25%, and gains may owe capital-gains tax (a 1031 exchange can defer both). Figures are a year-1 estimate at your 24.0% rate — not tax advice; consult a CPA.
Schools (NCES district)
- District
- North Kansas City 74
- NCES district ID
- 2922800
- Math proficiency
- 38% ▼ -11.00%
- Reading proficiency
- 49% ▼ -3.00%
- Median HH income
- $55,444
- Composite
- 37.88/100
- National rank
- #4321
- State rank
- #98 of 324 in MO
Livability — Kansas City
- Score
- 78/100
- State rank
- #28
- US rank
- #2671
Category grades
Schools grade is shown separately in the Schools card above.
Census & demographics
- Census place
- Kansas City, MO
- County
- Clay County · 220,651 people
- City population
- 439,467
- Metro
- Kansas City, MO-KS
- Population (ZIP)
- 18,046
- Household income
- $64,123
- Rent vs Own
- Severe rent burden
- 844.0
Population outlook (Clay County) Hauer SSP2
- Today (2025)
- 266,022 people
- By 2030
- 280,057 · +5.3%
- By 2040
- 306,153 · +15.1%
- By 2050
- 328,630 · +23.5%
- By 2075
- 375,182 · +41.0%
- By 2100
- 392,861 · +47.7%
Race, ethnicity, and origin ACS 2023
- Neighborhood character
- Diverse neighborhood (Simpson 0.57)
- Race & ethnicity
- White 63% Two or more races 15% Black 12% Hispanic / Latino 10% Asian 3%
- Hispanic origin (detail)
- Mexican 5% Puerto Rican 2%
- Common ancestry
- Italian 3% Serbian 2% Lithuanian 2%
- Foreign-born
- 8% · Canada, Vietnam, Jamaica
- Languages at home
- 91% English-only · Arabic 2% Spanish 2% Vietnamese 2%
Political lean MEDSL · Clay
- 2024 margin
- Lean R (+5.6) · D 46.4% · R 52.0% · Other 1.6%
- 2008→2024 swing
- -4.9pp toward R · 2008: -0.7pp · 2024: -5.6pp
- All cycles
- 2024: R+5.6 2020: R+4.1 2016: R+11.1 2012: R+8.4 2008: R+0.7
Not yet ingested
- Civics
- —
Market trends
- HPI YoY
- ▼ -180.14%
- Current HPI
- 256.6222
- Rent YoY
- ▲ 4.74%
- Metro
- Kansas City, MO-KS
- State GDP YoY
- ▲ 1.84%
- F500 in state
- 20
Industry mix (Fortune 500 HQ in MO)
| Industry | F500 HQs | Revenue |
|---|---|---|
| Healthcare | 1 | $163B |
|
||
| Insurance | 1 | $21B |
|
||
| Industrial Technology | 1 | $17B |
|
||
| Retail | 1 | $16B |
|
||
| Industrial Distribution | 1 | $10B |
|
||
| Utilities | 1 | $9B |
|
||
Price history
+50.0% since first listed13 events — show timeline
- 2026-05-08 Pending — Heartland MLS as Distributed by MLS Grid
- 2026-05-06 Listed $150,000 Heartland MLS as Distributed by MLS Grid
- 2026-04-08 Coming Soon $150,000 Heartland MLS as Distributed by MLS Grid
- 2017-01-23 Sold (Public Records) — Public Records
- 2017-01-20 Sold (MLS) — Heartland MLS as Distributed by MLS Grid
- 2016-12-27 Pending — Heartland MLS as Distributed by MLS Grid
- 2016-11-11 Price Changed $124,900 Heartland MLS as Distributed by MLS Grid
- 2016-10-10 Listed $129,900 Heartland MLS as Distributed by MLS Grid
- 2013-08-13 Sold (MLS) — Heartland MLS as Distributed by MLS Grid
- 2013-06-25 Listed $44,000 Heartland MLS as Distributed by MLS Grid
- 2006-03-03 Sold (MLS) — Heartland MLS as Distributed by MLS Grid
- 2006-03-01 Sold (Public Records) — Public Records
- 2005-11-02 Listed $100,000 Heartland MLS as Distributed by MLS Grid
Property tax history
+1.9%/yrLatest (2025): $2,166 · +12.1% YoY. Source: county tax records.
Cash-flow waterfall
monthlySold comps — $/sqft
last 12 mo · ≤1 miLoading sold comps…