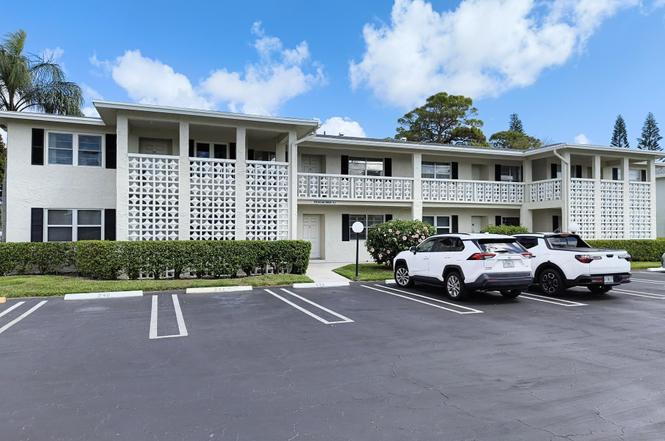
1020 Silk Oak Ter #102 · Delray Beach, FL
Flood risk 1/10 · Minimal
- FEMA flood zone
- X (unshaded)
- Chance of flooding over 30 yrs
- 0.0%
- Est. flood insurance / yr
- $507 – $1,088
Fire risk 1/10 · Minimal
- Est. fire insurance / yr
- $947 – $1,759
Heat risk 10/10 · Severe
- Hot days now (above 105°F)
- 7 days/yr
- Hot days in 30 yrs
- 28 days/yr
Wind risk 10/10 · Severe
- Chance of severe wind over 30 yrs
- 99.0%
Air-quality risk 3/10 · Minor
- Unhealthy air days now
- 2 days/yr
- Unhealthy air days in 30 yrs
- 3 days/yr
Risk factors via First Street. Map © Google.
Why this score? — see what drove the C grade
The composite is a weighted blend of 9 inputs, each scored 0–100. Each bar is that input's sub-score; the figure is the points it added to the 100-point composite (weight × sub-score).
- Cash flow +21.7/30.0
- 1% rule +9.9/10.0
- ARV discount +7.5/15.0
- DSCR +6.9/10.0
- Schools +4.3/10.0
- Livability +3.9/5.0
- Rent growth +3.0/5.0
- Condition / age +2.5/5.0
- Appreciation +0.0/10.0
$149,000
🖨 Deal sheet (PDF) 📄 Offer letter ✓ Due diligence
Listing remarks
The Pines of Delray is an active Clubhouse Community that has Newer Roofs! The apartment features 2 full Baths Redone in Tasteful Tones (Master in HGTV style) See Photos! . .. Enjoy an easy access 1st floor unit with the following updates: Refrigerator, Bosch Dishwasher, Microwave, Plantation Shutters (now repaired) and Crown Moldings. .. . Your Parking Space is at your Front Door and many Additional Guest Spots for a second car! . .. A short walk to the 2nd community pool. .. . The Club House features: A very large Heated Swimming Pool, Stage, Dance floor, Meeting room, Pool Table/Billiards, An Exercise Room, Tennis & Pickleball Courts, 4 Shuffleboard Courts Etc. .. . The Condo Fee
Key facts
- 1st floor
- Close to 2nd pool
- Exercise room
Tags
Property features AI
Finance
- Other: Pets allowed (cats OK; number limit applies); Community contains approximately 500 units
- Financial info: Not a land lease community; Senior community
- HOA & community: Association: SEACREST SERVICES; Monthly HOA fee (approx.): $623; HOA fee includes cable TV, insurance, internet, water, sewer, trash, maintenance (grounds & structure), roof repairs, pool service, recreation facilities, common areas, legal/accounting, reserve funds; Community amenities: clubhouse, fitness center, pool (heated), billiard room, game room, community room, recreation facilities, shuffleboard, pickleball courts, management/manager on site, parking, internet included, maintained community
Exterior
- Parking: 16 total parking spaces; 8 open parking spaces; Asphalt surface; Assigned and guest parking; some open parking; See remarks for additional parking details
- Security: Smoke detector(s)
- Utilities: Public water; Public sewer; Cable connected; Electricity available; Phone available; Sewer connected; Water connected; Underground utilities; Natural gas not available; Other utilities available
- Home design: Condominium; One level; Entry level: 1; Faces west; Accessible common areas and entrance; Smoke detectors
- Construction: Built with CBS (concrete block) and stucco; Composition/shingle roof; Slab foundation; Approximately 2-story building (unit in a 2-story building)
- Exterior features: Open patio; Patio
Interior
- Kitchen: Dishwasher; Electric range; Microwave; Refrigerator; Disposal; Electric water heater
- Bedrooms: 2 bedrooms on the main level
- Flooring: Carpet; Ceramic tile; Laminate; Tile
- Bathrooms: 2 full bathrooms (main level)
- Heating & cooling: Central electric heating; Central air conditioning; Ceiling fans; Paddle fans
- Interior features: Entrance foyer; Walk-in closet(s); Split bedroom layout
- Laundry & utility: Washer hookup in unit; Washer hookup in kitchen; Inside laundry with electric dryer hookup
Neighborhood map
What this means for you Summary
Snapshot
- This is a 2-bed/2.0-bath condo listed at $149k.
Deal economics
- At list price, monthly cash flow is $229 ($3k/yr) — positive.
- The deal already cash-flows at list — no discount required.
- Meets the 1% rule at list price ($2k rent vs $149k).
- Recommended offer: $136k (9.0% below list) — sets the bar for market timing.
- Cap rate 8.1% vs local median 4.3% in Delray Beach — top-decile yield for the area; either an underpriced asset or a hidden risk that comps aren't pricing in. Stress-test before assuming the spread holds.
Location & tenants
- Location reads 77/100 on livability (#202 in FL, #3,160 nationally) — a middle-class / working-renter tenant base. Strengths: housing A+, health & safety A+, commute A-; Watch: cost of living C-, crime D-, amenities F.
- Palm Beach (suburban): math 46% / reading 53% proficiency, ranked #34 of 73 in FL (top 47%) — families likely to look elsewhere, expect single-tenant / working-renter base with shorter leases.
- Market conditions: Rents rising (+1.8%/yr); 354 active listings in the ZIP; 40 comparable units currently listed for rent nearby; rentals at typical pace (median 25d on market — plan ~3-4 weeks tenant-placement turnaround); solid renter incomes; 3,974 units permitted in Palm Beach County in 2024 (1,012 in 5+ unit buildings).
- This rent runs 34% of the median local income ($78k/yr) — at the standard rent-burdened threshold; future hikes will face affordability resistance.
Forward outlook
- Local home prices are declining (-3.0%/yr); year-one equity from $1k of loan paydown is wiped out by about $4k of value loss. Plan a longer hold.
- Palm Beach County population projected at +30% by 2050 — long-run rental-demand tailwind backs the buy-and-hold thesis.
Negotiation context
- It's been on market 99 days — a 9% lower offer ($136k) is reasonable based on typical stale-listing flexibility.
- 2 sale attempts since 21y ago; this cycle's ask has dropped $26k (15%) from the opening price — seller is motivated, your offer sets the floor, not the list.
Risks & watch-outs
- Watch-outs: HOA is 28% of rent.
- Climate carrying-cost: severe wind risk, 99% chance of damaging wind over 30y; extreme-heat days projected 7→28/yr by 2055 (HVAC capex compounding) — expect insurance premiums to compound above CPI over the hold.
Questions for the listing agent
- It's been on market 99 days. Have you received any prior offers? Is the seller open to a 9% concession, seller financing, or rate buy-down credit?
- Built in 1975 — when were the roof, HVAC, electrical panel, plumbing, and water heater last replaced?
- What does the HOA fee cover, when was the last increase, and are there any pending special assessments or reserve-fund shortfalls?
- Any open or pending special assessments — roof, HVAC, plumbing, elevator, façade? What's the per-unit balance and payoff schedule, and is the seller paying it off at close or rolling it to the buyer?
- Why hasn't it sold? Are there any deal-killer items the seller is aware of (foundation, flood, title, zoning, code violations)?
- Is there a deadline driving the sale (1031 exchange, divorce, estate, relocation)? That informs how much negotiation room exists.
- Schools are B-rated — typically a magnet for longer-tenancy family renters. What's the average tenant stay here, and is there a school-zone premium baked into asking?
- Crime grade is D in this area — have there been break-ins, vandalism, or insurance claims at this property in the last 3 years? What carrier currently insures it and at what premium?
- What's the average days-on-market for RENTAL listings here right now (not sales)? A rising rental-DOM trend means longer vacancies and softer asking-rent achievability than the comps imply.
- What's the recent tenant-quality profile in this submarket — average credit score on applications, eviction rate, late-payment / NSF rate, and stable-employment percentage? A property-management company in the area should have these aggregated.
- How much new apartment / multifamily construction is in the pipeline within 1–3 miles? Heavy new supply (>2% of stock underway) typically softens rents 12–24 months out; light construction supports rent growth.
Investment metrics
- 1% rule
- 1.49% ✓
- Cap rate
- 8.13%
- Cash-on-cash
- 6.57%
- DSCR
- 1.29
- GRM
- 5.6
CMA / ARV
No comps found within radius.
Projected returns pro-forma
-3.0% appreciation · 1.83% rent growth · sell at horizon
- IRR
- -7.8%
- Equity multiple
- 0.72×
- Total profit
- $-11,840
- Equity at exit
- $22,216
- IRR
- -0.2%
- Equity multiple
- 0.99×
- Total profit
- $-568
- Equity at exit
- $12,883
Cash invested: $41,720 (down + closing). Projections, not guarantees.
Landlord ↔ Tenant lean methodology
- Overall (STATE)
- 87 Strongly Landlord-Friendly
- State Florida
- 87 Strongly Landlord-Friendly · R+3
- County
- — inherits STATE
- City
- — inherits STATE
ZIP-level market 33445
- Rents YoY
- 1.8%
- Active inventory
- 354
- Price-to-rent
- 5.6×
Monthly cashflow live
- Estimated rent
- $2,227 high interval (Pro) →
- Mortgage (P&I)
- −$781
- Tax from tax record
- −$65 /mo · $776/yr
- Insurance
- −$62
- HOA
- −$623
- Vacancy / Maint / Mgmt
- −$468
- Net cashflow
- $229
Break-even live
Sensitivity live
| Price | -10% $313 | -5% $271 | +0% $229 | +5% $186 | +10% $144 |
|---|---|---|---|---|---|
| Rent | -10% $53 | -5% $141 | +0% $229 | +5% $317 | +10% $404 |
| Rate | -1.0pp $304 | -0.5pp $266 | base $229 | +0.5pp $190 | +1.0pp $151 |
UW: 25.0% down · 7.5% · 30yr · 1.5% tax · 5.0% vac · 8.0% maint · 8.0% mgmt
Financing live
Cash to close
- Down payment
- $37,250
- Closing costs
- $4,470
- Reserves months
- —
- Total cash needed
- —
Loan-product check · same deal, 3 products live
Conventional
25% down · 7.5% · 30yr
- Down + closing
- —
- Monthly P&I
- —
- Monthly cashflow
- —
- DSCR
- —
- Eligible?
- —
Personal DTI + credit; lowest rate.
DSCR
20% down · 8.5% · 30yr
- Down + closing
- —
- Monthly P&I
- —
- Monthly cashflow
- —
- DSCR
- —
- Eligible?
- —
No personal income docs; deal must DSCR.
Hard money
10% down · 12.0% · 12mo
- Down + closing
- —
- Monthly P&I
- —
- Monthly cashflow
- —
- DSCR
- —
- Eligible?
- —
Short-term bridge; refi at stabilization.
Rent comps 40 comps
| Address | Beds | Baths | Sqft | Rent | $/sqft | DOM | Units | Dist |
|---|---|---|---|---|---|---|---|---|
| 1020 Silk Oak Ter #104 Delray Beach, FL | 2.0 | 2.0 | 1167 | $2,500 | $2.14 | 24d | 1 | 0.03mi |
| 2520 Pansy Ln Unit D Delray Beach, FL | 2.0 | 2.0 | 1167 | $2,150 | $1.84 | 24d | 1 | 0.09mi |
| 2521 Pansey Ln Unit 7A Delray Beach, FL | 2.0 | 2.0 | 1167 | $2,100 | $1.80 | 24d | 1 | 0.10mi |
| 2480 Juniper Dr #204 Delray Beach, FL | 2.0 | 2.0 | 1167 | $1,750 | $1.50 | 24d | 1 | 0.11mi |
| 2480 Juniper Dr #203 Delray Beach, FL | 2.0 | 2.0 | 1167 | $1,900 | $1.63 | 24d | 1 | 0.11mi |
| 2403 Lowson Blvd Unit D Delray Beach, FL | 2.0 | 2.0 | 1020 | $2,200 | $2.16 | 24d | 1 | 0.13mi |
| 2403 Lowson Blvd Unit C Delray Beach, FL | 1.0 | 1.5 | 821 | $1,650 | $2.01 | 22d | 1 | 0.13mi |
| 2381 Papaya Dr Unit C Delray Beach, FL | 2.0 | 2.0 | 1100 | $1,795 | $1.63 | 8d | 1 | 0.14mi |
| 2381 Papaya Dr Unit 92C Delray Beach, FL | 2.0 | 2.0 | 1100 | $1,795 | $1.63 | 24d | 1 | 0.14mi |
| 1100 Boxwood Dr #101 Delray Beach, FL | 2.0 | 2.0 | 1167 | $1,800 | $1.54 | 15d | 1 | 0.14mi |
| 1021 Flame Vine Ave Delray Beach, FL | 2.0 | 2.0 | 1167 | $1,750 | $1.50 | 24d | 1 | 0.15mi |
| 1001 Flame Vine Ave #202 Delray Beach, FL | 2.0 | 2.0 | 1167 | $2,800 | $2.40 | 24d | 1 | 0.15mi |
| 1060 Homewood Blvd Unit J102 Delray Beach, FL | 2.0 | 2.0 | 1247 | $2,450 | $1.96 | 21d | 1 | 0.18mi |
| 1120 Homewood Blvd Unit G204 Delray Beach, FL | 2.0 | 2.0 | 1247 | $2,550 | $2.04 | 20d | 1 | 0.18mi |
| 1101 Cactus Ter #203 Delray Beach, FL | 2.0 | 2.0 | 1167 | $2,100 | $1.80 | 18d | 1 | 0.22mi |
| 1130 Cactus Ter Unit 45C Delray Beach, FL | 2.0 | 1.5 | 982 | $2,000 | $2.04 | 24d | 1 | 0.25mi |
| 2731 Knight Ln Delray Beach, FL | 2.0 | 2.0 | 1050 | $2,650 | $2.52 | 24d | 1 | 0.27mi |
| 2500 Fiore Way Delray Beach, FL | 1.0–2.0 | 1.5–2.0 | 874 | $2,150 | $2.46 | 18d | 2 | 0.27mi |
| 1121 Cactus Ter #202 Delray Beach, FL | 2.0 | 2.0 | 1167 | $2,100 | $1.80 | 24d | 1 | 0.27mi |
| 2500 Fiore Way #1110 Delray Beach, FL | 2.0 | 2.0 | 1023 | $1,850 | $1.81 | 24d | 1 | 0.27mi |
| 1140 Mahogany Way #204 Delray Beach, FL | 2.0 | 2.0 | 1167 | $2,700 | $2.31 | 24d | 1 | 0.28mi |
| 2500 Fiore Way #109 Delray Beach, FL | 1.0 | 1.5 | 825 | $2,150 | $2.61 | 12d | 1 | 0.28mi |
| 2600 Fiore Way #2140 Delray Beach, FL | 2.0 | 2.0 | 1023 | $2,175 | $2.13 | 4d | 1 | 0.31mi |
| 2715 Ponce de Leon Blvd Delray Beach, FL | 2.0 | 1.0 | 1000 | $2,200 | $2.20 | 24d | 1 | 0.32mi |
| 1141 Calamondin Ter #203 Delray Beach, FL | 2.0 | 2.0 | 1167 | $1,700 | $1.46 | 24d | 1 | 0.32mi |
| 2733 Zorno Way Delray Beach, FL | 2.0 | 2.0 | 1245 | $2,950 | $2.37 | 20d | 1 | 0.32mi |
| 2700 Fiore Way #2020 Delray Beach, FL | 2.0 | 2.0 | 1023 | $2,500 | $2.44 | 5d | 1 | 0.33mi |
| 2835 SW 13th St #201 Delray Beach, FL | 2.0 | 2.0 | 1144 | $1,975 | $1.73 | 19d | 1 | 0.35mi |
| 2450 Black Olive Blvd Unit A Delray Beach, FL | 2.0 | 2.0 | 1167 | $1,950 | $1.67 | 15d | 1 | 0.35mi |
| 2450 Black Olive Blvd Unit A Delray Beach, FL | 2.0 | 2.0 | 1167 | $1,950 | $1.67 | 24d | 1 | 0.35mi |
| 2730 SW 13th St #203 Delray Beach, FL | 2.0 | 2.0 | 1084 | $2,200 | $2.03 | 24d | 1 | 0.36mi |
| 2109 Catherine Dr #4 Delray Beach, FL | 2.0 | 1.0 | 842 | $1,950 | $2.32 | 22d | 1 | 0.37mi |
| 2520 Black Olive Blvd #203 Delray Beach, FL | 2.0 | 2.0 | 1167 | $1,799 | $1.54 | 4d | 1 | 0.37mi |
| 2520 Black Olive Blvd #203 Delray Beach, FL | 2.0 | 2.0 | 1167 | $1,799 | $1.54 | 24d | 1 | 0.37mi |
| 2201 Catherine Dr Unit 3 Delray Beach, FL | 2.0 | 1.0 | 876 | $2,100 | $2.40 | 24d | 1 | 0.38mi |
| 1511 Ilene Ct #4 Delray Beach, FL | 2.0 | 1.0 | 844 | $1,950 | $2.31 | 24d | 1 | 0.41mi |
| 2828 Casita Way Delray Beach, FL | 2.0 | 2.0 | 1023 | $2,248 | $2.20 | 24d | 2 | 0.41mi |
| 2828 Casita Way #214 Delray Beach, FL | 2.0 | 2.0 | 1023 | $2,300 | $2.25 | 15d | 1 | 0.41mi |
| 2900 Fiore Way #2110 Delray Beach, FL | 2.0 | 2.0 | 1023 | $2,385 | $2.33 | 4d | 1 | 0.42mi |
| 2828 Casita Way #1020 Delray Beach, FL | 2.0 | 2.0 | 1023 | $2,000 | $1.96 | 21d | 1 | 0.42mi |
HOA detail condo
- Monthly dues
- $623 · $7,476/yr
- Likely covers
- pool
- Assessments
- None detected in remarks — confirm with the listing agent.
Listing history 21 events
-
2026-06-18days on market $149,000 Active 99 DOM
-
2026-06-17days on market $149,000 Active 98 DOM
-
2026-06-16days on market $149,000 Active 97 DOM
-
2026-06-15days on market $149,000 Active 96 DOM
-
2026-06-13days on market $149,000 Active 94 DOM
-
2026-06-09days on market $149,000 Active 90 DOM
-
2026-06-08days on market $149,000 Active 89 DOM
-
2026-06-07days on market $149,000 Active 88 DOM
-
2026-06-04days on market $149,000 Active 85 DOM
-
2026-06-03days on market $149,000 Active 84 DOM
-
2026-06-02pricedays on market $149,000 Active 83 DOM
-
2026-06-01days on market $159,000 Active 82 DOM
-
2026-05-31days on market $159,000 Active 81 DOM
-
2026-04-13price $159,000
-
2026-03-10$175,000 Active
-
2014-10-21historical
-
2005-04-19soldstatus $132,000
-
2005-02-23$139,900
-
2005-02-15soldstatus $105,000
-
1994-06-16soldstatus $37,000
-
1984-06-01soldstatus $45,000
ⓘ Source: listings_history table (triggers on properties + properties_extension) + one-shot
backfill from property_details.listing_events for pre-trigger history.
Tax reassessment forecast FL · Resets to sale price
- Current annual tax
- $776 · $65/mo
- Projected year-2 tax
- $1,237 · $103/mo
- Expected delta
- +$461/yr (+$38/mo · 59.4%)
ⓘ Screening estimate from a state-policy table — verify with the county assessor before closing.
Climate risk First Street
- Flood 1/10 Low FEMA zone X (unshaded) · 0% chance over 30 yrs
- Wildfire 1/10 Low
- Heat 10/10 Extreme 7 d/yr ≥105°F today · 28 d/yr by 30 yrs out
- Wind 10/10 Extreme 99% chance of damaging wind over 30 yrs
- Air quality 3/10 Moderate 2 unhealthy d/yr today · 3 by 30 yrs out
Nearby sold comps map
Loading sold comps map…
Walkable amenities ~0.75 mi
Loading nearby amenities…
Taxation est. · year 1
- Rental income
- $26,729
- − Mortgage interest
- −$8,346
- − Property taxes
- −$776
- − Insurance
- −$745
- − Repairs & maintenance
- −$2,138
- − Management
- −$2,138
- − HOA
- −$7,476
- − Depreciation
- −$4,335
- Taxable income
- $774
- Est. tax owed @ 24.0%
- −$186
- After-tax cash flow
- $2,556/yr
For passive investors: Depreciation is non-cash, so a rental often shows a tax loss while cash-flowing — sheltering income. Rental losses are passive: they offset passive income freely, and up to $25,000/yr can offset ordinary (W-2) income if you actively participate and your MAGI is under $100k (phasing out to $0 by $150k); unused losses carry forward. On sale, claimed depreciation is recaptured at up to 25%, and gains may owe capital-gains tax (a 1031 exchange can defer both). Figures are a year-1 estimate at your 24.0% rate — not tax advice; consult a CPA.
Schools (NCES district)
- District
- Palm Beach
- NCES district ID
- 1201500
- Math proficiency
- 46% ▼ -16.00%
- Reading proficiency
- 53% ▼ -4.00%
- Median HH income
- $53,943
- Composite
- 42.72/100
- National rank
- #3160
- State rank
- #34 of 73 in FL
Livability — Delray Beach
- Score
- 77/100
- State rank
- #202
- US rank
- #3160
Category grades
Schools grade is shown separately in the Schools card above.
Census & demographics
- Census place
- Delray Beach, FL
- County
- Palm Beach County · 1,438,312 people
- City population
- 123,167
- Metro
- Miami-Fort Lauderdale-Pompano Beach, FL
- Population (ZIP)
- 33,122
- Household income
- $78,163
- Rent vs Own
- Severe rent burden
- 1649.0
Population outlook (Palm Beach County) Hauer SSP2
- Today (2025)
- 1,637,487 people
- By 2030
- 1,743,255 · +6.5%
- By 2040
- 1,948,712 · +19.0%
- By 2050
- 2,132,979 · +30.3%
- By 2075
- 2,530,027 · +54.5%
- By 2100
- 2,706,979 · +65.3%
Race, ethnicity, and origin ACS 2023
- Neighborhood character
- Diverse neighborhood (Simpson 0.62)
- Race & ethnicity
- White 55% Black 24% Hispanic / Latino 11% Two or more races 11% Asian 4%
- Hispanic origin (detail)
- Puerto Rican 3% Cuban 2%
- Common ancestry
- Hispanic 14% Romanian 3% Scotch-Irish 3%
- Foreign-born
- 27% · Canada, Jamaica, Dominican Republic
- Languages at home
- 66% English-only · French/Haitian/Cajun 18% Spanish 9% Other Indo-European 4%
Political lean MEDSL · Palm Beach
- 2024 margin
- Toss-up / Even · D 50.0% · R 49.2%
- 2008→2024 swing
- -22.1pp toward R · 2008: 22.9pp · 2024: 0.8pp
- All cycles
- 2024: D+0.8 2020: D+12.8 2016: D+15.3 2012: D+17.0 2008: D+22.9
Not yet ingested
- Civics
- —
Market trends
- HPI YoY
- ▼ -258.16%
- Current HPI
- 349.5505
- Rent YoY
- ▲ 1.83%
- Metro
- Miami-Fort Lauderdale-Pompano Beach, FL
- State GDP YoY
- ▲ 3.28%
- F500 in state
- 36
Industry mix (Fortune 500 HQ in FL)
| Industry | F500 HQs | Revenue |
|---|---|---|
| Industrial Technology | 2 | $29B |
|
||
| Insurance | 2 | $17B |
|
||
| Retail | 1 | $60B |
|
||
| Technology Distribution | 1 | $58B |
|
||
| Homebuilding | 1 | $35B |
|
||
| Technology Manufacturing | 1 | $35B |
|
||
Price history
+253.3% since first listed8 events — show timeline
- 2026-04-13 Price Changed $159,000 Beaches MLS
- 2026-03-10 Listed $175,000 Beaches MLS
- 2014-10-21 Listing Removed — Beaches MLS
- 2005-04-19 Sold (Public Records) $132,000 Public Records
- 2005-02-23 Listed $139,900 Beaches MLS
- 2005-02-15 Sold (Public Records) $105,000 Public Records
- 1994-06-16 Sold (Public Records) $37,000 Public Records
- 1984-06-01 Sold (Public Records) $45,000 Public Records
Property tax history
-2.3%/yrLatest (2025): $776 · +13.8% YoY. Source: county tax records.
Cash-flow waterfall
monthlySold comps — $/sqft
last 12 mo · ≤1 miLoading sold comps…