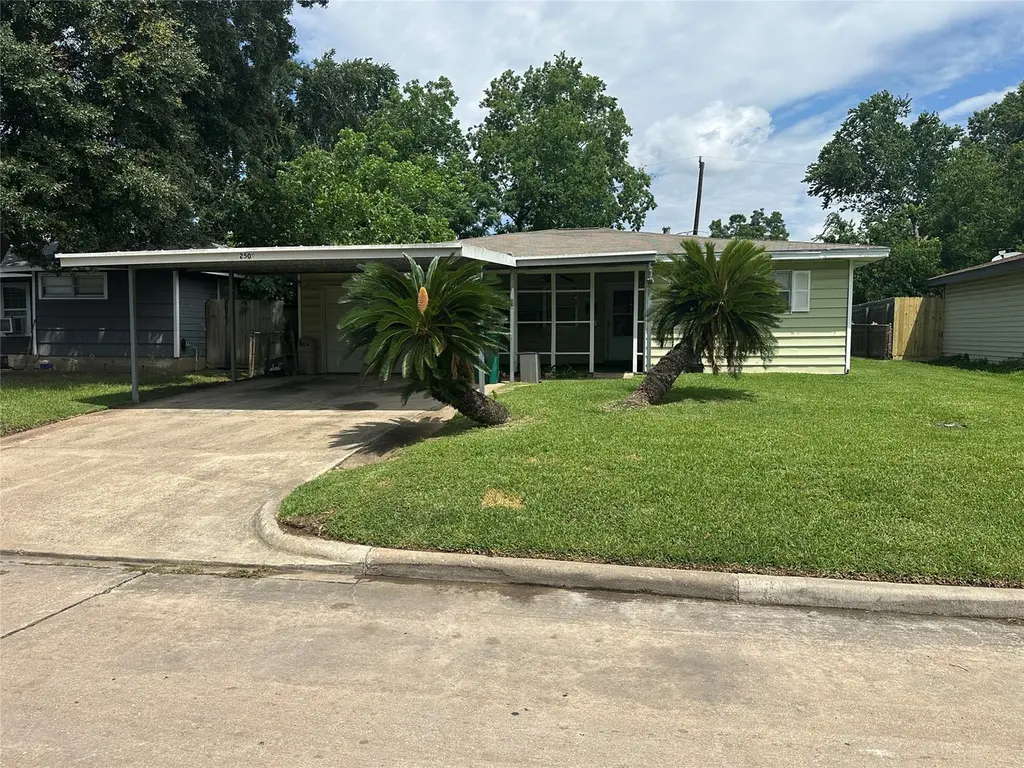
2509 Thomas Ave · Pasadena, TX
Flood risk 6/10 · Moderate
- FEMA flood zone
- X (unshaded)
- Chance of flooding over 30 yrs
- 0.68%
- Est. flood insurance / yr
- $507 – $1,088
Fire risk 1/10 · Minimal
- Est. fire insurance / yr
- $1,222 – $2,270
Heat risk 9/10 · Severe
- Hot days now (above 109°F)
- 7 days/yr
- Hot days in 30 yrs
- 22 days/yr
Wind risk 9/10 · Severe
- Chance of severe wind over 30 yrs
- 99.0%
Air-quality risk 2/10 · Minimal
- Unhealthy air days now
- 2 days/yr
- Unhealthy air days in 30 yrs
- 2 days/yr
Risk factors via First Street. Map © Google.
Why this score? — see what drove the C grade
The composite is a weighted blend of 9 inputs, each scored 0–100. Each bar is that input's sub-score; the figure is the points it added to the 100-point composite (weight × sub-score).
- Cash flow +19.7/30.0
- ARV discount +15.0/15.0
- 1% rule +6.8/10.0
- DSCR +6.2/10.0
- Livability +3.3/5.0
- Schools +2.6/10.0
- Rent growth +2.5/5.0
- Condition / age +2.5/5.0
- Appreciation +0.0/10.0
$127,900
🖨 Deal sheet 📄 Offer letter ✓ Due diligence
Listing remarks
Here is another great opportunity for investors looking to add to their portfolio or buyer looking to create a masterpiece on their own canvas. Located in the established Red Bluff Terrace neighborhood, this property offers strong potential and long-term value. The home does need repairs and updates, and is being sold “As Is” as the seller will make no repairs. With the right improvements, this property value can increase easily and become a great residence or investment opportunity. This one will not last long.
Key facts
- Repairs and updates
- 6,320 sq ft lot
- Garage
Tags
Property features AI
Finance
- HOA & community: Community playground; Community park
Exterior
- Parking: Attached garage (1 car); Attached carport (2 cars); Garage and attached carport
- Utilities: Public water; Public sewer
- Home design: Residential property; Faces south; Built in 1955; Slab foundation
- Construction: Vinyl siding; Wood siding; Composition roof
- Exterior features: Fenced backyard; Porch
Interior
- Kitchen: Gas cooktop; Gas oven
- Flooring: Carpet; Laminate; Wood
- Bathrooms: 1 full bathroom
- Heating & cooling: Window-unit heating; Window-unit cooling
- Interior features: Breakfast bar; Tub with shower; Kitchen/dining combo; 6 total rooms
- Laundry & utility: Washer hookup; Gas dryer hookup
Neighborhood map
What this means for you Summary
Snapshot
- This is a 3-bed/1.0-bath single-family listed at $128k.
Deal economics
- At list price, monthly cash flow is $150 ($2k/yr) — positive.
- The deal already cash-flows at list — no discount required.
- Meets the 1% rule at list price ($2k rent vs $128k).
- Recommended offer: $126k (1.5% below list) — sets the bar for market timing.
- Cap rate 7.7% vs local median 3.4% in Pasadena — top-decile yield for the area; either an underpriced asset or a hidden risk that comps aren't pricing in. Stress-test before assuming the spread holds.
Location & tenants
- Location reads 66/100 on livability (#600 in TX) — a middle-class / working-renter tenant base. Strengths: cost of living A+, housing A+; Watch: employment D+, crime F, amenities F.
- Pasadena ISD (suburban): math 29% / reading 32% proficiency, ranked #612 of 826 in TX (top 74%) — families likely to look elsewhere, expect single-tenant / working-renter base with shorter leases; 71% free/reduced lunch — lower-income household profile, screen leases tightly.
- Zoned schools: Red Bluff El (math 27% / reading 27%, grade F, #2,791 of 4,322 statewide, top 68%, 526 students, 95% FRL); Keller Middle (math 15% / reading 21%, grade F, #1,491 of 1,662 statewide, top 91%, 657 students, 92% FRL); Pasadena H S (math 41% / reading 31%, grade F, #930 of 1,632 statewide, top 57%, 2,221 students, 90% FRL) — zoned schools average 92% FRL vs 71% district-wide (21 pts higher); higher-poverty schools than district average — tighter screening recommended.
- Market conditions: 104 active listings in the ZIP; 11 comparable units currently listed for rent nearby; rentals at typical pace (median 22d on market — plan ~3-4 weeks tenant-placement turnaround); 45% of comp listings sitting > 30 days — soft ceiling on asking rent; 29,883 units permitted in Harris County in 2024 (8,621 in 5+ unit buildings).
Forward outlook
- Local home prices are declining (-3.0%/yr); year-one equity from $884 of loan paydown is wiped out by about $4k of value loss. Plan a longer hold.
- Harris County population projected at +47% by 2050 — long-run rental-demand tailwind backs the buy-and-hold thesis.
Negotiation context
- It's been on market 21 days — a 2% lower offer ($126k) is reasonable based on typical stale-listing flexibility.
- 2 sale attempts since 24y ago with the ask held roughly flat each time — persistent listings suggest the price (not the market) is what's stuck; bring a comps-based counter.
Risks & watch-outs
- Watch-outs: property tax is 2.9% of price; built in 1955 — expect roof / HVAC / electrical / plumbing capex.
- Climate carrying-cost: major flood risk; severe wind risk, 99% chance of damaging wind over 30y; extreme-heat days projected 7→22/yr by 2055 (HVAC capex compounding) — expect insurance premiums to compound above CPI over the hold.
Questions for the listing agent
- Built in 1955 — when were the roof, HVAC, electrical panel, plumbing, and water heater last replaced?
- Property tax is high relative to price — has the assessment been appealed recently, and will the sale trigger a re-assessment?
- Is there a deadline driving the sale (1031 exchange, divorce, estate, relocation)? That informs how much negotiation room exists.
- Schools are D-rated, which usually means shorter tenancies and higher turnover. Who's the typical renter profile here, and what's been the actual vacancy rate?
- Crime grade is F in this area — have there been break-ins, vandalism, or insurance claims at this property in the last 3 years? What carrier currently insures it and at what premium?
- What's the average days-on-market for RENTAL listings here right now (not sales)? A rising rental-DOM trend means longer vacancies and softer asking-rent achievability than the comps imply.
- What's the recent tenant-quality profile in this submarket — average credit score on applications, eviction rate, late-payment / NSF rate, and stable-employment percentage? A property-management company in the area should have these aggregated.
- How much new for-sale + rental construction is in the pipeline within 1–3 miles? Heavy new supply typically softens prices + rents 12–24 months out; constrained supply supports both.
Investment metrics
- 1% rule
- 1.18% ✓
- Cap rate
- 7.70%
- Cash-on-cash
- 5.04%
- DSCR
- 1.22
- GRM
- 7.1
CMA / ARV
- ARV (on-the-fly)
- $209,264
- Comps found
- 12
Show comp detail 12 sales within ~0.75 mi
| Address | Dist | Beds/Ba | Sqft | Sold | Price | $/sf | Match |
|---|---|---|---|---|---|---|---|
| 2308 Garvey Dr | 0.18mi | 4/2.0 (+1) | 1,281 (+0%) | 0mo | $239,900 | $187 | 82 |
| 2313 Ingersol Ave | 0.26mi | 4/2.0 (+1) | 1,273 (-0%) | 3mo | $214,900 | $169 | 76 |
| 119 Burke Rd | 0.25mi | 4/2.0 (+1) | 1,235 (-3%) | 2mo | $215,000 | $174 | 72 |
| 203 Alastair Dr | 0.36mi | 4/2.0 (+1) | 1,267 (-1%) | 1mo | $180,000 | $142 | 72 |
| 619 Burke Rd | 0.34mi | 4/2.0 (+1) | 1,225 (-4%) | 1mo | $150,000 | $122 | 67 |
| 2307 Windsor Ln | 0.53mi | 3/2.0 | 1,200 (-6%) | 1mo | $199,900 | $167 | 61 |
| 2116 Garvey Dr | 0.31mi | 3/2.0 | 1,424 (+12%) | 4mo | $219,900 | $154 | 59 |
| 2616 Windsor Ln | 0.57mi | 4/2.0 (+1) | 1,220 (-4%) | 1mo | $229,990 | $189 | 57 |
| 2510 Windsor Ln | 0.55mi | 4/2.0 (+1) | 1,221 (-4%) | 2mo | $199,990 | $164 | 56 |
| 3119 Washington St | 0.72mi | 3/2.0 | 1,142 (-10%) | 1mo | $124,500 | $109 | 44 |
| 2716 N Harris Ave | 0.73mi | 3/1.0 | 1,107 (-13%) | 0mo | $179,900 | $163 | 44 |
| 940 Coleman Ave | 0.73mi | 4/2.0 (+1) | 1,416 (+11%) | 1mo | $165,000 | $117 | 38 |
Match score weights: distance 35% · size 25% · config 20% · recency 20%. Top-matched comps best support the ARV.
Projected returns pro-forma
-3.0% appreciation · 3.0% rent growth · sell at horizon
- IRR
- -8.4%
- Equity multiple
- 0.69×
- Total profit
- $-11,033
- Equity at exit
- $19,070
- IRR
- 1.3%
- Equity multiple
- 1.09×
- Total profit
- $3,198
- Equity at exit
- $11,058
Cash invested: $35,812 (down + closing). Projections, not guarantees.
Landlord ↔ Tenant lean methodology
- Overall (STATE)
- 87 Strongly Landlord-Friendly
- State Texas
- 87 Strongly Landlord-Friendly · R+5
- County
- — inherits STATE
- City
- — inherits STATE
ZIP-level market 77506
- Home prices YoY
- -15.5%
- Active inventory
- 104
- Price-to-rent
- 7.1×
Monthly cashflow live
- Estimated rent
- $1,503 high interval (Pro) →
- Mortgage (P&I)
- −$671
- Tax from tax record
- −$313 /mo · $3,756/yr
- Insurance
- −$53
- HOA
- −$0
- Vacancy / Maint / Mgmt
- −$316
- Net cashflow
- $150
Break-even live
UW: 25.0% down · 7.5% · 30yr · 1.5% tax · 5.0% vac · 8.0% maint · 8.0% mgmt
Financing live
Cash to close
- Down payment
- $31,975
- Closing costs
- $3,837
- Reserves months
- —
- Total cash needed
- —
Loan-product check · same deal, 3 products live
Conventional
25% down · 7.5% · 30yr
- Down + closing
- —
- Monthly P&I
- —
- Monthly cashflow
- —
- DSCR
- —
- Eligible?
- —
Personal DTI + credit; lowest rate.
DSCR
20% down · 8.5% · 30yr
- Down + closing
- —
- Monthly P&I
- —
- Monthly cashflow
- —
- DSCR
- —
- Eligible?
- —
No personal income docs; deal must DSCR.
Hard money
10% down · 12.0% · 12mo
- Down + closing
- —
- Monthly P&I
- —
- Monthly cashflow
- —
- DSCR
- —
- Eligible?
- —
Short-term bridge; refi at stabilization.
Rent comps 11 comps
| Address | Beds | Baths | Sqft | Rent | $/sqft | DOM | Units | Dist |
|---|---|---|---|---|---|---|---|---|
| 2405 Pomona Dr Pasadena, TX | 3.0 | 1.0 | 1162 | $1,499 | $1.29 | 43d | 1 | 0.16mi |
| 205 Tilden Dr Pasadena, TX | 3.0 | 1.0 | 1208 | $1,550 | $1.28 | 43d | 1 | 0.42mi |
| 719 Burke Rd Pasadena, TX | 3.0 | 2.0 | 1158 | $2,000 | $1.73 | 4d | 1 | 0.43mi |
| 3112 Grant St Pasadena, TX | 3.0 | 1.0 | 1330 | $1,625 | $1.22 | 21d | 1 | 0.71mi |
| 707 Preston Ave Pasadena, TX | 2.0 | 2.0 | 965 | $949 | $0.98 | 44d | 1 | 0.80mi |
| 707 Preston Ave Pasadena, TX | 3.0 | 2.0 | 1250 | $1,089 | $0.87 | 21d | 1 | 0.80mi |
| 3119 Chestershire Dr Pasadena, TX | 3.0 | 1.0 | 1081 | $1,625 | $1.50 | 43d | 1 | 0.81mi |
| 1750 Jenkins Rd Pasadena, TX | 2.0 | 2.0 | 926 | $1,135 | $1.23 | 43d | 1 | 0.93mi |
| 1744 Jenkins Rd Pasadena, TX | 1.0–2.0 | 1.0–2.0 | 807 | $1,365 | $1.69 | 5d | 1 | 0.93mi |
| 2401 Southmore Ave Pasadena, TX | 1.0–3.0 | 1.0–2.0 | 835 | $1,325 | $1.59 | 3d | 4 | 1.08mi |
| 1413 George St Pasadena, TX | 3.0 | 1.0 | 998 | $1,695 | $1.70 | 5d | 1 | 1.41mi |
Listing history 13 events
-
2026-06-09days on market $127,900 Pending 21 DOM
-
2026-06-08days on market $127,900 Pending 20 DOM
-
2026-06-07statusdays on market $127,900 Pending 19 DOM
-
2026-06-04days on market $127,900 Active 16 DOM
-
2026-06-03days on market $127,900 Active 15 DOM
-
2026-06-02days on market $127,900 Active 14 DOM
-
2026-06-01days on market $127,900 Active 13 DOM
-
2026-05-31days on market $127,900 Active 12 DOM
-
2026-05-19$127,900 Active
-
2026-05-04soldstatus
-
2003-02-08historical
-
2002-08-08$78,900
-
1988-01-02soldstatus
ⓘ Source: listings_history table (triggers on properties + properties_extension) + one-shot
backfill from property_details.listing_events for pre-trigger history.
Tax reassessment forecast TX · Resets to sale price
- Current annual tax
- $3,756 · $313/mo
- Projected year-2 tax
- $3,756 · $313/mo
- Expected delta
- $0/yr ($0/mo · 0.0%)
ⓘ Screening estimate from a state-policy table — verify with the county assessor before closing.
Climate risk First Street
- Flood 6/10 Major FEMA zone X (unshaded) · 68% chance over 30 yrs
- Wildfire 1/10 Low
- Heat 9/10 Extreme 7 d/yr ≥109°F today · 22 d/yr by 30 yrs out
- Wind 9/10 Extreme 99% chance of damaging wind over 30 yrs
- Air quality 2/10 Low 2 unhealthy d/yr today · 2 by 30 yrs out
Nearby sold comps map
Loading sold comps map…
Walkable amenities ~0.75 mi
Loading nearby amenities…
Taxation est. · year 1
- Rental income
- $18,036
- − Mortgage interest
- −$7,164
- − Property taxes
- −$3,756
- − Insurance
- −$640
- − Repairs & maintenance
- −$1,443
- − Management
- −$1,443
- − Depreciation
- −$3,721
- Taxable loss
- −$130
- Est. tax savings @ 24.0%
- +$31
- After-tax cash flow
- $1,836/yr
For passive investors: Depreciation is non-cash, so a rental often shows a tax loss while cash-flowing — sheltering income. Rental losses are passive: they offset passive income freely, and up to $25,000/yr can offset ordinary (W-2) income if you actively participate and your MAGI is under $100k (phasing out to $0 by $150k); unused losses carry forward. On sale, claimed depreciation is recaptured at up to 25%, and gains may owe capital-gains tax (a 1031 exchange can defer both). Figures are a year-1 estimate at your 24.0% rate — not tax advice; consult a CPA.
Schools (NCES district)
- District
- Pasadena ISD
- NCES district ID
- 4834320
- Math proficiency
- 29% ▼ -17.00%
- Reading proficiency
- 32% ▼ -9.00%
- Median HH income
- $45,163
- Composite
- 26.15/100
- National rank
- #7275
- State rank
- #612 of 826 in TX
Livability — Pasadena
- Score
- 66/100
- State rank
- #600
- US rank
- #11438
Category grades
Schools grade is shown separately in the Schools card above.
Census & demographics
- Census place
- Pasadena, TX
- City population
- 109,190
- Population (ZIP)
- 35,243
Population outlook (Harris County) Hauer SSP2
- Today (2025)
- 5,571,493 people
- By 2030
- 6,089,821 · +9.3%
- By 2040
- 7,142,806 · +28.2%
- By 2050
- 8,185,864 · +46.9%
- By 2075
- 10,574,329 · +89.8%
- By 2100
- 12,109,958 · +117.4%
Race, ethnicity, and origin ACS 2023
- Neighborhood character
- Predominantly Hispanic (89%)
- Race & ethnicity
- Hispanic / Latino 89% Two or more races 36% White 9% Black 1% Native American 1%
- Hispanic origin (detail)
- Mexican 77%
- Common ancestry
- Italian 1%
- Foreign-born
- 39% · Canada
- Languages at home
- 30% English-only · Spanish 69%
Political lean MEDSL · Harris
- 2024 margin
- Lean D (+5.5) · D 52.0% · R 46.4% · Other 1.6%
- 2008→2024 swing
- +3.9pp toward D · 2008: 1.6pp · 2024: 5.5pp
- All cycles
- 2024: D+5.5 2020: D+13.3 2016: D+12.4 2012: D+0.1 2008: D+1.6
Not yet ingested
- Civics
- —
Market trends
- HPI YoY
- ▼ -57.82%
- Current HPI
- 315.9695
- Rent YoY
- —
- Metro
- —
- State GDP YoY
- ▲ 3.95%
- F500 in state
- 110
Industry mix (Fortune 500 HQ in TX)
| Industry | F500 HQs | Revenue |
|---|---|---|
| Energy | 16 | $1,198B |
|
||
| Technology | 5 | $198B |
|
||
| Engineering / Construction | 4 | $72B |
|
||
| Energy Services | 3 | $60B |
|
||
| Utilities | 3 | $41B |
|
||
| Healthcare | 2 | $330B |
|
||
Price history
+62.1% since first listed5 events — show timeline
- 2026-05-19 Listed $127,900 HARMLS
- 2026-05-04 Sold (Public Records) — Public Records
- 2003-02-08 Listing Removed — HARMLS
- 2002-08-08 Listed $78,900 HARMLS
- 1988-01-02 Sold (Public Records) — Public Records
Property tax history
+7.1%/yrLatest (2025): $3,756 · -2.9% YoY. Source: county tax records.
Cash-flow waterfall
monthlySold comps — $/sqft
last 12 mo · ≤1 miLoading sold comps…