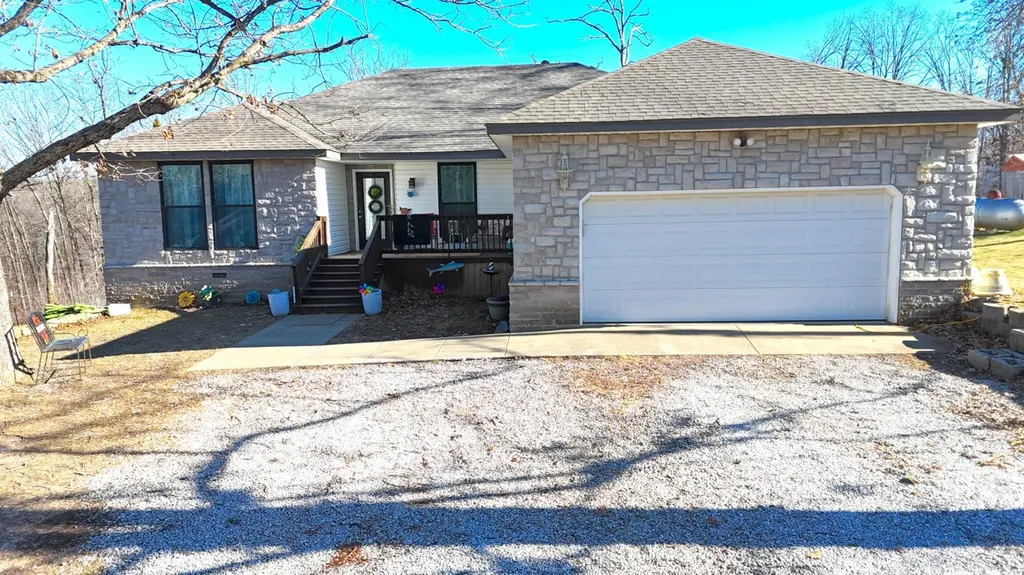
233 Castle Gate Dr · Seymour, MO
Flood risk 1/10 · Minimal
- FEMA flood zone
- X (unshaded)
- Chance of flooding over 30 yrs
- 0.0%
- Est. flood insurance / yr
- $507 – $1,088
Fire risk 4/10 · Minor
- Est. fire insurance / yr
- $1,054 – $1,958
Heat risk 4/10 · Minor
- Hot days now (above 105°F)
- 7 days/yr
- Hot days in 30 yrs
- 19 days/yr
Wind risk 2/10 · Minimal
- Chance of severe wind over 30 yrs
- 0.0%
Air-quality risk 2/10 · Minimal
- Unhealthy air days now
- 1 days/yr
- Unhealthy air days in 30 yrs
- 1 days/yr
Risk factors via First Street. Map © Google.
Why this score? — see what drove the D- grade
The composite is a weighted blend of 9 inputs, each scored 0–100. Each bar is that input's sub-score; the figure is the points it added to the 100-point composite (weight × sub-score).
- ARV discount +15.0/15.0
- Appreciation +9.8/10.0
- Cash flow +3.8/30.0
- Livability +3.1/5.0
- Schools +3.0/10.0
- Rent growth +2.5/5.0
- Condition / age +2.5/5.0
- 1% rule +0.0/10.0
- DSCR +0.0/10.0
$269,900
🖨 Deal sheet 📄 Offer letter ✓ Due diligence
Listing remarks MLS
CITY LOT WITH A PRIVATE COUNTRY SETTING!! This very open spacious floor plan offers an abundance of room for family, Guest, and comfortable living. Elegant kitchen with tons of cabinet and countertop space. An exceptional master suite with its very own private bathroom. Including a vanity, make up area, walkIn closet and walk in shower! Two other bedrooms and a full guest bath room. All this is on just shy of a half acre just minutes east of Seymour Missouri!!
Key facts
- Elegant kitchen
- Private bathroom
- Walk in closet
Tags
Neighborhood map
What this means for you Summary
Snapshot
- This is a 3-bed/2.0-bath other listed at $270k.
Deal economics
- At list price, monthly cash flow is $-781 ($-9k/yr) — negative.
- To cash-flow at today's rent, offer at most $132k (51.1% below list).
- To meet the 1% rule (rent ≥ 1% of price), the offer needs to be $106k (60.6% below list).
- Recommended offer: $106k (60.6% below list) — sets the bar for 1% rule.
- Cap rate 2.8% vs local median 2.0% in Seymour — top-decile yield for the area; either an underpriced asset or a hidden risk that comps aren't pricing in. Stress-test before assuming the spread holds.
Location & tenants
- Location reads 62/100 on livability (#374 in MO) — a middle-class / working-renter tenant base. Strengths: crime A+, cost of living A+, housing A+; Watch: schools D, amenities F, commute F.
- Seymour R-II (rural): math 28% / reading 43% proficiency, ranked #218 of 324 in MO (top 67%) — families likely to look elsewhere, expect single-tenant / working-renter base with shorter leases.
- Market conditions: 58 active listings in the ZIP; 168 units permitted in Webster County in 2024 (24 in 5+ unit buildings).
Forward outlook
- In year one you build about $28k of equity ($2k loan paydown + $26k appreciation (9.5% local appreciation)).
- Webster County population projected at +5% by 2050 — modest demand growth; plan on rents tracking national, not racing it.
- By year 2, paydown + projected appreciation supports a ~$44k cash-out refi (75% LTV) — recoverable capital for the next deal without selling this one.
Negotiation context
- It's been on market 150 days — a 12% lower offer ($238k) is reasonable based on typical stale-listing flexibility.
- 11 sale attempts since 13y ago with the ask held roughly flat each time — persistent listings suggest the price (not the market) is what's stuck; bring a comps-based counter.
Questions for the listing agent
- What do current leases actually rent for vs. the listed asking? Can we see a recent rent roll and the last 12 months of T-12 income?
- It's been on market 150 days. Have you received any prior offers? Is the seller open to a 61% concession, seller financing, or rate buy-down credit?
- Why hasn't it sold? Are there any deal-killer items the seller is aware of (foundation, flood, title, zoning, code violations)?
- Is there a deadline driving the sale (1031 exchange, divorce, estate, relocation)? That informs how much negotiation room exists.
- Schools are D-rated, which usually means shorter tenancies and higher turnover. Who's the typical renter profile here, and what's been the actual vacancy rate?
- The area grade is low — what's the realistic commute time and amenity access for the typical tenant pool here? Any planned neighborhood developments (good or bad) we should know about?
- What's the average days-on-market for RENTAL listings here right now (not sales)? A rising rental-DOM trend means longer vacancies and softer asking-rent achievability than the comps imply.
- What's the recent tenant-quality profile in this submarket — average credit score on applications, eviction rate, late-payment / NSF rate, and stable-employment percentage? A property-management company in the area should have these aggregated.
- How much new for-sale + rental construction is in the pipeline within 1–3 miles? Heavy new supply typically softens prices + rents 12–24 months out; constrained supply supports both.
Investment metrics
- 1% rule
- 0.39% ✗
- Cap rate
- 2.82%
- Cash-on-cash
- -12.41%
- DSCR
- 0.45
- GRM
- 21.1
CMA / ARV
- ARV (median comp)
- $336,600
- List price
- $269,900
- Delta
- -19.82%
- Verdict
- UNDERPRICED
- Comps
- 2 within 1.0 mi
Projected returns pro-forma
9.54% appreciation · 3.0% rent growth · sell at horizon
- IRR
- 14.5%
- Equity multiple
- 2.17×
- Total profit
- $88,564
- Equity at exit
- $234,074
- IRR
- 14.3%
- Equity multiple
- 4.94×
- Total profit
- $297,610
- Equity at exit
- $495,436
Cash invested: $75,572 (down + closing). Projections, not guarantees.
Landlord ↔ Tenant lean methodology
- Overall (STATE)
- 81 Strongly Landlord-Friendly
- State Missouri
- 81 Strongly Landlord-Friendly · R+10
- County
- — inherits STATE
- City
- — inherits STATE
ZIP-level market 65746
- Home prices YoY
- 3.6%
- Active inventory
- 58
- Price-to-rent
- 21.1×
Monthly cashflow live
- Estimated rent
- $1,064 medium interval (Pro) →
- Mortgage (P&I)
- −$1,415
- Tax from tax record
- −$94 /mo · $1,134/yr
- Insurance
- −$112
- HOA
- −$0
- Vacancy / Maint / Mgmt
- −$224
- Net cashflow
- $-781
Break-even live
UW: 25.0% down · 7.5% · 30yr · 1.5% tax · 5.0% vac · 8.0% maint · 8.0% mgmt
Financing live
Cash to close
- Down payment
- $67,475
- Closing costs
- $8,097
- Reserves months
- —
- Total cash needed
- —
Loan-product check · same deal, 3 products live
Conventional
25% down · 7.5% · 30yr
- Down + closing
- —
- Monthly P&I
- —
- Monthly cashflow
- —
- DSCR
- —
- Eligible?
- —
Personal DTI + credit; lowest rate.
DSCR
20% down · 8.5% · 30yr
- Down + closing
- —
- Monthly P&I
- —
- Monthly cashflow
- —
- DSCR
- —
- Eligible?
- —
No personal income docs; deal must DSCR.
Hard money
10% down · 12.0% · 12mo
- Down + closing
- —
- Monthly P&I
- —
- Monthly cashflow
- —
- DSCR
- —
- Eligible?
- —
Short-term bridge; refi at stabilization.
Listing history 31 events
-
2026-06-18days on market $269,900 Active 150 DOM
-
2026-06-17days on market $269,900 Active 149 DOM
-
2026-06-16days on market $269,900 Active 148 DOM
-
2026-06-15days on market $269,900 Active 147 DOM
-
2026-06-13days on market $269,900 Active 145 DOM
-
2026-06-12days on market $269,900 Active 144 DOM
-
2026-06-09days on market $269,900 Active 141 DOM
-
2026-06-08days on market $269,900 Active 140 DOM
-
2026-06-07days on market $269,900 Active 139 DOM
-
2026-06-07days on market $269,900 Active 138 DOM
-
2026-06-04days on market $269,900 Active 135 DOM
-
2026-06-02days on market $269,900 Active 134 DOM
-
2026-06-01days on market $269,900 Active 133 DOM
-
2026-05-31days on market $269,900 Active 132 DOM
-
2026-01-19$269,900 Active 464-char remark
Show marketing remark (464 chars)
CITY LOT WITH A PRIVATE COUNTRY SETTING!! This very open spacious floor plan offers an abundance of room for family, Guest, and comfortable living. Elegant kitchen with tons of cabinet and countertop space. An exceptional master suite with its very own private bathroom. Including a vanity, make up area, walkIn closet and walk in shower! Two other bedrooms and a full guest bath room. All this is on just shy of a half acre just minutes east of Seymour Missouri!!
-
2023-08-30status Active
-
2023-08-30status Active
-
2023-08-30status Active
-
2023-08-08historical
-
2023-08-04historical
-
2023-08-02historical
-
2023-07-24$365,000 Active
-
2023-05-31$365,500 Active
-
2023-05-16price $305,000
-
2023-04-19$365,500 Active
-
2023-04-19$365,500 Active
-
2020-09-28soldstatus
-
2020-05-13$184,900
-
2017-04-23$157,500
-
2014-08-08soldstatus
-
2013-05-31$114,900
ⓘ Source: listings_history table (triggers on properties + properties_extension) + one-shot
backfill from property_details.listing_events for pre-trigger history.
Tax reassessment forecast MO · Resets to sale price
- Current annual tax
- $1,134 · $94/mo
- Projected year-2 tax
- $2,618 · $218/mo
- Expected delta
- +$1,485/yr (+$124/mo · 131.0%)
ⓘ Screening estimate from a state-policy table — verify with the county assessor before closing.
Climate risk First Street
- Flood 1/10 Low FEMA zone X (unshaded) · 0% chance over 30 yrs
- Wildfire 4/10 Moderate
- Heat 4/10 Moderate 7 d/yr ≥105°F today · 19 d/yr by 30 yrs out
- Wind 2/10 Low 0% chance of damaging wind over 30 yrs
- Air quality 2/10 Low 1 unhealthy d/yr today · 1 by 30 yrs out
Nearby sold comps map
Loading sold comps map…
Walkable amenities ~0.75 mi
Loading nearby amenities…
Taxation est. · year 1
- Rental income
- $12,773
- − Mortgage interest
- −$15,119
- − Property taxes
- −$1,134
- − Insurance
- −$1,350
- − Repairs & maintenance
- −$1,022
- − Management
- −$1,022
- − Depreciation
- −$7,852
- Taxable loss
- −$14,724
- Est. tax savings @ 24.0%
- +$3,534
- After-tax cash flow
- $-5,843/yr
For passive investors: Depreciation is non-cash, so a rental often shows a tax loss while cash-flowing — sheltering income. Rental losses are passive: they offset passive income freely, and up to $25,000/yr can offset ordinary (W-2) income if you actively participate and your MAGI is under $100k (phasing out to $0 by $150k); unused losses carry forward. On sale, claimed depreciation is recaptured at up to 25%, and gains may owe capital-gains tax (a 1031 exchange can defer both). Figures are a year-1 estimate at your 24.0% rate — not tax advice; consult a CPA.
Schools (NCES district)
- District
- Seymour R-II
- NCES district ID
- 2927930
- Math proficiency
- 28% ▲ 3.00%
- Reading proficiency
- 43% ▼ -1.00%
- Median HH income
- $38,134
- Composite
- 29.57/100
- National rank
- #6485
- State rank
- #218 of 324 in MO
Livability — Seymour
- Score
- 62/100
- State rank
- #374
- US rank
- #16499
Category grades
Schools grade is shown separately in the Schools card above.
Census & demographics
- Population (ZIP)
- 8,302
Population outlook (Webster County) Hauer SSP2
- Today (2025)
- 39,400 people
- By 2030
- 40,125 · +1.8%
- By 2040
- 41,169 · +4.5%
- By 2050
- 41,286 · +4.8%
- By 2075
- 40,104 · +1.8%
- By 2100
- 33,683 · -14.5%
Race, ethnicity, and origin ACS 2023
- Neighborhood character
- Predominantly White (92%)
- Race & ethnicity
- White 92% Hispanic / Latino 3% Two or more races 2%
- Common ancestry
- Slovak 2% Portuguese 2% Iranian 2%
- Foreign-born
- 1% · Canada
- Languages at home
- 76% English-only · German/W. Germanic 23% Other Asian/Pacific 1% Spanish 1%
Political lean MEDSL · Webster
- 2024 margin
- Solid R (+62.2) · D 18.4% · R 80.7%
- 2008→2024 swing
- -33.2pp toward R · 2008: -29.0pp · 2024: -62.2pp
- All cycles
- 2024: R+62.2 2020: R+60.2 2016: R+57.9 2012: R+40.8 2008: R+29.0
Not yet ingested
- Civics
- —
Market trends
- HPI YoY
- ▲ 9.54%
- Current HPI
- 272.7643
- Rent YoY
- —
- Metro
- —
- State GDP YoY
- ▲ 1.84%
- F500 in state
- 20
Industry mix (Fortune 500 HQ in MO)
| Industry | F500 HQs | Revenue |
|---|---|---|
| Healthcare | 1 | $163B |
|
||
| Insurance | 1 | $21B |
|
||
| Industrial Technology | 1 | $17B |
|
||
| Retail | 1 | $16B |
|
||
| Industrial Distribution | 1 | $10B |
|
||
| Utilities | 1 | $9B |
|
||
Price history
+134.9% since first listed17 events — show timeline
- 2026-01-19 Listed $269,900 SOMO
- 2023-08-30 Relisted — SOMO
- 2023-08-30 Relisted — SOMO
- 2023-08-30 Relisted — SOMO
- 2023-08-08 Delisted — SOMO
- 2023-08-04 Delisted — SOMO
- 2023-08-02 Delisted — SOMO
- 2023-07-24 Listed $365,000 SOMO
- 2023-05-31 Listed $365,500 SOMO
- 2023-05-16 Price Changed $305,000 SOMO
- 2023-04-19 Listed $365,500 SOMO
- 2023-04-19 Listed $365,500 SOMO
- 2020-09-28 Sold (MLS) — SOMO
- 2020-05-13 Listed $184,900 SOMO
- 2017-04-23 Listed $157,500 SOMO
- 2014-08-08 Sold (MLS) — SOMO
- 2013-05-31 Listed $114,900 SOMO
Property tax history
+3.4%/yrLatest (2025): $1,134 · +7.3% YoY. Source: county tax records.
Cash-flow waterfall
monthlySold comps — $/sqft
last 12 mo · ≤1 miLoading sold comps…