2115 6th Avenue #86 Ave · Clarkston Heights-Vineland, WA
Flood risk 1/10 · Minimal
- FEMA flood zone
- X
- Chance of flooding over 30 yrs
- 0.0%
- Est. flood insurance / yr
- $507 – $1,088
Fire risk 3/10 · Minor
- Est. fire insurance / yr
- $604 – $1,122
Heat risk 4/10 · Minor
- Hot days now (above 100°F)
- 6 days/yr
- Hot days in 30 yrs
- 13 days/yr
Wind risk 1/10 · Minimal
- Chance of severe wind over 30 yrs
- —
Air-quality risk 8/10 · Major
- Unhealthy air days now
- 12 days/yr
- Unhealthy air days in 30 yrs
- 17 days/yr
Risk factors via First Street. Map © Google.
Why this score? — see what drove the C grade
The composite is a weighted blend of 9 inputs, each scored 0–100. Each bar is that input's sub-score; the figure is the points it added to the 100-point composite (weight × sub-score).
- Cash flow +30.0/30.0
- DSCR +10.0/10.0
- 1% rule +8.2/10.0
- Schools +4.2/10.0
- Rent growth +2.5/5.0
- Livability +2.5/5.0
- Condition / age +2.5/5.0
- ARV discount +0.0/15.0
- Appreciation +0.0/10.0
$98,000
🖨 Deal sheet 📄 Offer letter ✓ Due diligence
Listing remarks MLS
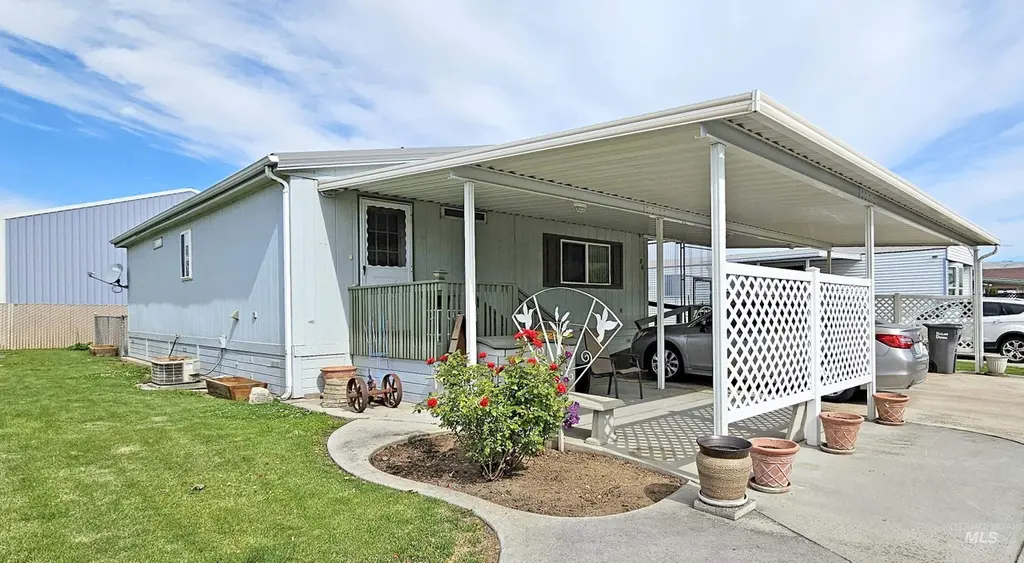
Nice 3 bedroom, two bath with fenced yard. Storage shed and home are newly painted. Lovely front patio with two covered parking spaces. Ramp entry to Northside door. 55+ community w/ a community pool!
Key facts
- Fenced yard space
- 2 garage spots
- Community pool
Tags
Property features AI
Finance
- HOA & community: Over-55 (senior) community; Community pool
Exterior
- Parking: 2 covered parking spaces (carport); 2 total parking spaces; 2-car garage available
- Utilities: City water service; Sewer connected
- Home design: Mobile/manufactured home on a rented lot; Built in 1995
- Construction: Metal roof
- Exterior features: Partial metal fencing; Covered patio/deck; Community pool; Storage shed; Automatic sprinkler system; Located in a mobile home park within an Over-55 community; Small lot
Interior
- Kitchen: Dishwasher; Freestanding oven/range; Refrigerator
- Bedrooms: 3 bedrooms, all on the main level
- Bathrooms: 2 bathrooms
- Heating & cooling: Electric forced-air heating; Central air conditioning
- Interior features: Master bedroom on main level; Split bedroom layout; Laminate countertops; Bathroom grab bars
- Laundry & utility: Washer; Dryer; Electric water heater
Neighborhood map
What this means for you Summary
Snapshot
- This is a 3-bed/2.0-bath manufactured listed at $98k.
Deal economics
- At list price, monthly cash flow is $399 ($5k/yr) — positive.
- The deal already cash-flows at list — no discount required.
- Meets the 1% rule at list price ($1k rent vs $98k).
- Cap rate 11.2% vs local median 1.4% in Clarkston Heights-Vineland — top-decile yield for the area; either an underpriced asset or a hidden risk that comps aren't pricing in. Stress-test before assuming the spread holds.
Location & tenants
- Location reads: area grade C — affects rentability + tenant quality, not the cash-flow math above.
- Clarkston School District (suburban): math 38% / reading 57% proficiency, ranked #172 of 291 in WA (top 59%) — families likely to look elsewhere, expect single-tenant / working-renter base with shorter leases.
- Zoned schools: Highland Elementary (288 students, 73% FRL) — zoned schools average 73% FRL vs 51% district-wide (22 pts higher); higher-poverty schools than district average — tighter screening recommended.
- Market conditions: 249 active listings in the ZIP; 101 units permitted in Asotin County in 2024 (72 in 5+ unit buildings).
Forward outlook
- Local home prices are declining (-3.0%/yr); year-one equity from $678 of loan paydown is wiped out by about $3k of value loss. Plan a longer hold.
- Asotin County population projected to shrink 3% by 2050 — rents likely to lag national; underwrite the cash flow, not the appreciation.
- At projected returns (-3.0% appreciation + 3.0% rent growth), your $27k cash investment doubles in ~7 years — after that, you're playing with house money.
Negotiation context
- Only 12 days on market — expect competitive offers; lowballing is unlikely to land.
- 2 sale attempts since 4y ago with the ask held roughly flat each time — persistent listings suggest the price (not the market) is what's stuck; bring a comps-based counter.
Questions for the listing agent
- Is there a deadline driving the sale (1031 exchange, divorce, estate, relocation)? That informs how much negotiation room exists.
- What's the average days-on-market for RENTAL listings here right now (not sales)? A rising rental-DOM trend means longer vacancies and softer asking-rent achievability than the comps imply.
- What's the recent tenant-quality profile in this submarket — average credit score on applications, eviction rate, late-payment / NSF rate, and stable-employment percentage? A property-management company in the area should have these aggregated.
- How much new for-sale + rental construction is in the pipeline within 1–3 miles? Heavy new supply typically softens prices + rents 12–24 months out; constrained supply supports both.
Investment metrics
- 1% rule
- 1.32% ✓
- Cap rate
- 11.18%
- Cash-on-cash
- 17.46%
- DSCR
- 1.78
- GRM
- 6.3
CMA / ARV
- ARV (on-the-fly)
- $73,840
- Comps found
- 12
Show comp detail 12 sales within ~0.75 mi
| Address | Dist | Beds/Ba | Sqft | Sold | Price | $/sf | Match |
|---|---|---|---|---|---|---|---|
| 2115 6th Ave #51 | 0.00mi | 3/2.0 | 1,144 (+10%) | 0mo | $134,000 | $117 | 83 |
| 2015 6th Ave #319 | 0.11mi | 3/2.0 | 980 (-6%) | 4mo | $69,500 | $71 | 82 |
| 2015 6th Ave #141 | 0.11mi | 3/1.5 | 1,094 (+5%) | 5mo | $49,900 | $46 | 80 |
| 2015 6th Ave Unit 131A | 0.11mi | 3/2.0 | 1,150 (+11%) | 1mo | $75,000 | $65 | 76 |
| 2115 6th Ave #14 | 0.00mi | 3/2.0 | 1,152 (+11%) | 16mo | $89,900 | $78 | 69 |
| 2015 6th Ave Unit 141A | 0.11mi | 3/2.0 | 1,094 (+5%) | 22mo | $47,900 | $44 | 68 |
| 2015 6th Ave Unit 310C | 0.11mi | 2/2.0 (-1) | 924 (-11%) | 9mo | $59,000 | $64 | 64 |
| 2015 6th Ave Unit 142 A | 0.11mi | 3/2.0 | 1,179 (+13%) | 11mo | $145,000 | $123 | 63 |
| 2515 Appleside Blvd #2 | 0.35mi | 3/2.0 | 960 (-8%) | 12mo | $55,000 | $57 | 61 |
| 2015 6th Ave Unit 306C | 0.11mi | 3/2.0 | 1,144 (+10%) | 22mo | $175,000 | $153 | 60 |
| 2115 6th Ave #54 | 0.00mi | 2/2.0 (-1) | 900 (-14%) | 20mo | $149,900 | $167 | 56 |
| 2015 6th Ave 126a Unit 126A | 0.11mi | 3/2.0 | 910 (-12%) | 24mo | $39,900 | $44 | 54 |
Match score weights: distance 35% · size 25% · config 20% · recency 20%. Top-matched comps best support the ARV.
Projected returns pro-forma
-3.0% appreciation · 3.0% rent growth · sell at horizon
- IRR
- 8.8%
- Equity multiple
- 1.35×
- Total profit
- $9,534
- Equity at exit
- $14,612
- IRR
- 18.0%
- Equity multiple
- 2.49×
- Total profit
- $40,983
- Equity at exit
- $8,473
Cash invested: $27,440 (down + closing). Projections, not guarantees.
Landlord ↔ Tenant lean methodology
- Overall (STATE)
- 28 Tenant-Leaning
- State Washington
- 28 Tenant-Leaning · D+8
- County
- — inherits STATE
- City
- — inherits STATE
ZIP-level market 99403
- Active inventory
- 249
- Price-to-rent
- 6.3×
Monthly cashflow live
- Estimated rent
- $1,290 medium interval (Pro) →
- Mortgage (P&I)
- −$514
- Tax from tax record
- −$65 /mo · $776/yr
- Insurance
- −$41
- HOA
- −$0
- Vacancy / Maint / Mgmt
- −$271
- Net cashflow
- $399
Break-even live
UW: 25.0% down · 7.5% · 30yr · 1.5% tax · 5.0% vac · 8.0% maint · 8.0% mgmt
Financing live
Cash to close
- Down payment
- $24,500
- Closing costs
- $2,940
- Reserves months
- —
- Total cash needed
- —
Loan-product check · same deal, 3 products live
Conventional
25% down · 7.5% · 30yr
- Down + closing
- —
- Monthly P&I
- —
- Monthly cashflow
- —
- DSCR
- —
- Eligible?
- —
Personal DTI + credit; lowest rate.
DSCR
20% down · 8.5% · 30yr
- Down + closing
- —
- Monthly P&I
- —
- Monthly cashflow
- —
- DSCR
- —
- Eligible?
- —
No personal income docs; deal must DSCR.
Hard money
10% down · 12.0% · 12mo
- Down + closing
- —
- Monthly P&I
- —
- Monthly cashflow
- —
- DSCR
- —
- Eligible?
- —
Short-term bridge; refi at stabilization.
Listing history 11 events
-
2026-06-17status $98,000 Pending 12 DOM
-
2026-06-17days on market $98,000 Active 12 DOM
-
2026-06-16days on market $98,000 Active 11 DOM
-
2026-06-15days on market $98,000 Active 10 DOM
-
2026-06-14days on market $98,000 Active 8 DOM
-
2026-06-12days on market $98,000 Active 7 DOM
-
2026-06-09days on market $98,000 Active 4 DOM
-
2026-06-09remarks 604-char remark
-
2026-06-08days on market $98,000 Active 3 DOM
-
2026-06-07remarks 505-char remark
-
2026-06-07$98,000 Active 2 DOM
ⓘ Source: listings_history table (triggers on properties + properties_extension) + one-shot
backfill from property_details.listing_events for pre-trigger history.
Tax reassessment forecast WA · Resets to sale price
- Current annual tax
- $776 · $65/mo
- Projected year-2 tax
- $960 · $80/mo
- Expected delta
- +$184/yr (+$15/mo · 23.7%)
ⓘ Screening estimate from a state-policy table — verify with the county assessor before closing.
Climate risk First Street
- Flood 1/10 Low FEMA zone X · 0% chance over 30 yrs
- Wildfire 3/10 Moderate
- Heat 4/10 Moderate 6 d/yr ≥100°F today · 13 d/yr by 30 yrs out
- Wind 1/10 Low
- Air quality 8/10 Severe 12 unhealthy d/yr today · 17 by 30 yrs out
Nearby sold comps map
Loading sold comps map…
Walkable amenities ~0.75 mi
Loading nearby amenities…
Taxation est. · year 1
- Rental income
- $15,474
- − Mortgage interest
- −$5,490
- − Property taxes
- −$776
- − Insurance
- −$490
- − Repairs & maintenance
- −$1,238
- − Management
- −$1,238
- − Depreciation
- −$2,851
- Taxable income
- $3,392
- Est. tax owed @ 24.0%
- −$814
- After-tax cash flow
- $3,977/yr
For passive investors: Depreciation is non-cash, so a rental often shows a tax loss while cash-flowing — sheltering income. Rental losses are passive: they offset passive income freely, and up to $25,000/yr can offset ordinary (W-2) income if you actively participate and your MAGI is under $100k (phasing out to $0 by $150k); unused losses carry forward. On sale, claimed depreciation is recaptured at up to 25%, and gains may owe capital-gains tax (a 1031 exchange can defer both). Figures are a year-1 estimate at your 24.0% rate — not tax advice; consult a CPA.
Schools (NCES district)
- District
- Clarkston School District
- NCES district ID
- 5301320
- Math proficiency
- 38% ▼ -4.00%
- Reading proficiency
- 57% ▲ 1.00%
- Median HH income
- $42,030
- Composite
- 42.03/100
- National rank
- #7065
- State rank
- #172 of 291 in WA
Livability — Clarkston Heights-Vineland
No livability data for this city. (Only ~50 U.S. cities are tracked.)
Census & demographics
- Census place
- Clarkston Heights-Vineland, WA
- Population (ZIP)
- 20,483
Population outlook (Asotin County) Hauer SSP2
- Today (2025)
- 22,623 people
- By 2030
- 22,746 · +0.5%
- By 2040
- 22,597 · -0.1%
- By 2050
- 21,947 · -3.0%
- By 2075
- 19,478 · -13.9%
- By 2100
- 16,206 · -28.4%
Race, ethnicity, and origin ACS 2023
- Neighborhood character
- Predominantly White (87%)
- Race & ethnicity
- White 87% Two or more races 6% Hispanic / Latino 5% Native American 1% Asian 1%
- Common ancestry
- Portuguese 3% Lithuanian 2% Slovak 2%
- Foreign-born
- 2% · Canada
- Languages at home
- 97% English-only · Spanish 2% Tagalog/Filipino 1%
Political lean MEDSL · Asotin
- 2024 margin
- Strong R (+25.6) · D 35.8% · R 61.5% · Other 2.7%
- 2008→2024 swing
- -12.2pp toward R · 2008: -13.4pp · 2024: -25.6pp
- All cycles
- 2024: R+25.6 2020: R+25.7 2016: R+26.8 2012: R+16.7 2008: R+13.4
Not yet ingested
- Civics
- —
Market trends
- HPI YoY
- ▼ -346.91%
- Current HPI
- 173.3027
- Rent YoY
- —
- Metro
- —
- State GDP YoY
- ▲ 4.65%
- F500 in state
- 22
Industry mix (Fortune 500 HQ in WA)
| Industry | F500 HQs | Revenue |
|---|---|---|
| Retail | 2 | $269B |
|
||
| Technology / Retail | 1 | $638B |
|
||
| Technology | 1 | $245B |
|
||
| Telecommunications | 1 | $38B |
|
||
| Food / Beverage | 1 | $36B |
|
||
| Automotive / Trucks | 1 | $34B |
|
||
Price history
+14.0% since first listed4 events — show timeline
- 2026-06-03 Listed $98,000 IMLS
- 2022-04-22 Sold (MLS) — IMLS
- 2022-03-13 Pending — IMLS
- 2022-03-08 Listed $85,999 IMLS
Property tax history
+11.1%/yrLatest (2025): $776 · +70.6% YoY. Source: county tax records.
Cash-flow waterfall
monthlySold comps — $/sqft
last 12 mo · ≤1 miLoading sold comps…