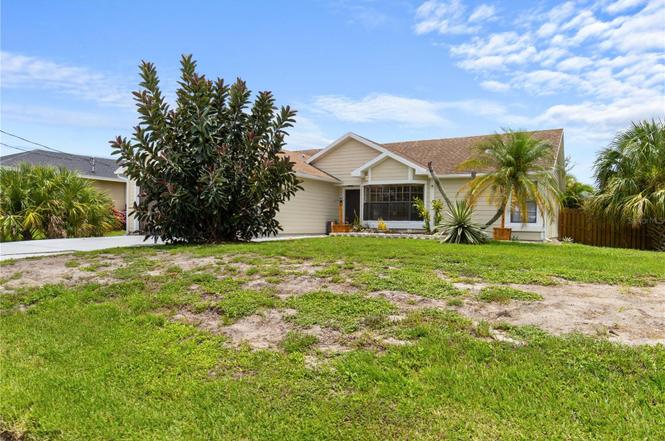
1921 SW Granello Ter · Port St. Lucie, FL
Flood risk 1/10 · Minimal
- FEMA flood zone
- X (unshaded)
- Chance of flooding over 30 yrs
- 0.0%
- Est. flood insurance / yr
- $507 – $1,088
Fire risk 1/10 · Minimal
- Est. fire insurance / yr
- $947 – $1,759
Heat risk 10/10 · Severe
- Hot days now (above 106°F)
- 7 days/yr
- Hot days in 30 yrs
- 22 days/yr
Wind risk 10/10 · Severe
- Chance of severe wind over 30 yrs
- 99.0%
Air-quality risk 1/10 · Minimal
- Unhealthy air days now
- 0 days/yr
- Unhealthy air days in 30 yrs
- 0 days/yr
Risk factors via First Street. Map © Google.
Why this score? — see what drove the D+ grade
The composite is a weighted blend of 9 inputs, each scored 0–100. Each bar is that input's sub-score; the figure is the points it added to the 100-point composite (weight × sub-score).
- ARV discount +15.0/15.0
- Cash flow +13.8/30.0
- 1% rule +4.4/10.0
- DSCR +4.2/10.0
- Schools +3.7/10.0
- Rent growth +2.6/5.0
- Livability +2.5/5.0
- Condition / age +2.5/5.0
- Appreciation +0.0/10.0
$280,000
🖨 Deal sheet 📄 Offer letter ✓ Due diligence
Listing remarks MLS
TAKE A LOOK AT THIS! NICE 3/2/2 HOME - 2016 ROOF. OPEN LAYOUT WITH ROOMY EAT IN KITCHEN, PLENTY OF CABINETS. SPACIOUS MASTER WITH PLANTATION SHUTTERS.. TILE FLOORS IN MAIN AREAS. HI TECH WASHER/DRYER. COVERED AND SCREENED LANAI, FENCED YARD. HURRICANE SHUTTERS. CHECK IT OUT!
Key facts
- Open floor plan
- Natural light
- Vaulted ceilings
Tags
Neighborhood map
What this means for you Summary
Snapshot
- This is a 3-bed/2.0-bath single-family listed at $280k.
Deal economics
- At list price, monthly cash flow is $24 ($290/yr) — positive.
- The deal already cash-flows at list — no discount required.
- To meet the 1% rule (rent ≥ 1% of price), the offer needs to be $262k (6.3% below list).
- Recommended offer: $246k (12.0% below list) — sets the bar for market timing.
- Cap rate 6.4% vs local median 3.9% in Port St. Lucie — top-decile yield for the area; either an underpriced asset or a hidden risk that comps aren't pricing in. Stress-test before assuming the spread holds.
Location & tenants
- Location reads: area grade D — affects rentability + tenant quality, not the cash-flow math above.
- St. Lucie (urban): math 40% / reading 48% proficiency, ranked #51 of 73 in FL (top 70%) — families likely to look elsewhere, expect single-tenant / working-renter base with shorter leases.
- Market conditions: Rents flat; 758 active listings in the ZIP; 23 comparable units currently listed for rent nearby; rentals at typical pace (median 24d on market — plan ~3-4 weeks tenant-placement turnaround); solid renter incomes; 4,868 units permitted in St. Lucie County in 2024 (268 in 5+ unit buildings).
- This rent runs 37% of the median local income ($86k/yr) — at the standard rent-burdened threshold; future hikes will face affordability resistance.
Forward outlook
- Local home prices are declining (-3.0%/yr); year-one equity from $2k of loan paydown is wiped out by about $8k of value loss. Plan a longer hold.
- St. Lucie County population projected at +20% by 2050 — long-run rental-demand tailwind backs the buy-and-hold thesis.
Negotiation context
- It's been on market 243 days — a 12% lower offer ($246k) is reasonable based on typical stale-listing flexibility.
- 7 sale attempts since 21y ago; this cycle's ask has dropped $65k (19%) from the opening price — seller is motivated, your offer sets the floor, not the list.
Risks & watch-outs
- Climate carrying-cost: severe wind risk, 99% chance of damaging wind over 30y; extreme-heat days projected 7→22/yr by 2055 (HVAC capex compounding) — expect insurance premiums to compound above CPI over the hold.
Questions for the listing agent
- It's been on market 243 days. Have you received any prior offers? Is the seller open to a 12% concession, seller financing, or rate buy-down credit?
- Why hasn't it sold? Are there any deal-killer items the seller is aware of (foundation, flood, title, zoning, code violations)?
- Is there a deadline driving the sale (1031 exchange, divorce, estate, relocation)? That informs how much negotiation room exists.
- The area grade is low — what's the realistic commute time and amenity access for the typical tenant pool here? Any planned neighborhood developments (good or bad) we should know about?
- What's the average days-on-market for RENTAL listings here right now (not sales)? A rising rental-DOM trend means longer vacancies and softer asking-rent achievability than the comps imply.
- What's the recent tenant-quality profile in this submarket — average credit score on applications, eviction rate, late-payment / NSF rate, and stable-employment percentage? A property-management company in the area should have these aggregated.
- How much new for-sale + rental construction is in the pipeline within 1–3 miles? Heavy new supply typically softens prices + rents 12–24 months out; constrained supply supports both.
Investment metrics
- 1% rule
- 0.94% ✗
- Cap rate
- 6.40%
- Cash-on-cash
- 0.37%
- DSCR
- 1.02
- GRM
- 8.9
CMA / ARV
- ARV (on-the-fly)
- $344,892
- Comps found
- 12
Show comp detail 12 sales within ~0.75 mi
| Address | Dist | Beds/Ba | Sqft | Sold | Price | $/sf | Match |
|---|---|---|---|---|---|---|---|
| 1966 SW Lennox St | 0.23mi | 3/2.0 | 1,552 (+11%) | 19mo | $382,000 | $246 | 56 |
| 1801 SW Beeker St | 0.60mi | 3/2.0 | 1,284 (-8%) | 7mo | $305,000 | $238 | 52 |
| 1834 SW Davis St | 0.44mi | 3/2.0 | 1,528 (+9%) | 17mo | $365,000 | $239 | 51 |
| 2074 SW Certosa Rd | 0.41mi | 3/2.0 | 1,246 (-11%) | 17mo | $400,000 | $321 | 48 |
| 1801 SW Leafy | 0.29mi | 4/2.0 (+1) | 1,587 (+13%) | 14mo | $318,000 | $200 | 48 |
| 2026 SW Ember St | 0.60mi | 3/2.0 | 1,452 (+4%) | 22mo | $410,000 | $282 | 47 |
| 647 SW Andros Cir | 0.75mi | 2/2.0 (-1) | 1,468 (+5%) | 7mo | $335,000 | $228 | 46 |
| 1981 SW Delmonico Ave | 0.29mi | 3/2.0 | 1,582 (+13%) | 23mo | $395,000 | $250 | 46 |
| 2025 SW Driftwood St | 0.74mi | 3/2.0 | 1,569 (+12%) | 6mo | $440,000 | $280 | 41 |
| 1702 SW Boeing St | 0.66mi | 4/2.0 (+1) | 1,568 (+12%) | 5mo | $318,200 | $203 | 41 |
| 1731 SW Bonanza St | 0.59mi | 3/2.0 | 1,544 (+10%) | 23mo | $364,000 | $236 | 37 |
| 2225 SW Trapp Ter | 0.60mi | 3/2.0 | 1,240 (-12%) | 23mo | $410,000 | $331 | 34 |
Match score weights: distance 35% · size 25% · config 20% · recency 20%. Top-matched comps best support the ARV.
Projected returns pro-forma
-3.0% appreciation · 0.22% rent growth · sell at horizon
- IRR
- -19.0%
- Equity multiple
- 0.35×
- Total profit
- $-50,864
- Equity at exit
- $41,749
- IRR
- -19.1%
- Equity multiple
- 0.11×
- Total profit
- $-69,582
- Equity at exit
- $24,209
Cash invested: $78,400 (down + closing). Projections, not guarantees.
Landlord ↔ Tenant lean methodology
- Overall (STATE)
- 87 Strongly Landlord-Friendly
- State Florida
- 87 Strongly Landlord-Friendly · R+3
- County
- — inherits STATE
- City
- — inherits STATE
ZIP-level market 34953
- Home prices YoY
- -10.1%
- Rents YoY
- 0.2%
- Active inventory
- 758
- Price-to-rent
- 8.9×
Monthly cashflow live
- Estimated rent
- $2,624 high interval (Pro) →
- Mortgage (P&I)
- −$1,468
- Tax from tax record
- −$464 /mo · $5,565/yr
- Insurance
- −$117
- HOA
- −$0
- Vacancy / Maint / Mgmt
- −$551
- Net cashflow
- $24
Break-even live
UW: 25.0% down · 7.5% · 30yr · 1.5% tax · 5.0% vac · 8.0% maint · 8.0% mgmt
Financing live
Cash to close
- Down payment
- $70,000
- Closing costs
- $8,400
- Reserves months
- —
- Total cash needed
- —
Loan-product check · same deal, 3 products live
Conventional
25% down · 7.5% · 30yr
- Down + closing
- —
- Monthly P&I
- —
- Monthly cashflow
- —
- DSCR
- —
- Eligible?
- —
Personal DTI + credit; lowest rate.
DSCR
20% down · 8.5% · 30yr
- Down + closing
- —
- Monthly P&I
- —
- Monthly cashflow
- —
- DSCR
- —
- Eligible?
- —
No personal income docs; deal must DSCR.
Hard money
10% down · 12.0% · 12mo
- Down + closing
- —
- Monthly P&I
- —
- Monthly cashflow
- —
- DSCR
- —
- Eligible?
- —
Short-term bridge; refi at stabilization.
Rent comps 23 comps
| Address | Beds | Baths | Sqft | Rent | $/sqft | DOM | Units | Dist |
|---|---|---|---|---|---|---|---|---|
| 1773 SW Cannon Ave Port Saint Lucie, FL | 4.0 | 2.0 | 1833 | $2,336 | $1.27 | 14d | 1 | 0.40mi |
| 1829 SW California Blvd Port Saint Lucie, FL | 3.0 | 2.0 | 1412 | $2,116 | $1.50 | 23d | 1 | 0.44mi |
| 1813 SW Altman Ave Port Saint Lucie, FL | 3.0 | 2.0 | 912 | $2,200 | $2.41 | 14d | 1 | 0.45mi |
| 1902 SW Aladdin St Port St Lucie, FL | 3.0 | 2.0 | 1383 | $2,350 | $1.70 | 23d | 1 | 0.51mi |
| 1402 SW Crest Ave Port Saint Lucie, FL | 4.0 | 2.0 | 1827 | $2,495 | $1.37 | 23d | 1 | 0.72mi |
| 2325 SW Pamona St Port Saint Lucie, FL | 2.0 | 1.0 | 912 | $1,900 | $2.08 | 14d | 1 | 0.86mi |
| 1280 SW Jacqueline Ave #1280 Port St. Lucie, FL | 3.0 | 2.0 | 1416 | $3,000 | $2.12 | 23d | 1 | 0.87mi |
| 1331 SW Bellevue Ave Port Saint Lucie, FL | 3.0 | 2.0 | 1328 | $2,249 | $1.69 | 23d | 1 | 0.91mi |
| 708 SW Saint Vincent Cv Port St Lucie, FL | 2.0 | 2.0 | 1327 | $2,200 | $1.66 | 14d | 1 | 0.91mi |
| 2073 SW Capeador St Port Saint Lucie, FL | 3.0 | 2.0 | 1250 | $2,500 | $2.00 | 23d | 1 | 0.91mi |
| 788 SW Munjack Cir Port Saint Lucie, FL | 2.0 | 2.0 | 1672 | $2,500 | $1.50 | 23d | 1 | 0.92mi |
| 615 SW Saint Thomas Cv Port Saint Lucie, FL | 3.0 | 2.0 | 1672 | $2,600 | $1.56 | 14d | 1 | 0.97mi |
| 1292 SW Bellevue Ave Port Saint Lucie, FL | 3.0 | 2.0 | 1200 | $2,300 | $1.92 | 14d | 1 | 0.98mi |
| 1341 SW Oriole Ln Port Saint Lucie, FL | 3.0 | 2.0 | 1698 | $2,300 | $1.35 | 23d | 1 | 1.05mi |
| 839 SW Munjack Cir Port Saint Lucie, FL | 3.0 | 3.0 | 1863 | $3,350 | $1.80 | 14d | 1 | 1.06mi |
| 2547 SW Kenilworth St Port Saint Lucie, FL | 3.0 | 2.0 | 1674 | $2,500 | $1.49 | 14d | 1 | 1.23mi |
| 2526 SW Savage Blvd Port Saint Lucie, FL | 3.0 | 2.0 | 1827 | $2,600 | $1.42 | 23d | 1 | 1.23mi |
| 2542 SW Kensington St Port Saint Lucie, FL | 3.0 | 2.0 | 1470 | $3,200 | $2.18 | 14d | 1 | 1.28mi |
| 2217 SW Halissee St Port Saint Lucie, FL | 3.0 | 2.0 | 1410 | $2,500 | $1.77 | 23d | 1 | 1.30mi |
| 2248 SW Halissee St Port Saint Lucie, FL | 3.0 | 2.0 | 1383 | $2,500 | $1.81 | 21d | 1 | 1.33mi |
| 1080 SW Colorado Ave Port Saint Lucie, FL | 3.0 | 2.0 | 1240 | $2,150 | $1.73 | 23d | 1 | 1.36mi |
| 726 SW Aruba Bay Port Saint Lucie, FL | 3.0 | 2.0 | 1409 | $2,850 | $2.02 | 23d | 1 | 1.46mi |
| 726 SW Aruba Bay Port Saint Lucie, FL | 3.0 | 2.0 | 1409 | $2,850 | $2.02 | 21d | 1 | 1.46mi |
Listing history 30 events
-
2026-04-01status Pending
-
2026-03-20price $280,000
-
2026-03-06price $290,000
-
2026-02-12price $300,000
-
2026-01-23price $310,000
-
2026-01-08price $320,000
-
2025-12-09status Active
-
2025-12-09price $330,000
-
2025-11-24status Pending
-
2025-09-23price $294,800
-
2025-09-05price $300,000
-
2025-08-14price $325,000
-
2025-07-17$345,000 Active
-
2022-09-07soldstatus $335,000
-
2022-09-02soldstatus $335,000 Closed 281-char remark
Show marketing remark (281 chars)
TAKE A LOOK AT THIS! NICE 3/2/2 HOME - 2016 ROOF. OPEN LAYOUT WITH ROOMY EAT IN KITCHEN, PLENTY OF CABINETS. SPACIOUS MASTER WITH PLANTATION SHUTTERS.. TILE FLOORS IN MAIN AREAS. HI TECH WASHER/DRYER. COVERED AND SCREENED LANAI, FENCED YARD. HURRICANE SHUTTERS. CHECK IT OUT!
-
2022-08-03status Pending 281-char remark
Show marketing remark (281 chars)
TAKE A LOOK AT THIS! NICE 3/2/2 HOME - 2016 ROOF. OPEN LAYOUT WITH ROOMY EAT IN KITCHEN, PLENTY OF CABINETS. SPACIOUS MASTER WITH PLANTATION SHUTTERS.. TILE FLOORS IN MAIN AREAS. HI TECH WASHER/DRYER. COVERED AND SCREENED LANAI, FENCED YARD. HURRICANE SHUTTERS. CHECK IT OUT!
-
2022-08-02price $335,000 281-char remark
Show marketing remark (281 chars)
TAKE A LOOK AT THIS! NICE 3/2/2 HOME - 2016 ROOF. OPEN LAYOUT WITH ROOMY EAT IN KITCHEN, PLENTY OF CABINETS. SPACIOUS MASTER WITH PLANTATION SHUTTERS.. TILE FLOORS IN MAIN AREAS. HI TECH WASHER/DRYER. COVERED AND SCREENED LANAI, FENCED YARD. HURRICANE SHUTTERS. CHECK IT OUT!
-
2022-07-29$329,888 Active 281-char remark
Show marketing remark (281 chars)
TAKE A LOOK AT THIS! NICE 3/2/2 HOME - 2016 ROOF. OPEN LAYOUT WITH ROOMY EAT IN KITCHEN, PLENTY OF CABINETS. SPACIOUS MASTER WITH PLANTATION SHUTTERS.. TILE FLOORS IN MAIN AREAS. HI TECH WASHER/DRYER. COVERED AND SCREENED LANAI, FENCED YARD. HURRICANE SHUTTERS. CHECK IT OUT!
-
2014-10-07historical
-
2013-09-22historical
-
2008-12-31soldstatus $85,000
-
2008-12-29soldstatus $85,000
-
2008-10-31historical
-
2008-10-25$79,000
-
2008-04-29$89,900
-
2006-03-07soldstatus $215,000
-
2006-02-24soldstatus $215,000
-
2006-01-30historical
-
2006-01-07$219,900
-
2005-07-13$219,198
ⓘ Source: listings_history table (triggers on properties + properties_extension) + one-shot
backfill from property_details.listing_events for pre-trigger history.
Tax reassessment forecast FL · Resets to sale price
- Current annual tax
- $5,565 · $464/mo
- Projected year-2 tax
- $5,565 · $464/mo
- Expected delta
- $0/yr ($0/mo · 0.0%)
ⓘ Screening estimate from a state-policy table — verify with the county assessor before closing.
Climate risk First Street
- Flood 1/10 Low FEMA zone X (unshaded) · 0% chance over 30 yrs
- Wildfire 1/10 Low
- Heat 10/10 Extreme 7 d/yr ≥106°F today · 22 d/yr by 30 yrs out
- Wind 10/10 Extreme 99% chance of damaging wind over 30 yrs
- Air quality 1/10 Low 0 unhealthy d/yr today · 0 by 30 yrs out
Nearby sold comps map
Loading sold comps map…
Walkable amenities ~0.75 mi
Loading nearby amenities…
Taxation est. · year 1
- Rental income
- $31,488
- − Mortgage interest
- −$15,684
- − Property taxes
- −$5,565
- − Insurance
- −$1,400
- − Repairs & maintenance
- −$2,519
- − Management
- −$2,519
- − Depreciation
- −$8,145
- Taxable loss
- −$4,345
- Est. tax savings @ 24.0%
- +$1,043
- After-tax cash flow
- $1,333/yr
For passive investors: Depreciation is non-cash, so a rental often shows a tax loss while cash-flowing — sheltering income. Rental losses are passive: they offset passive income freely, and up to $25,000/yr can offset ordinary (W-2) income if you actively participate and your MAGI is under $100k (phasing out to $0 by $150k); unused losses carry forward. On sale, claimed depreciation is recaptured at up to 25%, and gains may owe capital-gains tax (a 1031 exchange can defer both). Figures are a year-1 estimate at your 24.0% rate — not tax advice; consult a CPA.
Schools (NCES district)
- District
- St. Lucie
- NCES district ID
- 1201770
- Math proficiency
- 40% ▼ -11.00%
- Reading proficiency
- 48% ▼ -4.00%
- Median HH income
- $44,737
- Composite
- 37.28/100
- National rank
- #4449
- State rank
- #51 of 73 in FL
Livability — Port St. Lucie
No livability data for this city. (Only ~50 U.S. cities are tracked.)
Census & demographics
- Census place
- Port St. Lucie, FL
- County
- Saint Lucie County · 337,150 people
- City population
- 221,051
- Metro
- Port St. Lucie, FL
- Population (ZIP)
- 86,875
- Household income
- $85,667
- Rent vs Own
- Severe rent burden
- 857.0
Population outlook (St. Lucie County) Hauer SSP2
- Today (2025)
- 338,016 people
- By 2030
- 355,687 · +5.2%
- By 2040
- 385,521 · +14.1%
- By 2050
- 406,106 · +20.1%
- By 2075
- 441,054 · +30.5%
- By 2100
- 436,885 · +29.2%
Race, ethnicity, and origin ACS 2023
- Neighborhood character
- Diverse neighborhood (Simpson 0.69)
- Race & ethnicity
- White 42% Hispanic / Latino 28% Black 23% Two or more races 15% Asian 2%
- Hispanic origin (detail)
- Mexican 2% Puerto Rican 8% Cuban 4% Dominican 3%
- Common ancestry
- Hispanic 4% Romanian 2% Estonian 2%
- Foreign-born
- 24% · Canada, Jamaica, China
- Languages at home
- 69% English-only · Spanish 19% French/Haitian/Cajun 6% Other Indo-European 3%
Political lean MEDSL · St. Lucie
- 2024 margin
- Lean R (+9.1) · D 45.1% · R 54.2%
- 2008→2024 swing
- -21.2pp toward R · 2008: 12.1pp · 2024: -9.1pp
- All cycles
- 2024: R+9.1 2020: R+1.6 2016: R+2.5 2012: D+7.9 2008: D+12.1
Not yet ingested
- Civics
- —
Market trends
- HPI YoY
- ▼ -44.19%
- Current HPI
- 392.7681
- Rent YoY
- ▲ 0.22%
- Metro
- Port St. Lucie, FL
- State GDP YoY
- ▲ 3.28%
- F500 in state
- 36
Industry mix (Fortune 500 HQ in FL)
| Industry | F500 HQs | Revenue |
|---|---|---|
| Industrial Technology | 2 | $29B |
|
||
| Insurance | 2 | $17B |
|
||
| Retail | 1 | $60B |
|
||
| Technology Distribution | 1 | $58B |
|
||
| Homebuilding | 1 | $35B |
|
||
| Technology Manufacturing | 1 | $35B |
|
||
Price history
+27.7% since first listed30 events — show timeline
- 2026-04-01 Pending — Stellar MLS as Distributed by MLS Grid
- 2026-03-20 Price Changed $280,000 Stellar MLS as Distributed by MLS Grid
- 2026-03-06 Price Changed $290,000 Stellar MLS as Distributed by MLS Grid
- 2026-02-12 Price Changed $300,000 Stellar MLS as Distributed by MLS Grid
- 2026-01-23 Price Changed $310,000 Stellar MLS as Distributed by MLS Grid
- 2026-01-08 Price Changed $320,000 Stellar MLS as Distributed by MLS Grid
- 2025-12-09 Relisted — Stellar MLS as Distributed by MLS Grid
- 2025-12-09 Price Changed $330,000 Stellar MLS as Distributed by MLS Grid
- 2025-11-24 Pending — Stellar MLS as Distributed by MLS Grid
- 2025-09-23 Price Changed $294,800 Stellar MLS as Distributed by MLS Grid
- 2025-09-05 Price Changed $300,000 Stellar MLS as Distributed by MLS Grid
- 2025-08-14 Price Changed $325,000 Stellar MLS as Distributed by MLS Grid
- 2025-07-17 Listed $345,000 Stellar MLS as Distributed by MLS Grid
- 2022-09-07 Sold (Public Records) $335,000 Public Records
- 2022-09-02 Sold (MLS) $335,000 Beaches MLS
- 2022-08-03 Pending — Beaches MLS
- 2022-08-02 Price Changed $335,000 Beaches MLS
- 2022-07-29 Listed $329,888 Beaches MLS
- 2014-10-07 Listing Removed — Beaches MLS
- 2013-09-22 Listing Removed — Beaches MLS
- 2008-12-31 Sold (Public Records) $85,000 Public Records
- 2008-12-29 Sold (MLS) $85,000 Beaches MLS
- 2008-10-31 Listing Removed — Beaches MLS
- 2008-10-25 Listed $79,000 Beaches MLS
- 2008-04-29 Listed $89,900 Beaches MLS
- 2006-03-07 Sold (Public Records) $215,000 Public Records
- 2006-02-24 Sold (MLS) $215,000 Beaches MLS
- 2006-01-30 Listing Removed — Beaches MLS
- 2006-01-07 Listed $219,900 Beaches MLS
- 2005-07-13 Listed $219,198 Beaches MLS
Property tax history
+12.9%/yrLatest (2025): $5,565 · -12.0% YoY. Source: county tax records.
Cash-flow waterfall
monthlySold comps — $/sqft
last 12 mo · ≤1 miLoading sold comps…