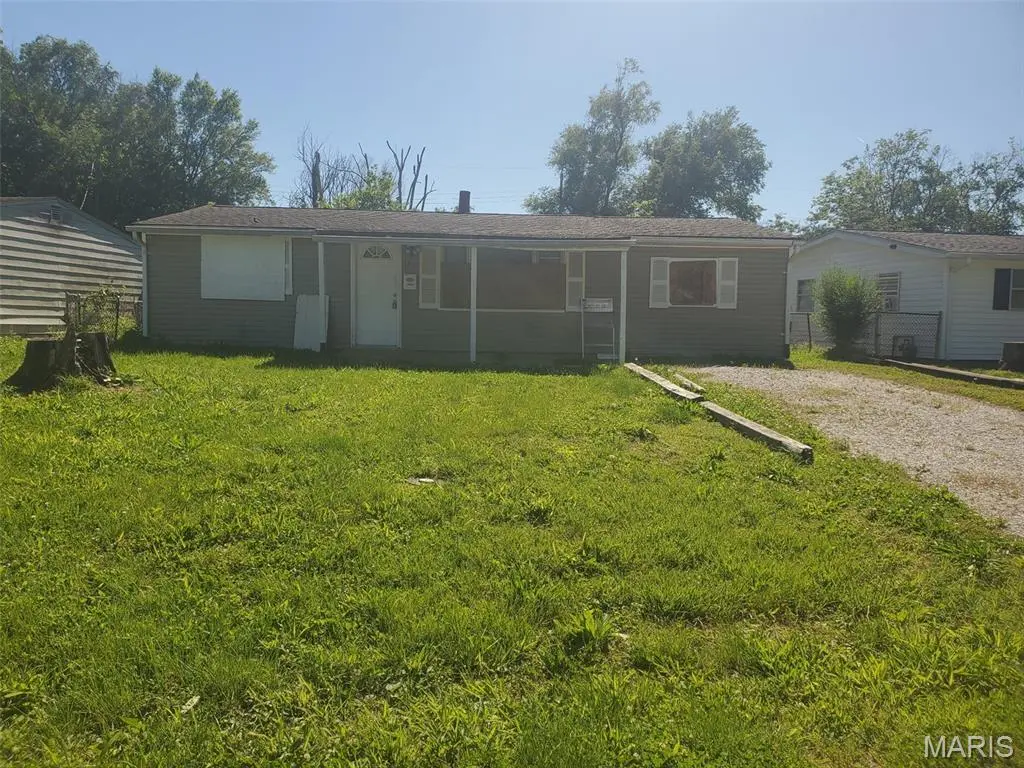
240 St John Dr · Cahokia Heights, IL
Flood risk 1/10 · Minimal
- FEMA flood zone
- X (shaded)
- Chance of flooding over 30 yrs
- 0.0%
- Est. flood insurance / yr
- $507 – $1,088
Fire risk 1/10 · Minimal
- Est. fire insurance / yr
- $804 – $1,492
Heat risk 5/10 · Moderate
- Hot days now (above 107°F)
- 7 days/yr
- Hot days in 30 yrs
- 21 days/yr
Wind risk 2/10 · Minimal
- Chance of severe wind over 30 yrs
- 1.0%
Air-quality risk 3/10 · Minor
- Unhealthy air days now
- 3 days/yr
- Unhealthy air days in 30 yrs
- 4 days/yr
Risk factors via First Street. Map © Google.
Why this score? — see what drove the B grade
The composite is a weighted blend of 9 inputs, each scored 0–100. Each bar is that input's sub-score; the figure is the points it added to the 100-point composite (weight × sub-score).
- Cash flow +30.0/30.0
- ARV discount +15.0/15.0
- 1% rule +10.0/10.0
- DSCR +10.0/10.0
- Rent growth +2.5/5.0
- Livability +2.5/5.0
- Condition / age +2.5/5.0
- Schools +0.6/10.0
- Appreciation +0.0/10.0
$78,500
🖨 Deal sheet 📄 Offer letter ✓ Due diligence
Listing remarks
Welcome Home! Home has fresh paint throughout. Huge backyard. Home is 1,201 SF, 4 bedrooms; 2 baths; living room; eat in kitchen; laundry room, huge fenced back yard and plenty of space; cul de sac. Property being Sold AS-IS, WHERE-IS. Seller to make no further repairs nor provide City Occupancy.
Key facts
- Fenced back yard
- Cul de sac
- Huge backyard
Tags
Property features AI
Exterior
- Parking: No dedicated parking or carport indicated
- Utilities: Public water; Public sewer; Electric service: Other
- Home design: Single-family residence; One story; Private ownership
- Construction: Shingle roof; Construction material: Other
- Exterior features: Back yard; Front yard; Chain-link fencing
Interior
- Kitchen: Kitchen on the main level
- Bedrooms: Four bedrooms (all on the main level)
- Bathrooms: Two full bathrooms (both on the main level)
- Heating & cooling: Natural gas heating with forced air; Central air plus wall/window unit(s)
- Interior features: Crawl space basement; No fireplace
- Laundry & utility: Main-level laundry room
Neighborhood map
What this means for you Summary
Snapshot
- This is a 4-bed/3.0-bath single-family listed at $78k.
Deal economics
- At list price, monthly cash flow is $673 ($8k/yr) — positive.
- The deal already cash-flows at list — no discount required.
- Meets the 1% rule at list price ($2k rent vs $78k).
- Recommended offer: $77k (1.5% below list) — sets the bar for market timing.
- Cap rate 16.6% vs local median 13.6% in Cahokia Heights — meaningfully above typical; check what's discounted (condition, days-on-market, listing class) to confirm the premium yield is real.
Location & tenants
- Location reads: area grade B — affects rentability + tenant quality, not the cash-flow math above.
- Cahokia CUSD 187 (suburban): math 3% / reading 5% proficiency, ranked #864 of 919 in IL (top 94%) — low school quality limits family demand, transient renter base, plan for 1-2y turnover; 85% free/reduced lunch — lower-income household profile, screen leases tightly.
- Zoned schools: Cahokia High School (math 8% / reading 2%, grade F, #614 of 693 statewide, top 95%, 845 students, 0% FRL) — zoned schools average 0% FRL vs 85% district-wide (85 pts lower); this property's tenant base skews higher-income than the district average.
- Market conditions: 153 active listings in the ZIP; 38 comparable units currently listed for rent nearby; rentals at typical pace (median 24d on market — plan ~3-4 weeks tenant-placement turnaround); lower-income renter base — watch delinquency; 783 units permitted in St. Clair County in 2024 (378 in 5+ unit buildings).
Forward outlook
- Local home prices are declining (-3.0%/yr); year-one equity from $543 of loan paydown is wiped out by about $2k of value loss. Plan a longer hold.
- St. Clair County population projected at -23% by 2050 — secular population decline; favor cash flow + early exit over multi-decade hold.
- At projected returns (-3.0% appreciation + 3.0% rent growth), your $22k cash investment doubles in ~4 years — after that, you're playing with house money.
Negotiation context
- It's been on market 22 days — a 2% lower offer ($77k) is reasonable based on typical stale-listing flexibility.
- 3 sale attempts since 3y ago with the ask held roughly flat each time — persistent listings suggest the price (not the market) is what's stuck; bring a comps-based counter.
- Current owner paid $68k; 15% above their basis — modest negotiation headroom, anchor on the comps not their cost.
Risks & watch-outs
- Watch-outs: built in 1955 — expect roof / HVAC / electrical / plumbing capex.
- Climate carrying-cost: extreme-heat days projected 7→21/yr by 2055 (HVAC capex compounding) — expect insurance premiums to compound above CPI over the hold.
Questions for the listing agent
- Built in 1955 — when were the roof, HVAC, electrical panel, plumbing, and water heater last replaced?
- Is there a deadline driving the sale (1031 exchange, divorce, estate, relocation)? That informs how much negotiation room exists.
- What's the average days-on-market for RENTAL listings here right now (not sales)? A rising rental-DOM trend means longer vacancies and softer asking-rent achievability than the comps imply.
- What's the recent tenant-quality profile in this submarket — average credit score on applications, eviction rate, late-payment / NSF rate, and stable-employment percentage? A property-management company in the area should have these aggregated.
- How much new for-sale + rental construction is in the pipeline within 1–3 miles? Heavy new supply typically softens prices + rents 12–24 months out; constrained supply supports both.
Investment metrics
- 1% rule
- 1.96% ✓
- Cap rate
- 16.58%
- Cash-on-cash
- 36.73%
- DSCR
- 2.63
- GRM
- 4.3
CMA / ARV
- ARV (on-the-fly)
- $104,487
- Comps found
- 12
Show comp detail 12 sales within ~0.75 mi
| Address | Dist | Beds/Ba | Sqft | Sold | Price | $/sf | Match |
|---|---|---|---|---|---|---|---|
| 1601 Andrews Dr | 0.11mi | 4/1.0 | 1,261 (+5%) | 3mo | $110,000 | $87 | 76 |
| 1614 Parklane Dr | 0.19mi | 4/1.0 | 1,152 (-4%) | 5mo | $110,000 | $95 | 72 |
| 1710 Parklane Dr | 0.30mi | 4/1.0 | 1,225 (+2%) | 5mo | $110,000 | $90 | 70 |
| 1511 Andrews Dr | 0.06mi | 3/1.5 (-1) | 1,092 (-9%) | 2mo | $105,000 | $96 | 70 |
| 1711 Parklane Dr | 0.24mi | 4/1.0 | 1,315 (+10%) | 1mo | $110,000 | $84 | 64 |
| 1735 Parklane Dr | 0.41mi | 4/1.0 | 1,248 (+4%) | 6mo | $110,000 | $88 | 62 |
| 1700 Theodore Ln | 0.38mi | 3/1.0 (-1) | 1,216 (+1%) | 6mo | $50,000 | $41 | 62 |
| 28 Fox Meadow Ln | 0.53mi | 4/2.5 | 1,056 (-12%) | 2mo | $180,000 | $170 | 51 |
| 1427 Williams St | 0.64mi | 4/1.0 | 1,300 (+8%) | 2mo | $59,500 | $46 | 47 |
| 1624 Doris Ave | 0.72mi | 3/2.0 (-1) | 1,272 (+6%) | 2mo | $105,000 | $83 | 46 |
| 1426 Williams St | 0.61mi | 4/1.0 | 1,300 (+8%) | 6mo | $110,000 | $85 | 44 |
| 1620 Doris Ave | 0.72mi | 3/1.0 (-1) | 1,282 (+7%) | 2mo | $105,000 | $82 | 40 |
Match score weights: distance 35% · size 25% · config 20% · recency 20%. Top-matched comps best support the ARV.
Projected returns pro-forma
-3.0% appreciation · 3.0% rent growth · sell at horizon
- IRR
- 32.6%
- Equity multiple
- 2.37×
- Total profit
- $30,157
- Equity at exit
- $11,705
- IRR
- 39.6%
- Equity multiple
- 4.71×
- Total profit
- $81,536
- Equity at exit
- $6,787
Cash invested: $21,980 (down + closing). Projections, not guarantees.
Landlord ↔ Tenant lean methodology
- Overall (STATE)
- 43 Moderately Tenant-Leaning
- State Illinois
- 43 Moderately Tenant-Leaning · D+7
- County
- — inherits STATE
- City
- — inherits STATE
ZIP-level market 62206
- Home prices YoY
- -20.2%
- Active inventory
- 153
- Price-to-rent
- 4.3×
Monthly cashflow live
- Estimated rent
- $1,538 high interval (Pro) →
- Mortgage (P&I)
- −$412
- Tax est. 1.5%
- −$98 /mo · $1,178/yr
- Insurance
- −$33
- HOA
- −$0
- Vacancy / Maint / Mgmt
- −$323
- Net cashflow
- $673
Break-even live
UW: 25.0% down · 7.5% · 30yr · 1.5% tax · 5.0% vac · 8.0% maint · 8.0% mgmt
Financing live
Cash to close
- Down payment
- $19,625
- Closing costs
- $2,355
- Reserves months
- —
- Total cash needed
- —
Loan-product check · same deal, 3 products live
Conventional
25% down · 7.5% · 30yr
- Down + closing
- —
- Monthly P&I
- —
- Monthly cashflow
- —
- DSCR
- —
- Eligible?
- —
Personal DTI + credit; lowest rate.
DSCR
20% down · 8.5% · 30yr
- Down + closing
- —
- Monthly P&I
- —
- Monthly cashflow
- —
- DSCR
- —
- Eligible?
- —
No personal income docs; deal must DSCR.
Hard money
10% down · 12.0% · 12mo
- Down + closing
- —
- Monthly P&I
- —
- Monthly cashflow
- —
- DSCR
- —
- Eligible?
- —
Short-term bridge; refi at stabilization.
Rent comps 38 comps
| Address | Beds | Baths | Sqft | Rent | $/sqft | DOM | Units | Dist |
|---|---|---|---|---|---|---|---|---|
| 1614 Parklane Dr East Saint Louis, IL | 4.0 | 1.0 | 1152 | $1,400 | $1.22 | 23d | 1 | 0.16mi |
| 1706 Andrews Dr East Saint Louis, IL | 4.0 | 1.0 | 925 | $1,320 | $1.43 | 23d | 1 | 0.25mi |
| 1710 Parklane Dr East Saint Louis, IL | 4.0 | 1.0 | 1225 | $1,395 | $1.14 | 43d | 1 | 0.26mi |
| 102 Melvin Dr Unit 34 Sauget, IL | 4.0 | 1.0 | 1352 | $1,700 | $1.26 | 7d | 1 | 0.30mi |
| 1312 Saint Raphael St East Saint Louis, IL | 3.0 | 1.0 | 1280 | $1,500 | $1.17 | 43d | 1 | 0.46mi |
| 1162 Smith St East Saint Louis, IL | 3.0 | 1.0 | 988 | $1,295 | $1.31 | 21d | 1 | 0.56mi |
| 1421 Richard Dr East Saint Louis, IL | 3.0 | 1.0 | 936 | $1,100 | $1.18 | 2d | 1 | 0.58mi |
| 1417 Richard Dr East Saint Louis, IL | 3.0 | 1.0 | 936 | $1,400 | $1.50 | 21d | 1 | 0.58mi |
| 302 Saint Leonard Dr East Saint Louis, IL | 3.0 | 1.0 | 1155 | $1,300 | $1.13 | 43d | 1 | 0.60mi |
| 1420 Williams St East Saint Louis, IL | 4.0 | 1.0 | 1300 | $1,500 | $1.15 | 43d | 1 | 0.61mi |
| 1150 Price St Cahokia, IL | 3.0 | 1.0 | 864 | $1,400 | $1.62 | 3d | 1 | 0.64mi |
| 1405 Williams St Cahokia Heights, IL | 3.0 | 1.0 | 900 | $1,500 | $1.67 | 43d | 1 | 0.64mi |
| 1220 Williams St East Saint Louis, IL | 3.0 | 1.0 | 876 | $1,500 | $1.71 | 14d | 1 | 0.70mi |
| 2008 Delores St East Saint Louis, IL | 3.0 | 1.0 | 925 | $1,250 | $1.35 | 4d | 1 | 0.76mi |
| 1109 Saint Helena Dr Cahokia Heights, IL | 3.0 | 1.0 | 825 | $1,400 | $1.70 | 3d | 1 | 0.78mi |
| 1808 Mullens Ave Cahokia Heights, IL | 3.0 | 1.0 | 992 | $1,500 | $1.51 | 2d | 1 | 0.82mi |
| 142 Saint Barbara Ln East Saint Louis, IL | 3.0 | 2.0 | 990 | $1,300 | $1.31 | 43d | 1 | 0.86mi |
| 1713 Loretta Ave East Saint Louis, IL | 3.0 | 1.0 | 944 | $1,095 | $1.16 | 43d | 1 | 0.89mi |
| 701 Saint Paul Dr East Saint Louis, IL | 3.0 | 1.0 | 864 | $1,500 | $1.74 | 43d | 1 | 0.91mi |
| 818 La Salle Dr East Saint Louis, IL | 3.0 | 1.0 | 1106 | $1,300 | $1.18 | 23d | 1 | 0.95mi |
| 811 Saint Thomas Ln East Saint Louis, IL | 3.0 | 1.0 | 1040 | $1,295 | $1.25 | 23d | 1 | 0.99mi |
| 819 Mildred Ave East Saint Louis, IL | 3.0 | 1.0 | 936 | $1,250 | $1.34 | 21d | 1 | 1.01mi |
| 121 Saint Dorothy Dr Cahokia, IL | 3.0 | 1.0 | 988 | $1,500 | $1.52 | 43d | 1 | 1.03mi |
| 725 Saint Norbert Dr East Saint Louis, IL | 3.0 | 1.0 | 1232 | $1,500 | $1.22 | 43d | 1 | 1.04mi |
| 741 Saint Martin Dr Cahokia, IL | 5.0 | 2.0 | 864 | $1,850 | $2.14 | 2d | 1 | 1.06mi |
| 2116 Doris Ave Cahokia Heights, IL | 3.0 | 1.0 | 880 | $1,400 | $1.59 | 21d | 1 | 1.07mi |
| 705 Saint Martin Dr East Saint Louis, IL | 4.0 | 1.0 | 1033 | $1,600 | $1.55 | 21d | 1 | 1.13mi |
| 526 Saint Leo Dr East Saint Louis, IL | 3.0 | 1.0 | 925 | $1,400 | $1.51 | 3d | 1 | 1.16mi |
| 502 Saint Thomas Ln East Saint Louis, IL | 3.0 | 1.0 | 864 | $1,400 | $1.62 | 3d | 1 | 1.21mi |
| 148 Saint James Ln East Saint Louis, IL | 3.0 | 1.0 | 864 | $1,200 | $1.39 | 43d | 1 | 1.21mi |
| 850 Saint Bartholomew Dr Cahokia, IL | 3.0 | 1.0 | 1050 | $1,285 | $1.22 | 16d | 1 | 1.22mi |
| 500 Saint Thomas Ln East Saint Louis, IL | 3.0 | 1.0 | 864 | $950 | $1.10 | 23d | 1 | 1.22mi |
| 124 Saint James Ln Cahokia Heights, IL | 3.0 | 1.0 | 1064 | $1,350 | $1.27 | 43d | 1 | 1.27mi |
| 1115 Saint Marcella Dr East Saint Louis, IL | 3.0 | 1.0 | 864 | $1,500 | $1.74 | 14d | 1 | 1.32mi |
| 111 Saint Thomas Ln East Saint Louis, IL | 3.0 | 1.0 | 1040 | $1,350 | $1.30 | 43d | 1 | 1.38mi |
| 30 Saint Gregory Dr East Saint Louis, IL | 4.0 | 2.0 | 1330 | $1,395 | $1.05 | 21d | 1 | 1.42mi |
| 2 E Adams Dr East Saint Louis, IL | 3.0 | 1.0 | 925 | $885 | $0.96 | 43d | 1 | 1.49mi |
| 1130 Water St East Saint Louis, IL | 3.0 | 1.0 | 1100 | $1,450 | $1.32 | 23d | 1 | 1.50mi |
Listing history 15 events
-
2026-06-13statusdays on market $78,500 Pending 22 DOM
-
2026-06-09days on market $78,500 Active 21 DOM
-
2026-06-08days on market $78,500 Active 20 DOM
-
2026-06-07days on market $78,500 Active 19 DOM
-
2026-06-05days on market $78,500 Active 16 DOM
-
2026-06-03days on market $78,500 Active 15 DOM
-
2026-06-02days on market $78,500 Active 14 DOM
-
2026-06-01days on market $78,500 Active 13 DOM
-
2026-05-31days on market $78,500 Active 12 DOM
-
2026-05-19$78,500 Active
-
2025-05-23$78,500 Active
-
2024-07-01historical
-
2023-12-29price $55,000
-
2023-07-07$57,500 Active
-
2006-03-21soldstatus $68,000
ⓘ Source: listings_history table (triggers on properties + properties_extension) + one-shot
backfill from property_details.listing_events for pre-trigger history.
Climate risk First Street
- Flood 1/10 Low FEMA zone X (shaded) · 0% chance over 30 yrs
- Wildfire 1/10 Low
- Heat 5/10 Major 7 d/yr ≥107°F today · 21 d/yr by 30 yrs out
- Wind 2/10 Low 100% chance of damaging wind over 30 yrs
- Air quality 3/10 Moderate 3 unhealthy d/yr today · 4 by 30 yrs out
Nearby sold comps map
Loading sold comps map…
Walkable amenities ~0.75 mi
Loading nearby amenities…
Taxation est. · year 1
- Rental income
- $18,461
- − Mortgage interest
- −$4,397
- − Property taxes
- −$1,178
- − Insurance
- −$392
- − Repairs & maintenance
- −$1,477
- − Management
- −$1,477
- − Depreciation
- −$2,284
- Taxable income
- $7,256
- Est. tax owed @ 24.0%
- −$1,742
- After-tax cash flow
- $6,333/yr
For passive investors: Depreciation is non-cash, so a rental often shows a tax loss while cash-flowing — sheltering income. Rental losses are passive: they offset passive income freely, and up to $25,000/yr can offset ordinary (W-2) income if you actively participate and your MAGI is under $100k (phasing out to $0 by $150k); unused losses carry forward. On sale, claimed depreciation is recaptured at up to 25%, and gains may owe capital-gains tax (a 1031 exchange can defer both). Figures are a year-1 estimate at your 24.0% rate — not tax advice; consult a CPA.
Schools (NCES district)
- District
- Cahokia CUSD 187
- NCES district ID
- 1708040
- Math proficiency
- 3% ▼ -2.00%
- Reading proficiency
- 5% ▬ 0.00%
- Median HH income
- $28,028
- Composite
- 6.44/100
- National rank
- #14827
- State rank
- #864 of 919 in IL
Livability — Cahokia Heights
No livability data for this city. (Only ~50 U.S. cities are tracked.)
Census & demographics
- Census place
- Cahokia Heights, IL
- County
- Saint Clair County · 169,691 people
- City population
- 19,956
- Metro
- St. Louis, MO-IL
- Population (ZIP)
- 12,959
- Household income
- $33,838
- Rent vs Own
- Severe rent burden
- 729.0
Population outlook (St. Clair County) Hauer SSP2
- Today (2025)
- 250,366 people
- By 2030
- 240,511 · -3.9%
- By 2040
- 217,391 · -13.2%
- By 2050
- 192,699 · -23.0%
- By 2075
- 140,637 · -43.8%
- By 2100
- 100,499 · -59.9%
Race, ethnicity, and origin ACS 2023
- Neighborhood character
- Diverse neighborhood (Simpson 0.56)
- Race & ethnicity
- Black 59% White 29% Two or more races 6% Hispanic / Latino 3% Asian 2%
- Common ancestry
- Romanian 2% Lithuanian 1% Iranian 1%
- Foreign-born
- 2% · China
- Languages at home
- 95% English-only · Spanish 3% Other Indo-European 1% Chinese 1%
Political lean MEDSL · St. Clair
- 2024 margin
- Lean D (+7.9) · D 53.0% · R 45.1% · Other 1.8%
- 2008→2024 swing
- -14.6pp toward R · 2008: 22.4pp · 2024: 7.9pp
- All cycles
- 2024: D+7.9 2020: D+8.7 2016: D+5.6 2012: D+14.5 2008: D+22.4
Not yet ingested
- Civics
- —
Market trends
- HPI YoY
- ▼ -33.26%
- Current HPI
- 131.5144
- Rent YoY
- —
- Metro
- St. Louis, MO-IL
- State GDP YoY
- ▲ 1.59%
- F500 in state
- 60
Industry mix (Fortune 500 HQ in IL)
| Industry | F500 HQs | Revenue |
|---|---|---|
| Insurance | 4 | $201B |
|
||
| Consumer Goods | 4 | $87B |
|
||
| Industrial Machinery | 3 | $64B |
|
||
| Healthcare | 2 | $55B |
|
||
| Retail / Pharmacy | 1 | $148B |
|
||
| Agriculture / Food | 1 | $86B |
|
||
Price history
+15.4% since first listed6 events — show timeline
- 2026-05-19 Listed $78,500 MARIS as Distributed by MLS Grid
- 2025-05-23 Listed $78,500 MARIS as Distributed by MLS Grid
- 2024-07-01 Delisted — MARIS as Distributed by MLS Grid
- 2023-12-29 Price Changed $55,000 MARIS as Distributed by MLS Grid
- 2023-07-07 Listed $57,500 MARIS as Distributed by MLS Grid
- 2006-03-21 Sold (Public Records) $68,000 Public Records
Property tax history
-34.3%/yrLatest (2024): $16 · -99.1% YoY. Source: county tax records.
Cash-flow waterfall
monthlySold comps — $/sqft
last 12 mo · ≤1 miLoading sold comps…