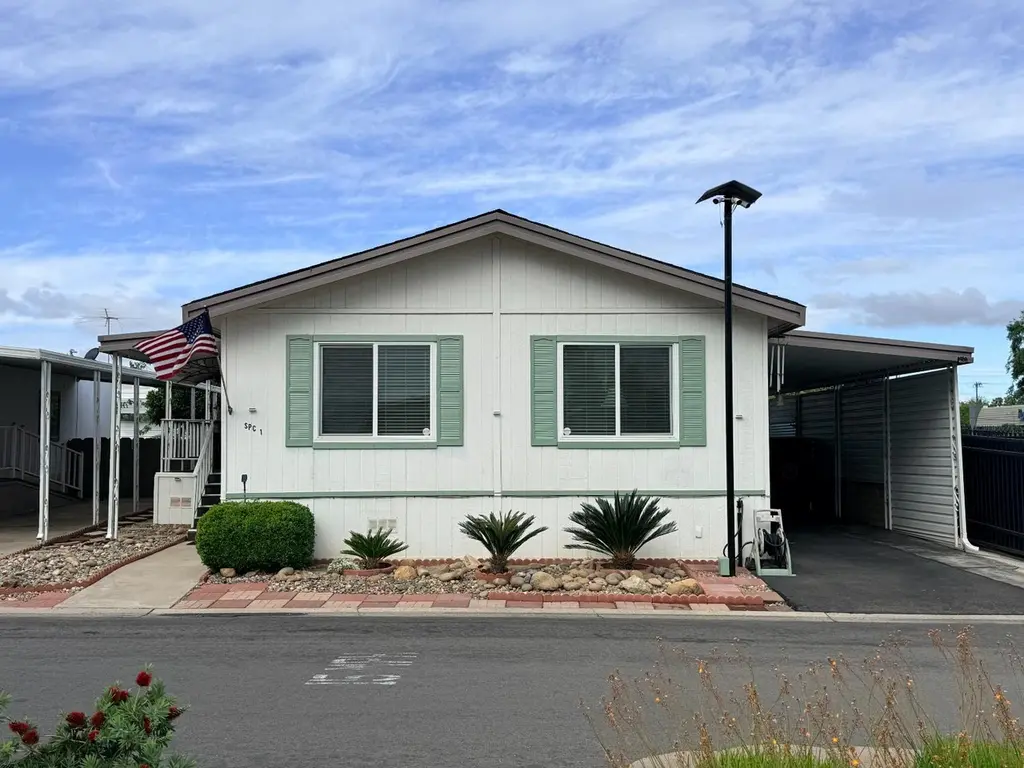
221 W Herndon Ave Spc 1 · Fresno, CA
Flood risk 1/10 · Minimal
- FEMA flood zone
- X (unshaded)
- Chance of flooding over 30 yrs
- 0.0%
- Est. flood insurance / yr
- $507 – $1,088
Fire risk 2/10 · Minimal
- Est. fire insurance / yr
- $659 – $1,223
Heat risk 8/10 · Major
- Hot days now (above 105°F)
- 7 days/yr
- Hot days in 30 yrs
- 16 days/yr
Wind risk 1/10 · Minimal
- Chance of severe wind over 30 yrs
- —
Air-quality risk 10/10 · Severe
- Unhealthy air days now
- 48 days/yr
- Unhealthy air days in 30 yrs
- 50 days/yr
Risk factors via First Street. Map © Google.
Why this score? — see what drove the B+ grade
The composite is a weighted blend of 9 inputs, each scored 0–100. Each bar is that input's sub-score; the figure is the points it added to the 100-point composite (weight × sub-score).
- Cash flow +30.0/30.0
- 1% rule +10.0/10.0
- DSCR +10.0/10.0
- Appreciation +10.0/10.0
- ARV discount +8.1/15.0
- Livability +3.1/5.0
- Schools +2.7/10.0
- Rent growth +2.5/5.0
- Condition / age +2.5/5.0
$109,500
🖨 Deal sheet (PDF) 📄 Offer letter ✓ Due diligence
Listing remarks MLS
Welcome to relaxed living in the desirable gated Stonegate Estates 55+ community! This well-maintained 2-bedroom 2 bath Manufactured home offers a bright open-concept layout with attractive laminate flooring, creating a clean and inviting feel. Lovely kitchen with granite countertops for easy cleanup. The spacious primary suite provides comfort and privacy, while the versatile second bedroom features a convenient Murphy bed and large storage unit- perfect for guests or a home office. Sit back and relax on your private extended patio. Enjoy added storage space with a private shed and low maintenance living inside and out. Residents of Stonegate enjoy wonderful amenities, including 2 sparkling pools (one for residents' family/guests), spa and welcoming clubhouse, ideal for socializing and staying active. Comfortable, convenient and move-in ready--this is a perfect location and easy 55 plus living at its best.
Key facts
- Gated community
- Two sparkling pools
- Granite countertops
Tags
Neighborhood map
What this means for you Summary
Snapshot
- This is a 2-bed/2.0-bath manufactured listed at $110k.
Deal economics
- At list price, monthly cash flow is $730 ($9k/yr) — positive.
- The deal already cash-flows at list — no discount required.
- Meets the 1% rule at list price ($2k rent vs $110k).
- Recommended offer: $103k (6.0% below list) — sets the bar for market timing.
- Cap rate 14.3% vs local median 3.7% in Fresno — top-decile yield for the area; either an underpriced asset or a hidden risk that comps aren't pricing in. Stress-test before assuming the spread holds.
Location & tenants
- Location reads 62/100 on livability (#469 in CA) — a middle-class / working-renter tenant base. Strengths: commute A+, housing A+; Watch: amenities D+, employment D+, schools D.
- Fresno Unified (urban): math 18% / reading 47% proficiency, ranked #327 of 517 in CA (top 63%) — families likely to look elsewhere, expect single-tenant / working-renter base with shorter leases; 77% free/reduced lunch — lower-income household profile, screen leases tightly.
- Market conditions: 18 active listings in the ZIP; 25 comparable units currently listed for rent nearby; rentals leasing fast (median 4d on market — plan ~1-2 weeks tenant-placement turnaround); 2,426 units permitted in Fresno County in 2024 (296 in 5+ unit buildings).
Forward outlook
- In year one you build about $12k of equity ($757 loan paydown + $11k appreciation (10.0% local appreciation)).
- Fresno County population projected at +11% by 2050 — modest demand growth; plan on rents tracking national, not racing it.
- At projected returns (10.0% appreciation + 3.0% rent growth), your $31k cash investment doubles in ~2 years — after that, you're playing with house money.
- By year 4, paydown + projected appreciation supports a ~$42k cash-out refi (75% LTV) — recoverable capital for the next deal without selling this one.
Negotiation context
- It's been on market 69 days — a 6% lower offer ($103k) is reasonable based on typical stale-listing flexibility.
- 4 sale attempts since 24y ago with the ask held roughly flat each time — persistent listings suggest the price (not the market) is what's stuck; bring a comps-based counter.
- Current owner paid $59k; list at $110k implies a 86% gain — meaningful room to come down on a strong offer.
Risks & watch-outs
- Climate carrying-cost: extreme-heat days projected 7→16/yr by 2055 (HVAC capex compounding) — expect insurance premiums to compound above CPI over the hold.
Questions for the listing agent
- It's been on market 69 days. Have you received any prior offers? Is the seller open to a 6% concession, seller financing, or rate buy-down credit?
- Why hasn't it sold? Are there any deal-killer items the seller is aware of (foundation, flood, title, zoning, code violations)?
- Is there a deadline driving the sale (1031 exchange, divorce, estate, relocation)? That informs how much negotiation room exists.
- Schools are D-rated, which usually means shorter tenancies and higher turnover. Who's the typical renter profile here, and what's been the actual vacancy rate?
- Crime grade is F in this area — have there been break-ins, vandalism, or insurance claims at this property in the last 3 years? What carrier currently insures it and at what premium?
- What's the average days-on-market for RENTAL listings here right now (not sales)? A rising rental-DOM trend means longer vacancies and softer asking-rent achievability than the comps imply.
- What's the recent tenant-quality profile in this submarket — average credit score on applications, eviction rate, late-payment / NSF rate, and stable-employment percentage? A property-management company in the area should have these aggregated.
- How much new for-sale + rental construction is in the pipeline within 1–3 miles? Heavy new supply typically softens prices + rents 12–24 months out; constrained supply supports both.
Investment metrics
- 1% rule
- 1.72% ✓
- Cap rate
- 14.29%
- Cash-on-cash
- 28.57%
- DSCR
- 2.27
- GRM
- 4.8
CMA / ARV
- ARV (median comp)
- $111,000
- List price
- $109,500
- Delta
- -1.35%
- Verdict
- FAIR
- Comps
- 18 within 1.0 mi
Show comp detail 12 sales within ~0.75 mi
| Address | Dist | Beds/Ba | Sqft | Sold | Price | $/sf | Match |
|---|---|---|---|---|---|---|---|
| 221 W Herndon Ave #192 | 0.00mi | 2/2.0 | 1,248 (0%) | 1mo | $112,000 | $90 | 99 |
| 221 W Herndon Ave #130 | 0.00mi | 2/2.0 | 1,275 (+2%) | 2mo | $119,500 | $94 | 95 |
| 221 W Herndon Ave #120 | 0.00mi | 2/2.0 | 1,200 (-4%) | 3mo | $110,000 | $92 | 91 |
| 221 W Herndon Ave #27 | 0.00mi | 2/2.0 | 1,152 (-8%) | 1mo | $66,000 | $57 | 86 |
| 221 W Herndon Ave #107 | 0.00mi | 2/2.0 | 1,152 (-8%) | 2mo | $95,000 | $82 | 86 |
| 221 W Herndon Ave #166 | 0.00mi | 2/2.0 | 1,152 (-8%) | 9mo | $129,900 | $113 | 80 |
| 105 Herndon #60 | 0.19mi | 3/2.0 (+1) | 1,296 (+4%) | 0mo | $120,000 | $93 | 79 |
| 221 W Herndon Ave #41 | 0.00mi | 2/2.0 | 1,344 (+8%) | 12mo | $100,000 | $74 | 77 |
| 221 W Herndon Ave #164 | 0.10mi | 2/1.8 | 1,152 (-8%) | 10mo | $85,000 | $74 | 74 |
| 221 W Herndon Ave #148 | 0.09mi | 2/2.0 | 1,344 (+8%) | 13mo | $70,000 | $52 | 72 |
| 221 W Herndon #125 | 0.00mi | 2/2.0 | 1,080 (-14%) | 7mo | $59,000 | $55 | 72 |
| 221 W Herndon Ave #184 | 0.09mi | 3/2.0 (+1) | 1,344 (+8%) | 12mo | $69,900 | $52 | 68 |
Match score weights: distance 35% · size 25% · config 20% · recency 20%. Top-matched comps best support the ARV.
Projected returns pro-forma
10.0% appreciation · 3.0% rent growth · sell at horizon
- IRR
- 45.9%
- Equity multiple
- 4.46×
- Total profit
- $106,163
- Equity at exit
- $98,646
- IRR
- 39.9%
- Equity multiple
- 10.01×
- Total profit
- $276,124
- Equity at exit
- $212,734
Cash invested: $30,660 (down + closing). Projections, not guarantees.
Landlord ↔ Tenant lean methodology
- Overall (STATE)
- 18 Strongly Tenant-Friendly
- State California
- 18 Strongly Tenant-Friendly · D+13
- County
- — inherits STATE
- City
- — inherits STATE
ZIP-level market 93650
- Home prices YoY
- 2.5%
- Active inventory
- 18
- Price-to-rent
- 4.8×
Monthly cashflow live
- Estimated rent
- $1,882 high interval (Pro) →
- Mortgage (P&I)
- −$574
- Tax est. 1.5%
- −$137 /mo · $1,642/yr
- Insurance
- −$46
- HOA
- −$0
- Vacancy / Maint / Mgmt
- −$395
- Net cashflow
- $730
Break-even live
Sensitivity live
| Price | -10% $806 | -5% $768 | +0% $730 | +5% $692 | +10% $654 |
|---|---|---|---|---|---|
| Rent | -10% $581 | -5% $656 | +0% $730 | +5% $804 | +10% $879 |
| Rate | -1.0pp $785 | -0.5pp $758 | base $730 | +0.5pp $702 | +1.0pp $673 |
UW: 25.0% down · 7.5% · 30yr · 1.5% tax · 5.0% vac · 8.0% maint · 8.0% mgmt
Financing live
Cash to close
- Down payment
- $27,375
- Closing costs
- $3,285
- Reserves months
- —
- Total cash needed
- —
Loan-product check · same deal, 3 products live
Conventional
25% down · 7.5% · 30yr
- Down + closing
- —
- Monthly P&I
- —
- Monthly cashflow
- —
- DSCR
- —
- Eligible?
- —
Personal DTI + credit; lowest rate.
DSCR
20% down · 8.5% · 30yr
- Down + closing
- —
- Monthly P&I
- —
- Monthly cashflow
- —
- DSCR
- —
- Eligible?
- —
No personal income docs; deal must DSCR.
Hard money
10% down · 12.0% · 12mo
- Down + closing
- —
- Monthly P&I
- —
- Monthly cashflow
- —
- DSCR
- —
- Eligible?
- —
Short-term bridge; refi at stabilization.
Rent comps 25 comps
| Address | Beds | Baths | Sqft | Rent | $/sqft | DOM | Units | Dist |
|---|---|---|---|---|---|---|---|---|
| 91 W Sierra Ave Fresno, CA | 3.0 | 1.5 | 1291 | $2,500 | $1.94 | 17d | 1 | 0.38mi |
| 6075 N Poplar Ave Apt E Fresno, CA | 2.0 | 1.0 | 1100 | $1,600 | $1.45 | 4d | 1 | 0.75mi |
| 6052 N College Ave Unit A Fresno, CA | 3.0 | 2.0 | 1200 | $2,100 | $1.75 | 44d | 1 | 0.77mi |
| 6549 N Palm Ave Fresno, CA | 2.0 | 2.0 | 1100 | $1,760 | $1.60 | 2d | 2 | 0.78mi |
| 135 E Stuart Ave Fresno, CA | 3.0 | 1.0 | 1120 | $1,995 | $1.78 | 4d | 1 | 0.79mi |
| 336 W Bullard Ave Fresno, CA | 2.0 | 2.0 | 1100 | $1,700 | $1.55 | 44d | 1 | 0.82mi |
| 445 W Bullard Ave Fresno, CA | 1.0–2.0 | 1.0–2.0 | 850 | $1,695 | $1.99 | 4d | 2 | 0.97mi |
| 6515 N Orchard St Fresno, CA | 3.0 | 2.0 | 1500 | $2,300 | $1.53 | 17d | 1 | 1.09mi |
| 373 W Nees Ave Fresno, CA | 1.0–2.0 | 1.0–2.0 | 867 | $1,855 | $2.14 | 4d | 1 | 1.10mi |
| 1249 W Spruce Ave Unit 1249 Fresno, CA | 2.0 | 2.0 | 1250 | $1,975 | $1.58 | 11d | 1 | 1.14mi |
| 7087 N Thorne Ave Fresno, CA | 2.0 | 1.0 | 785 | $1,495 | $1.90 | 2d | 1 | 1.15mi |
| 5669 N Fresno St Fresno, CA | 2.0 | 1.0–2.0 | 916 | $1,537 | $1.68 | 2d | 10 | 1.17mi |
| 445 W Nees Ave Fresno, CA | 1.0–2.0 | 1.0–2.0 | 847 | $1,820 | $2.15 | 2d | 10 | 1.17mi |
| 1271 W Spruce Ave Unit 1271 Fresno, CA | 2.0 | 2.5 | 1250 | $1,850 | $1.48 | 11d | 1 | 1.18mi |
| 7579 N Angus St Unit 101 Fresno, CA | 2.0 | 2.0 | 1245 | $1,825 | $1.47 | 24d | 1 | 1.21mi |
| 584 E Bullard Ave Fresno, CA | 2.0 | 1.5 | 900 | $1,425 | $1.58 | 44d | 1 | 1.22mi |
| 7166 N Fruit Ave #179 Fresno, CA | 1.0 | 1.0 | 884 | $1,625 | $1.84 | 2d | 1 | 1.22mi |
| 485 E Bullard Ave Fresno, CA | 2.0 | 1.0–2.0 | 907 | $1,452 | $1.60 | 4d | 8 | 1.23mi |
| 7580 N Angus St Fresno, CA | 2.0 | 2.0 | 1350 | $1,900 | $1.41 | 44d | 1 | 1.24mi |
| 7722 N Angus St Fresno, CA | 1.0–2.0 | 1.0–2.0 | 820 | $1,575 | $1.92 | 4d | 1 | 1.37mi |
| 7511 N First St Fresno, CA | 1.0–3.0 | 1.0–2.5 | 1078 | $1,974 | $1.83 | 2d | 21 | 1.37mi |
| 5721 N Callisch Ave Fresno, CA | 3.0 | 1.5 | 1393 | $1,950 | $1.40 | 4d | 1 | 1.38mi |
| 5270 N San Pablo Ave Fresno, CA | 2.0 | 1.0–2.0 | 903 | $1,545 | $1.71 | 4d | 2 | 1.39mi |
| 7625 N First St Fresno, CA | 1.0–2.0 | 1.0 | 739 | $1,625 | $2.20 | 3d | 2 | 1.45mi |
| 7675 N First St Fresno, CA | 1.0–2.0 | 1.0–2.0 | 989 | $1,830 | $1.85 | 44d | 1 | 1.48mi |
Listing history 28 events
-
2026-06-21days on market $109,500 Active 69 DOM
-
2026-06-18days on market $109,500 Active 66 DOM
-
2026-06-17days on market $109,500 Active 65 DOM
-
2026-06-16days on market $109,500 Active 64 DOM
-
2026-06-15days on market $109,500 Active 63 DOM
-
2026-06-13days on market $109,500 Active 61 DOM
-
2026-06-10days on market $109,500 Active 58 DOM
-
2026-06-09days on market $109,500 Active 57 DOM
-
2026-06-08days on market $109,500 Active 56 DOM
-
2026-06-07days on market $109,500 Active 55 DOM
-
2026-06-05days on market $109,500 Active 52 DOM
-
2026-06-03days on market $109,500 Active 51 DOM
-
2026-06-02days on market $109,500 Active 50 DOM
-
2026-06-01days on market $109,500 Active 49 DOM
-
2026-05-31days on market $109,500 Active 48 DOM
-
2026-04-13$109,500 Active 920-char remark
Show marketing remark (920 chars)
Welcome to relaxed living in the desirable gated Stonegate Estates 55+ community! This well-maintained 2-bedroom 2 bath Manufactured home offers a bright open-concept layout with attractive laminate flooring, creating a clean and inviting feel. Lovely kitchen with granite countertops for easy cleanup. The spacious primary suite provides comfort and privacy, while the versatile second bedroom features a convenient Murphy bed and large storage unit- perfect for guests or a home office. Sit back and relax on your private extended patio. Enjoy added storage space with a private shed and low maintenance living inside and out. Residents of Stonegate enjoy wonderful amenities, including 2 sparkling pools (one for residents' family/guests), spa and welcoming clubhouse, ideal for socializing and staying active. Comfortable, convenient and move-in ready--this is a perfect location and easy 55 plus living at its best.
-
2018-08-15soldstatus $59,000 Sold 365-char remark
Show marketing remark (365 chars)
Stonegate Estates Senior Mobile Home Park. 2 bdrm 2 bath, 1984 manufactured home. New Granite in Kitchen and baths. New dual pane windows, newer paint inside and out. Vinyl plank flooring in L.R and kitchen. Open and spacious Living room with eating area. Comp roof is 3 yrs old. this is a senior park, 55 plus only. buyer must be pre-approved with park management.
-
2018-06-06status Backup 365-char remark
Show marketing remark (365 chars)
Stonegate Estates Senior Mobile Home Park. 2 bdrm 2 bath, 1984 manufactured home. New Granite in Kitchen and baths. New dual pane windows, newer paint inside and out. Vinyl plank flooring in L.R and kitchen. Open and spacious Living room with eating area. Comp roof is 3 yrs old. this is a senior park, 55 plus only. buyer must be pre-approved with park management.
-
2018-05-21$59,000 Active 365-char remark
Show marketing remark (365 chars)
Stonegate Estates Senior Mobile Home Park. 2 bdrm 2 bath, 1984 manufactured home. New Granite in Kitchen and baths. New dual pane windows, newer paint inside and out. Vinyl plank flooring in L.R and kitchen. Open and spacious Living room with eating area. Comp roof is 3 yrs old. this is a senior park, 55 plus only. buyer must be pre-approved with park management.
-
2016-01-17price $49,900
-
2016-01-13soldstatus $49,900 Sold
-
2015-11-21status Pending
-
2015-11-21price $59,900
-
2015-11-20$59,900 Active
-
2002-06-25soldstatus $25,000
-
2002-05-18price $29,500
-
2002-05-18historical
-
2002-02-07$25,000
ⓘ Source: listings_history table (triggers on properties + properties_extension) + one-shot
backfill from property_details.listing_events for pre-trigger history.
Climate risk First Street
- Flood 1/10 Low FEMA zone X (unshaded) · 0% chance over 30 yrs
- Wildfire 2/10 Low
- Heat 8/10 Severe 7 d/yr ≥105°F today · 16 d/yr by 30 yrs out
- Wind 1/10 Low
- Air quality 10/10 Extreme 48 unhealthy d/yr today · 50 by 30 yrs out
Nearby sold comps map
Loading sold comps map…
Walkable amenities ~0.75 mi
Loading nearby amenities…
Taxation est. · year 1
- Rental income
- $22,584
- − Mortgage interest
- −$6,134
- − Property taxes
- −$1,642
- − Insurance
- −$548
- − Repairs & maintenance
- −$1,807
- − Management
- −$1,807
- − Depreciation
- −$3,185
- Taxable income
- $7,462
- Est. tax owed @ 24.0%
- −$1,791
- After-tax cash flow
- $6,970/yr
For passive investors: Depreciation is non-cash, so a rental often shows a tax loss while cash-flowing — sheltering income. Rental losses are passive: they offset passive income freely, and up to $25,000/yr can offset ordinary (W-2) income if you actively participate and your MAGI is under $100k (phasing out to $0 by $150k); unused losses carry forward. On sale, claimed depreciation is recaptured at up to 25%, and gains may owe capital-gains tax (a 1031 exchange can defer both). Figures are a year-1 estimate at your 24.0% rate — not tax advice; consult a CPA.
Schools (NCES district)
- District
- Fresno Unified
- NCES district ID
- 0614550
- Math proficiency
- 18% ▼ -12.00%
- Reading proficiency
- 47% ▲ 9.00%
- Median HH income
- $36,095
- Composite
- 26.83/100
- National rank
- #7111
- State rank
- #327 of 517 in CA
Livability — Fresno
- Score
- 62/100
- State rank
- #469
- US rank
- #15907
Category grades
Schools grade is shown separately in the Schools card above.
Census & demographics
- Census place
- Fresno, CA
- City population
- 593,114
- Population (ZIP)
- 2,969
Population outlook (Fresno County) Hauer SSP2
- Today (2025)
- 1,042,971 people
- By 2030
- 1,072,198 · +2.8%
- By 2040
- 1,122,408 · +7.6%
- By 2050
- 1,157,251 · +11.0%
- By 2075
- 1,182,575 · +13.4%
- By 2100
- 1,105,899 · +6.0%
Race, ethnicity, and origin ACS 2023
- Neighborhood character
- Predominantly Hispanic (77%)
- Race & ethnicity
- Hispanic / Latino 77% Two or more races 33% White 12% Asian 6% Black 3%
- Hispanic origin (detail)
- Mexican 71%
- Common ancestry
- Slovak 3% Romanian 1%
- Foreign-born
- 15% · Canada
- Languages at home
- 52% English-only · Spanish 41% Other Asian/Pacific 4% Other Indo-European 2%
Political lean MEDSL · Fresno
- 2024 margin
- Toss-up / Even · D 46.5% · R 50.9% · Other 2.6%
- 2008→2024 swing
- -6.5pp toward R · 2008: 2.1pp · 2024: -4.4pp
- All cycles
- 2024: R+4.4 2020: D+7.8 2016: D+3.9 2012: R+2.9 2008: D+2.1
Not yet ingested
- Civics
- —
Market trends
- HPI YoY
- ▲ 13.16%
- Current HPI
- 547.5597
- Rent YoY
- —
- Metro
- —
- State GDP YoY
- ▲ 3.21%
- F500 in state
- 116
Industry mix (Fortune 500 HQ in CA)
| Industry | F500 HQs | Revenue |
|---|---|---|
| Technology | 27 | $1,492B |
|
||
| Financial Services | 3 | $174B |
|
||
| Retail | 3 | $44B |
|
||
| Insurance | 3 | $26B |
|
||
| Media / Entertainment | 2 | $115B |
|
||
| Pharmaceuticals / Biotech | 2 | $62B |
|
||
Price history
+338.0% since first listed13 events — show timeline
- 2026-04-13 Listed $109,500 FRESNOMLS
- 2018-08-15 Sold (MLS) $59,000 FRESNOMLS
- 2018-06-06 Pending — FRESNOMLS
- 2018-05-21 Listed $59,000 FRESNOMLS
- 2016-01-17 Price Changed $49,900 FRESNOMLS
- 2016-01-13 Sold (MLS) $49,900 FRESNOMLS
- 2015-11-21 Pending — FRESNOMLS
- 2015-11-21 Price Changed $59,900 FRESNOMLS
- 2015-11-20 Listed $59,900 FRESNOMLS
- 2002-06-25 Sold (MLS) $25,000 FRESNOMLS
- 2002-05-18 Delisted — FRESNOMLS
- 2002-05-18 Price Changed $29,500 FRESNOMLS
- 2002-02-07 Listed $25,000 FRESNOMLS
Cash-flow waterfall
monthlySold comps — $/sqft
last 12 mo · ≤1 miLoading sold comps…