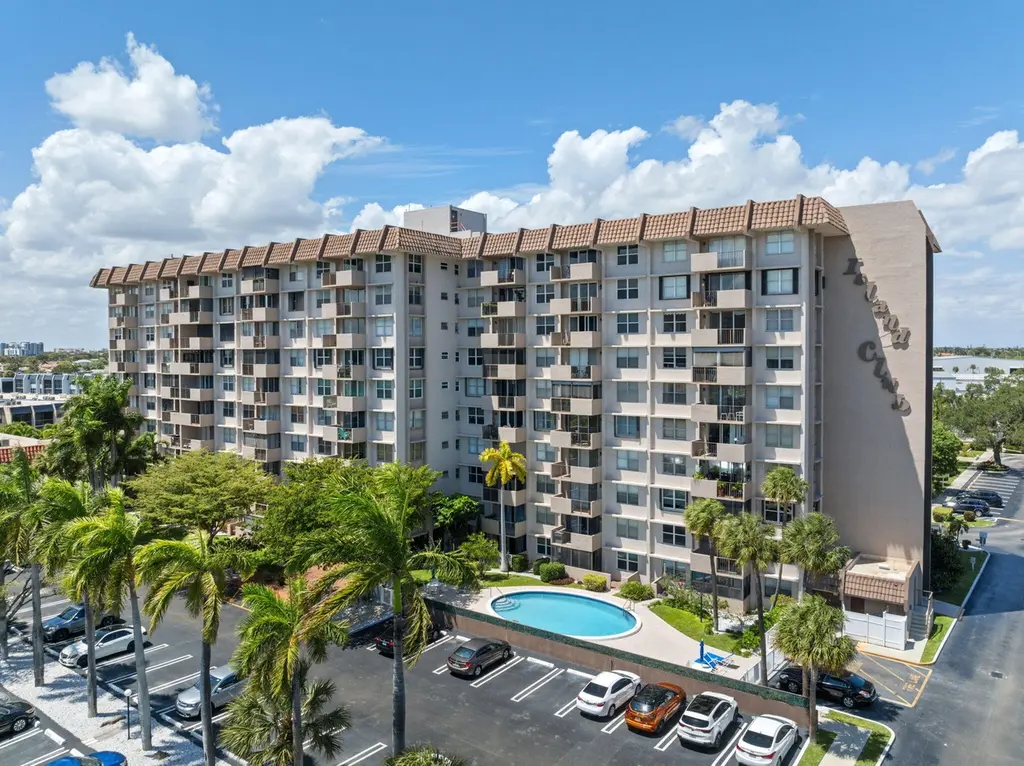
777 S Federal Hwy Unit Rp301 · Pompano Beach, FL
Flood risk 5/10 · Moderate
- FEMA flood zone
- AH
- Chance of flooding over 30 yrs
- 0.23%
- Est. flood insurance / yr
- $1,142 – $2,507
Fire risk 1/10 · Minimal
- Est. fire insurance / yr
- $947 – $1,759
Heat risk 10/10 · Severe
- Hot days now (above 106°F)
- 7 days/yr
- Hot days in 30 yrs
- 26 days/yr
Wind risk 10/10 · Severe
- Chance of severe wind over 30 yrs
- 99.0%
Air-quality risk 2/10 · Minimal
- Unhealthy air days now
- 1 days/yr
- Unhealthy air days in 30 yrs
- 2 days/yr
Risk factors via First Street. Map © Google.
Why this score? — see what drove the D+ grade
The composite is a weighted blend of 9 inputs, each scored 0–100. Each bar is that input's sub-score; the figure is the points it added to the 100-point composite (weight × sub-score).
- Cash flow +13.2/30.0
- 1% rule +9.6/10.0
- ARV discount +7.5/15.0
- Schools +4.1/10.0
- DSCR +4.0/10.0
- Livability +3.7/5.0
- Condition / age +2.5/5.0
- Rent growth +2.4/5.0
- Appreciation +0.0/10.0
$189,777
🖨 Deal sheet 📄 Offer letter ✓ Due diligence
Listing remarks
Welcome to Pompano Beach — South Florida's rising coastal gem where laid-back beach vibes meet exciting new development and a vibrant future on the sand. Introducing this fully renovated 2-bedroom, 1.5-bath condo with impact windows, brand-new Luxury vinyl Tile , and fresh paint — truly turnkey. Boating community with common dock available, plus just a 5-minute commute to the beach. Well-maintained community has passed its milestone inspection with no upcoming assessments. Come see this gem today — it won't last!
Key facts
- Fully renovated
- Common dock
- Impact windows
Tags
Property features AI
Finance
- Other: Directions: Federal Hwy south of Atlantic on west side of road; go through gate
- Financial info: Pets not allowed
- HOA & community: Association with monthly fee (includes insurance, sewer, trash, water, common areas, common real estate tax, elevator, pool service); Association amenities: elevator(s), laundry, management, parking, pool, storage, clubhouse, boating, community room, lobby, street lights, gated, security, manager on site
Exterior
- Parking: Assigned parking, guest parking and open parking (1 total)
- Security: Manager on site; Gated; Security personnel; Closed-circuit camera(s); Smoke detector(s)
- Utilities: Public water; Public sewer; Electricity available
- Home design: Condominium; One level; South-facing; Resale, updated/remodeled
- Construction: CBS construction; Concrete/other roof; Building has 10 stories; Appraiser-listed building area
- Exterior features: No waterfront (ocean access via fixed bridge); Pool; Clubhouse; Boating access; Storage; Community room; Lobby; Street lights; Gated community
Interior
- Kitchen: Disposal; Dishwasher; Electric range; Microwave; Refrigerator
- Bedrooms: One main-level bedroom
- Flooring: Laminate; Vinyl; Wood
- Bathrooms: One full bathroom; One half bathroom
- Heating & cooling: Central heating; Central air; Ceiling fan(s)
- Interior features: Walk-in closet(s); Closed-circuit cameras; Smoke detectors
- Laundry & utility: Common area laundry
Neighborhood map
What this means for you Summary
Snapshot
- This is a 2-bed/2.0-bath condo listed at $190k.
Deal economics
- At list price, monthly cash flow is $-156 ($-2k/yr) — negative.
- To cash-flow at today's rent, offer at most $162k (14.6% below list).
- Meets the 1% rule at list price ($3k rent vs $190k).
- Recommended offer: $162k (14.6% below list) — sets the bar for cash-flow.
- Cap rate 6.3% vs local median 3.1% in Pompano Beach — top-decile yield for the area; either an underpriced asset or a hidden risk that comps aren't pricing in. Stress-test before assuming the spread holds.
Location & tenants
- Location reads 74/100 on livability (#284 in FL, #4,541 nationally) — a middle-class / working-renter tenant base. Strengths: commute A+, housing A+, cost of living B+; Watch: employment D+, amenities F.
- Broward (suburban): math 42% / reading 53% proficiency, ranked #46 of 73 in FL (top 63%) — families likely to look elsewhere, expect single-tenant / working-renter base with shorter leases.
- Zoned schools: Mcnab Elementary School (math 51% / reading 63%, grade C+, #781 of 2,144 statewide, top 38%, 614 students, 56% FRL); Pompano Beach Middle School (math 29% / reading 40%, grade F, #421 of 571 statewide, top 74%, 1,040 students, 73% FRL); Blanche Ely High School (math 7% / reading 29%, grade F, #570 of 667 statewide, top 86%, 1,906 students, 75% FRL) — zoned schools average 68% FRL vs 51% district-wide (17 pts higher); higher-poverty schools than district average — tighter screening recommended.
- Market conditions: Rents soft (-0.4%/yr); 843 active listings in the ZIP; 40 comparable units currently listed for rent nearby; rentals at typical pace (median 22d on market — plan ~3-4 weeks tenant-placement turnaround); solid renter incomes; 2,111 units permitted in Broward County in 2024 (1,265 in 5+ unit buildings).
- This rent runs 40% of the median local income ($84k/yr) — at the standard rent-burdened threshold; future hikes will face affordability resistance.
Forward outlook
- Local home prices are declining (-3.0%/yr); year-one equity from $1k of loan paydown is wiped out by about $6k of value loss. Plan a longer hold.
- Broward County population projected at +34% by 2050 — long-run rental-demand tailwind backs the buy-and-hold thesis.
Negotiation context
- It's been on market 56 days — a 3% lower offer ($184k) is reasonable based on typical stale-listing flexibility.
- 2 sale attempts; this cycle's ask has dropped $10k (5%) from the opening price — seller is motivated, your offer sets the floor, not the list.
- Current owner paid $165k; 15% above their basis — modest negotiation headroom, anchor on the comps not their cost.
Risks & watch-outs
- Watch-outs: flood insurance adds $152/mo; HOA is 31% of rent.
- Climate carrying-cost: in FEMA flood zone AH (mandatory federal flood insurance); severe wind risk, 99% chance of damaging wind over 30y; extreme-heat days projected 7→26/yr by 2055 (HVAC capex compounding) — expect insurance premiums to compound above CPI over the hold.
Questions for the listing agent
- What do current leases actually rent for vs. the listed asking? Can we see a recent rent roll and the last 12 months of T-12 income?
- It's been on market 56 days. Have you received any prior offers? Is the seller open to a 15% concession, seller financing, or rate buy-down credit?
- Built in 1972 — when were the roof, HVAC, electrical panel, plumbing, and water heater last replaced?
- What's the actual annual flood-insurance premium (NFIP or private), and is the property in a SFHA with mandatory coverage?
- What does the HOA fee cover, when was the last increase, and are there any pending special assessments or reserve-fund shortfalls?
- Any open or pending special assessments — roof, HVAC, plumbing, elevator, façade? What's the per-unit balance and payoff schedule, and is the seller paying it off at close or rolling it to the buyer?
- Is there a deadline driving the sale (1031 exchange, divorce, estate, relocation)? That informs how much negotiation room exists.
- Schools are D-rated, which usually means shorter tenancies and higher turnover. Who's the typical renter profile here, and what's been the actual vacancy rate?
- The area grade is low — what's the realistic commute time and amenity access for the typical tenant pool here? Any planned neighborhood developments (good or bad) we should know about?
- What's the average days-on-market for RENTAL listings here right now (not sales)? A rising rental-DOM trend means longer vacancies and softer asking-rent achievability than the comps imply.
- What's the recent tenant-quality profile in this submarket — average credit score on applications, eviction rate, late-payment / NSF rate, and stable-employment percentage? A property-management company in the area should have these aggregated.
- How much new apartment / multifamily construction is in the pipeline within 1–3 miles? Heavy new supply (>2% of stock underway) typically softens rents 12–24 months out; light construction supports rent growth.
Investment metrics
- 1% rule
- 1.46% ✓
- Cap rate
- 6.27%
- Cash-on-cash
- -0.10%
- DSCR
- 1.00
- GRM
- 5.7
CMA / ARV
No comps found within radius.
Projected returns pro-forma
-3.0% appreciation · 0.0% rent growth · sell at horizon
- IRR
- -28.4%
- Equity multiple
- 0.09×
- Total profit
- $-48,135
- Equity at exit
- $28,296
- IRR
- -71.0%
- Equity multiple
- -0.57×
- Total profit
- $-83,297
- Equity at exit
- $16,408
Cash invested: $53,138 (down + closing). Projections, not guarantees.
Landlord ↔ Tenant lean methodology
- Overall (STATE)
- 87 Strongly Landlord-Friendly
- State Florida
- 87 Strongly Landlord-Friendly · R+3
- County
- — inherits STATE
- City
- — inherits STATE
ZIP-level market 33062
- Rents YoY
- -0.4%
- Active inventory
- 843
- Price-to-rent
- 5.7×
Monthly cashflow live
- Estimated rent
- $2,763 high interval (Pro) →
- Mortgage (P&I)
- −$995
- Tax from tax record
- −$253 /mo · $3,035/yr
- Insurance
- −$79
- Flood insurance flood zone
- −$152 /mo · $1,824/yr
- HOA
- −$860
- Vacancy / Maint / Mgmt
- −$580
- Net cashflow
- $-156
Break-even live
UW: 25.0% down · 7.5% · 30yr · 1.5% tax · 5.0% vac · 8.0% maint · 8.0% mgmt
Financing live
Cash to close
- Down payment
- $47,444
- Closing costs
- $5,693
- Reserves months
- —
- Total cash needed
- —
Loan-product check · same deal, 3 products live
Conventional
25% down · 7.5% · 30yr
- Down + closing
- —
- Monthly P&I
- —
- Monthly cashflow
- —
- DSCR
- —
- Eligible?
- —
Personal DTI + credit; lowest rate.
DSCR
20% down · 8.5% · 30yr
- Down + closing
- —
- Monthly P&I
- —
- Monthly cashflow
- —
- DSCR
- —
- Eligible?
- —
No personal income docs; deal must DSCR.
Hard money
10% down · 12.0% · 12mo
- Down + closing
- —
- Monthly P&I
- —
- Monthly cashflow
- —
- DSCR
- —
- Eligible?
- —
Short-term bridge; refi at stabilization.
Rent comps 40 comps
| Address | Beds | Baths | Sqft | Rent | $/sqft | DOM | Units | Dist |
|---|---|---|---|---|---|---|---|---|
| 1850 SE 7th St Unit B Pompano Beach, FL | 2.0 | 2.0 | 900 | $4,000 | $4.44 | 24d | 1 | 0.06mi |
| 777 S Federal Hwy Pompano Beach, FL | 2.0 | 2.0 | 1166 | $2,825 | $2.42 | 3d | 3 | 0.09mi |
| 777 S Federal Hwy Pompano Beach, FL | 1.0–2.0 | 1.0–2.0 | 947 | $3,200 | $3.38 | 15d | 6 | 0.09mi |
| 777 S Federal Hwy Pompano Beach, FL | 1.0–2.0 | 1.0–2.0 | 947 | $3,500 | $3.69 | 24d | 6 | 0.09mi |
| 690 SE 23rd Ave #1 Pompano Beach, FL | 2.0 | 2.5 | 1055 | $2,995 | $2.84 | 15d | 1 | 0.24mi |
| 1971 SE 5th Ct Unit 303E Pompano Beach, FL | 2.0 | 2.0 | 960 | $2,400 | $2.50 | 22d | 1 | 0.24mi |
| 490 SE 19th Ave #107 Pompano Beach, FL | 2.0 | 2.0 | 960 | $1,650 | $1.72 | 15d | 1 | 0.24mi |
| 1971 SE 5th Ct Pompano Beach, FL | 2.0 | 2.0 | 960 | $2,050 | $2.14 | 24d | 2 | 0.24mi |
| 1891 SE 5th Ct Pompano Beach, FL | 2.0 | 2.0 | 1102 | $3,000 | $2.72 | 17d | 1 | 0.24mi |
| 801 S Federal Hwy #21 Pompano Beach, FL | 2.0 | 2.0 | 1070 | $3,100 | $2.90 | 3d | 1 | 0.25mi |
| 431 SE 19th Ave Unit 2 Pompano Beach, FL | 1.0 | 1.0 | 700 | $1,600 | $2.29 | 24d | 1 | 0.27mi |
| 8 SE 19th Ave #11 Pompano Beach, FL | 2.0 | 1.0 | 842 | $1,795 | $2.13 | 24d | 1 | 0.50mi |
| 1100 Pine Dr #102 Pompano Beach, FL | 2.0 | 2.0 | 950 | $2,100 | $2.21 | 24d | 1 | 0.52mi |
| 344 SE 11th Ave #8 Pompano Beach, FL | 1.0 | 1.0 | 600 | $1,500 | $2.50 | 24d | 1 | 0.55mi |
| 1201 S Riverside Dr #106 Pompano Beach, FL | 1.0 | 1.0 | 772 | $2,400 | $3.11 | 24d | 1 | 0.57mi |
| 1201 S Riverside Dr #307 Pompano Beach, FL | 1.0 | 1.0 | 772 | $2,400 | $3.11 | 7d | 1 | 0.57mi |
| 1001 S Riverside Dr #105 Pompano Beach, FL | 1.0 | 1.0 | 700 | $2,250 | $3.21 | 24d | 1 | 0.59mi |
| 23 NE 19th Ave Pompano Beach, FL | 1.0 | 1.0 | 900 | $2,500 | $2.78 | 7d | 1 | 0.62mi |
| 3201 SE 12th St Unit B4 Pompano Beach, FL | 2.0 | 2.0 | 1000 | $2,400 | $2.40 | 24d | 1 | 0.62mi |
| 11 NE 24th Ave Pompano Beach, FL | 3.0 | 1.0–2.0 | 965 | $3,822 | $3.96 | 3d | 36 | 0.64mi |
| 320 SE 10th Ave Unit D Pompano Beach, FL | 2.0 | 2.0 | 1000 | $2,300 | $2.30 | 24d | 1 | 0.64mi |
| 3208 SE 11th St #201 Pompano Beach, FL | 2.0 | 2.0 | 914 | $2,200 | $2.41 | 11d | 1 | 0.64mi |
| 305 SE 11th Ave Unit D Pompano Beach, FL | 3.0 | 2.0 | 1000 | $2,400 | $2.40 | 17d | 1 | 0.64mi |
| 140 NE 19th Ave Pompano Beach, FL | 1.0 | 1.0 | 850 | $1,800 | $2.12 | 24d | 1 | 0.65mi |
| 3216 SE 12th St #28 Pompano Beach, FL | 1.0 | 1.0 | 650 | $2,300 | $3.54 | 7d | 1 | 0.65mi |
| 912 Pine Dr #211 Pompano Beach, FL | 2.0 | 2.0 | 949 | $1,900 | $2.00 | 24d | 1 | 0.66mi |
| 32 NE 22nd Ave #107 Pompano Beach, FL | 1.0 | 1.0 | 742 | $1,650 | $2.22 | 15d | 1 | 0.66mi |
| 600 S Riverside Dr Pompano Beach, FL | 2.0 | 2.0 | 1108 | $4,000 | $3.61 | 3d | 1 | 0.69mi |
| 29 NE 15th Ave Pompano Beach, FL | 2.0 | 1.0 | 900 | $1,450 | $1.61 | 15d | 1 | 0.69mi |
| 3205 SE 7th St #201 Pompano Beach, FL | 1.0 | 1.0 | 560 | $1,900 | $3.39 | 24d | 1 | 0.70mi |
| 840 Pine Dr #103 Pompano Beach, FL | 2.0 | 2.0 | 904 | $2,800 | $3.10 | 24d | 1 | 0.71mi |
| 275 N Federal Hwy Pompano Beach, FL | 1.0–3.0 | 1.0–2.0 | 1117 | $3,047 | $2.73 | 1d | 9 | 0.73mi |
| 241 SE 9th Ave Pompano Beach, FL | 2.0 | 2.0 | 725 | $1,800 | $2.48 | 11d | 2 | 0.76mi |
| 208 N Federal Hwy Pompano Beach, FL | 2.0 | 1.0–2.0 | 687 | $3,330 | $4.84 | 2d | 29 | 0.76mi |
| 1333 S Ocean Blvd Pompano Beach, FL | 1.0–2.0 | 1.0–2.0 | 959 | $3,996 | $4.16 | 3d | 15 | 0.78mi |
| 2701 NE 1st St #106 Pompano Beach, FL | 2.0 | 1.0 | 800 | $2,200 | $2.75 | 24d | 1 | 0.80mi |
| 1261 NE 2nd St Pompano Beach, FL | 2.0 | 1.0 | 1010 | $2,650 | $2.62 | 22d | 1 | 0.80mi |
| 2701 NE 1st St Pompano Beach, FL | 1.0–2.0 | 1.0 | 662 | $2,200 | $3.32 | 11d | 2 | 0.80mi |
| 105 S Riverside Dr #303 Pompano Beach, FL | 2.0 | 2.0 | 1121 | $2,250 | $2.01 | 24d | 1 | 0.81mi |
| 2412 NE 4th St Pompano Beach, FL | 2.0 | 1.0 | 1000 | $2,600 | $2.60 | 24d | 1 | 0.82mi |
HOA detail condo
- Monthly dues
- $860 · $10,320/yr
- Assessments
- None detected in remarks — confirm with the listing agent.
Listing history 23 events
-
2026-06-18days on market $189,777 Active 56 DOM
-
2026-06-17days on market $189,777 Active 55 DOM
-
2026-06-16days on market $189,777 Active 54 DOM
-
2026-06-15days on market $189,777 Active 53 DOM
-
2026-06-13pricedays on market $189,777 Active 51 DOM
-
2026-06-09days on market $194,999 Active 47 DOM
-
2026-06-08days on market $194,999 Active 46 DOM
-
2026-06-07days on market $194,999 Active 45 DOM
-
2026-06-04days on market $194,999 Active 42 DOM
-
2026-06-03days on market $194,999 Active 41 DOM
-
2026-06-02days on market $194,999 Active 40 DOM
-
2026-06-01days on market $194,999 Active 39 DOM
-
2026-05-31days on market $194,999 Active 38 DOM
-
2026-05-21price $194,999
-
2026-04-22$199,999 Active
-
2026-03-25historical
-
2026-02-11price $194,000
-
2026-01-08price $199,000
-
2025-12-09price $219,000
-
2025-11-21$230,000 Active
-
2020-09-04soldstatus $165,000
-
2002-07-11soldstatus $65,000
-
1993-01-26soldstatus $43,500
ⓘ Source: listings_history table (triggers on properties + properties_extension) + one-shot
backfill from property_details.listing_events for pre-trigger history.
Tax reassessment forecast FL · Resets to sale price
- Current annual tax
- $3,035 · $253/mo
- Projected year-2 tax
- $3,035 · $253/mo
- Expected delta
- $0/yr ($0/mo · 0.0%)
ⓘ Screening estimate from a state-policy table — verify with the county assessor before closing.
Climate risk First Street
- Flood 5/10 Major FEMA zone AH · 23% chance over 30 yrs
- Wildfire 1/10 Low
- Heat 10/10 Extreme 7 d/yr ≥106°F today · 26 d/yr by 30 yrs out
- Wind 10/10 Extreme 99% chance of damaging wind over 30 yrs
- Air quality 2/10 Low 1 unhealthy d/yr today · 2 by 30 yrs out
Nearby sold comps map
Loading sold comps map…
Walkable amenities ~0.75 mi
Loading nearby amenities…
Taxation est. · year 1
- Rental income
- $33,158
- − Mortgage interest
- −$10,630
- − Property taxes
- −$3,035
- − Insurance
- −$2,773
- − Repairs & maintenance
- −$2,653
- − Management
- −$2,653
- − HOA
- −$10,320
- − Depreciation
- −$5,521
- Taxable loss
- −$4,427
- Est. tax savings @ 24.0%
- +$1,062
- After-tax cash flow
- $-814/yr
For passive investors: Depreciation is non-cash, so a rental often shows a tax loss while cash-flowing — sheltering income. Rental losses are passive: they offset passive income freely, and up to $25,000/yr can offset ordinary (W-2) income if you actively participate and your MAGI is under $100k (phasing out to $0 by $150k); unused losses carry forward. On sale, claimed depreciation is recaptured at up to 25%, and gains may owe capital-gains tax (a 1031 exchange can defer both). Figures are a year-1 estimate at your 24.0% rate — not tax advice; consult a CPA.
Schools (NCES district)
- District
- Broward
- NCES district ID
- 1200180
- Math proficiency
- 42% ▼ -18.00%
- Reading proficiency
- 53% ▼ -5.00%
- Median HH income
- $52,139
- Composite
- 40.88/100
- National rank
- #3621
- State rank
- #46 of 73 in FL
Livability — Pompano Beach
- Score
- 74/100
- State rank
- #284
- US rank
- #4541
Category grades
Schools grade is shown separately in the Schools card above.
Census & demographics
- Census place
- Pompano Beach, FL
- County
- Broward County · 1,963,430 people
- City population
- 155,861
- Metro
- Miami-Fort Lauderdale-Pompano Beach, FL
- Population (ZIP)
- 24,920
- Household income
- $83,582
- Rent vs Own
- Severe rent burden
- 1298.0
Population outlook (Broward County) Hauer SSP2
- Today (2025)
- 2,207,033 people
- By 2030
- 2,360,704 · +7.0%
- By 2040
- 2,661,208 · +20.6%
- By 2050
- 2,946,698 · +33.5%
- By 2075
- 3,602,273 · +63.2%
- By 2100
- 3,970,984 · +79.9%
Race, ethnicity, and origin ACS 2023
- Neighborhood character
- Predominantly White (76%)
- Race & ethnicity
- White 76% Hispanic / Latino 16% Two or more races 12% Black 3%
- Hispanic origin (detail)
- Puerto Rican 4% Cuban 3%
- Common ancestry
- Romanian 4% Italian 3% Scotch-Irish 2%
- Foreign-born
- 22% · Canada, Jamaica, Dominican Republic
- Languages at home
- 74% English-only · Spanish 14% Other Indo-European 4% Russian/Polish/Slavic 2%
Political lean MEDSL · Broward
- 2024 margin
- D (+17.0) · D 58.0% · R 41.0%
- 2008→2024 swing
- -17.8pp toward R · 2008: 34.7pp · 2024: 17.0pp
- All cycles
- 2024: D+17.0 2020: D+29.8 2016: D+35.0 2012: D+34.9 2008: D+34.7
Not yet ingested
- Civics
- —
Market trends
- HPI YoY
- ▼ -427.01%
- Current HPI
- 342.9461
- Rent YoY
- ▼ -0.36%
- Metro
- Miami-Fort Lauderdale-Pompano Beach, FL
- State GDP YoY
- ▲ 3.28%
- F500 in state
- 36
Industry mix (Fortune 500 HQ in FL)
| Industry | F500 HQs | Revenue |
|---|---|---|
| Industrial Technology | 2 | $29B |
|
||
| Insurance | 2 | $17B |
|
||
| Retail | 1 | $60B |
|
||
| Technology Distribution | 1 | $58B |
|
||
| Homebuilding | 1 | $35B |
|
||
| Technology Manufacturing | 1 | $35B |
|
||
Price history
+348.3% since first listed10 events — show timeline
- 2026-05-21 Price Changed $194,999 Beaches MLS
- 2026-04-22 Listed $199,999 Beaches MLS
- 2026-03-25 Listing Removed — MARMLS
- 2026-02-11 Price Changed $194,000 MARMLS
- 2026-01-08 Price Changed $199,000 MARMLS
- 2025-12-09 Price Changed $219,000 MARMLS
- 2025-11-21 Listed $230,000 MARMLS
- 2020-09-04 Sold (Public Records) $165,000 Public Records
- 2002-07-11 Sold (Public Records) $65,000 Public Records
- 1993-01-26 Sold (Public Records) $43,500 Public Records
Property tax history
+8.0%/yrLatest (2025): $3,035 · +3.6% YoY. Source: county tax records.
Cash-flow waterfall
monthlySold comps — $/sqft
last 12 mo · ≤1 miLoading sold comps…