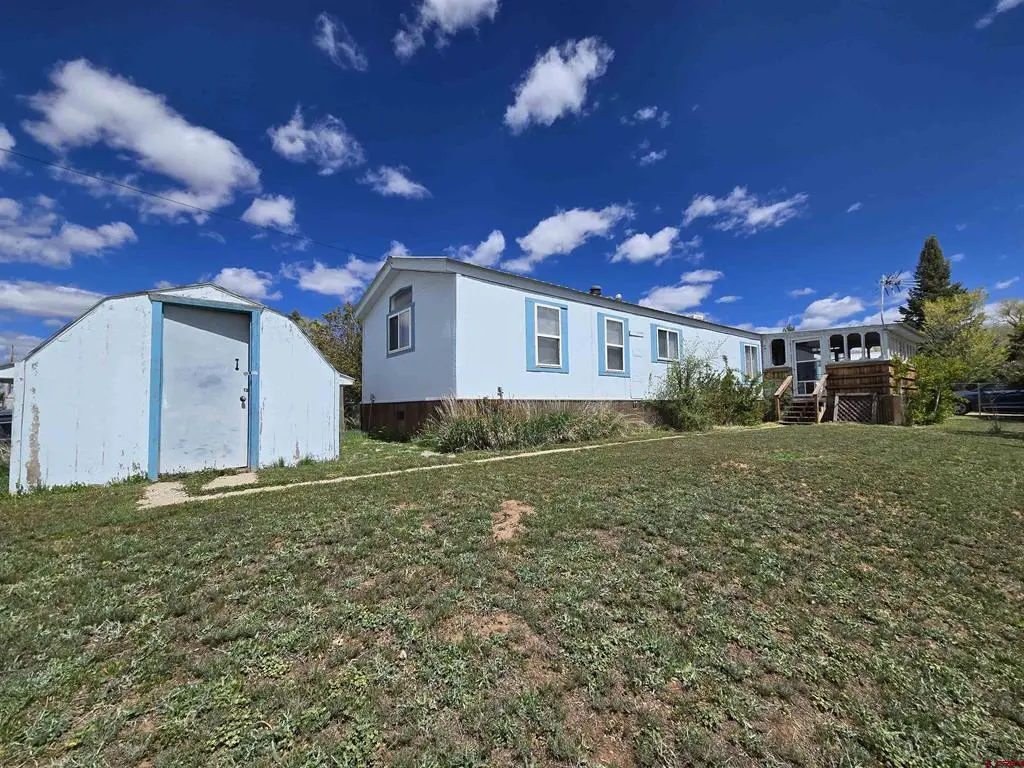
308 W 8th St · Dove Creek, CO
Flood risk 1/10 · Minimal
- FEMA flood zone
- X
- Chance of flooding over 30 yrs
- 0.0%
- Est. flood insurance / yr
- $507 – $1,088
Fire risk 5/10 · Moderate
- Est. fire insurance / yr
- $939 – $1,743
Heat risk 2/10 · Minimal
- Hot days now (above 89°F)
- 3 days/yr
- Hot days in 30 yrs
- 7 days/yr
Wind risk 1/10 · Minimal
- Chance of severe wind over 30 yrs
- —
Air-quality risk 1/10 · Minimal
- Unhealthy air days now
- 0 days/yr
- Unhealthy air days in 30 yrs
- 0 days/yr
Risk factors via First Street. Map © Google.
Why this score? — see what drove the C- grade
The composite is a weighted blend of 9 inputs, each scored 0–100. Each bar is that input's sub-score; the figure is the points it added to the 100-point composite (weight × sub-score).
- Cash flow +18.4/30.0
- Appreciation +7.7/10.0
- ARV discount +7.5/15.0
- DSCR +5.8/10.0
- 1% rule +3.8/10.0
- Livability +3.3/5.0
- Rent growth +2.5/5.0
- Condition / age +2.5/5.0
- Schools +1.5/10.0
$155,000
🖨 Deal sheet (PDF) 📄 Offer letter ✓ Due diligence
Listing remarks
This well-maintained 3-bedroom, 2-bath home sits on a permanent foundation and offers 1,152 square feet of comfortable living space on a . 26-acre lot. Inside, you’ll find an inviting open-concept layout connecting the kitchen and living area - perfect for everyday living or entertaining. Recent updates, including fresh interior paint and modern light fixtures, give the home a clean, updated look. The property features an M & I irrigation tap through DWCD, adding extra value and utility, along with a detached one-car garage for parking or additional storage. Nestled in the quiet and peaceful community of Dove Creek, this home offers small-town charm with room to breathe. Schedule
Key facts
- Recent updates
- Irrigation tap
- Open-concept layout
Tags
Property features AI
Exterior
- Parking: Detached garage; 1 garage space
- Utilities: Public water; Public sewer
- Home design: Single wide mobile home; 1 story; Permanent foundation; Metal roof; Residential single-family zoning
- Construction: Metal roof; Permanent foundation; Single wide mobile home construction
- Exterior features: Corner lot with corners marked; City street frontage; Chain link fencing; Shed(s); Garage(s); Has irrigation water rights; Residential single-family use
Interior
- Kitchen: Dishwasher; Oven; Range; Refrigerator
- Bedrooms: Primary bedroom on the main level
- Flooring: Vinyl
- Bathrooms: 2 full bathrooms
- Heating & cooling: Forced air heating; Has heating
- Interior features: Eat-in kitchen; Kitchen/dining combo; Main level primary; Unfurnished
- Laundry & utility: Washer; Dryer
Neighborhood map
What this means for you Summary
Snapshot
- This is a 3-bed/2.0-bath other listed at $155k.
Deal economics
- At list price, monthly cash flow is $144 ($2k/yr) — positive.
- The deal already cash-flows at list — no discount required.
- To meet the 1% rule (rent ≥ 1% of price), the offer needs to be $137k (11.7% below list).
- Recommended offer: $137k (11.7% below list) — sets the bar for 1% rule.
Location & tenants
- Location reads 66/100 on livability (#135 in CO) — a middle-class / working-renter tenant base. Strengths: cost of living A+, housing A+, employment B; Watch: crime F, amenities F, commute F.
- Dolores County School District Re-2J (rural): math 6% / reading 20% proficiency, ranked #167 of 176 in CO (top 95%) — low school quality limits family demand, transient renter base, plan for 1-2y turnover.
- Zoned schools: Seventh Street Elementary School (math 24% / reading 24%, grade F, #606 of 966 statewide, top 65%, 124 students, 56% FRL); Dove Creek High School (math 10% / reading 30%, grade F, #315 of 381 statewide, top 85%, 139 students, 45% FRL).
- Market conditions: 20 active listings in the ZIP; 16 units permitted in Dolores County in 2024 (0 in 5+ unit buildings).
Forward outlook
- In year one you build about $10k of equity ($1k loan paydown + $8k appreciation (5.5% local appreciation)).
- Dolores County population projected at -33% by 2050 — secular population decline; favor cash flow + early exit over multi-decade hold.
- At projected returns (5.5% appreciation + 3.0% rent growth), your $43k cash investment doubles in ~4 years — after that, you're playing with house money.
- By year 4, paydown + projected appreciation supports a ~$32k cash-out refi (75% LTV) — recoverable capital for the next deal without selling this one.
Negotiation context
- It's been on market 65 days — a 6% lower offer ($146k) is reasonable based on typical stale-listing flexibility.
- Current owner paid $75k; list at $155k implies a 107% gain — meaningful room to come down on a strong offer.
Risks & watch-outs
- Climate carrying-cost: moderate wildfire risk — expect insurance premiums to compound above CPI over the hold.
Questions for the listing agent
- It's been on market 65 days. Have you received any prior offers? Is the seller open to a 12% concession, seller financing, or rate buy-down credit?
- Why hasn't it sold? Are there any deal-killer items the seller is aware of (foundation, flood, title, zoning, code violations)?
- Is there a deadline driving the sale (1031 exchange, divorce, estate, relocation)? That informs how much negotiation room exists.
- Schools are F-rated, which usually means shorter tenancies and higher turnover. Who's the typical renter profile here, and what's been the actual vacancy rate?
- Crime grade is F in this area — have there been break-ins, vandalism, or insurance claims at this property in the last 3 years? What carrier currently insures it and at what premium?
- What's the average days-on-market for RENTAL listings here right now (not sales)? A rising rental-DOM trend means longer vacancies and softer asking-rent achievability than the comps imply.
- What's the recent tenant-quality profile in this submarket — average credit score on applications, eviction rate, late-payment / NSF rate, and stable-employment percentage? A property-management company in the area should have these aggregated.
- How much new for-sale + rental construction is in the pipeline within 1–3 miles? Heavy new supply typically softens prices + rents 12–24 months out; constrained supply supports both.
Investment metrics
- 1% rule
- 0.88% ✗
- Cap rate
- 7.40%
- Cash-on-cash
- 3.97%
- DSCR
- 1.18
- GRM
- 9.4
CMA / ARV
No comps found within radius.
Projected returns pro-forma
5.45% appreciation · 3.0% rent growth · sell at horizon
- IRR
- 17.3%
- Equity multiple
- 2.13×
- Total profit
- $48,846
- Equity at exit
- $92,128
- IRR
- 17.3%
- Equity multiple
- 4.18×
- Total profit
- $137,881
- Equity at exit
- $162,666
Cash invested: $43,400 (down + closing). Projections, not guarantees.
Landlord ↔ Tenant lean methodology
- Overall (STATE)
- 38 Tenant-Leaning
- State Colorado
- 38 Tenant-Leaning · D+4
- County
- — inherits STATE
- City
- — inherits STATE
ZIP-level market 81324
- Home prices YoY
- 2.6%
- Active inventory
- 20
- Price-to-rent
- 9.4×
Monthly cashflow live
- Estimated rent
- $1,369 medium interval (Pro) →
- Mortgage (P&I)
- −$813
- Tax from tax record
- −$61 /mo · $727/yr
- Insurance
- −$65
- HOA
- −$0
- Vacancy / Maint / Mgmt
- −$288
- Net cashflow
- $144
Break-even live
Sensitivity live
| Price | -10% $231 | -5% $188 | +0% $144 | +5% $100 | +10% $56 |
|---|---|---|---|---|---|
| Rent | -10% $35 | -5% $90 | +0% $144 | +5% $198 | +10% $252 |
| Rate | -1.0pp $222 | -0.5pp $183 | base $144 | +0.5pp $103 | +1.0pp $63 |
UW: 25.0% down · 7.5% · 30yr · 1.5% tax · 5.0% vac · 8.0% maint · 8.0% mgmt
Financing live
Cash to close
- Down payment
- $38,750
- Closing costs
- $4,650
- Reserves months
- —
- Total cash needed
- —
Loan-product check · same deal, 3 products live
Conventional
25% down · 7.5% · 30yr
- Down + closing
- —
- Monthly P&I
- —
- Monthly cashflow
- —
- DSCR
- —
- Eligible?
- —
Personal DTI + credit; lowest rate.
DSCR
20% down · 8.5% · 30yr
- Down + closing
- —
- Monthly P&I
- —
- Monthly cashflow
- —
- DSCR
- —
- Eligible?
- —
No personal income docs; deal must DSCR.
Hard money
10% down · 12.0% · 12mo
- Down + closing
- —
- Monthly P&I
- —
- Monthly cashflow
- —
- DSCR
- —
- Eligible?
- —
Short-term bridge; refi at stabilization.
Listing history 22 events
-
2026-06-21days on market $155,000 Active 65 DOM
-
2026-06-19days on market $155,000 Active 63 DOM
-
2026-06-18days on market $155,000 Active 62 DOM
-
2026-06-17days on market $155,000 Active 61 DOM
-
2026-06-16days on market $155,000 Active 60 DOM
-
2026-06-15days on market $155,000 Active 59 DOM
-
2026-06-14days on market $155,000 Active 57 DOM
-
2026-06-12days on market $155,000 Active 56 DOM
-
2026-06-09days on market $155,000 Active 53 DOM
-
2026-06-09price $155,000 Active 52 DOM
-
2026-06-08days on market $159,400 Active 52 DOM
-
2026-06-07days on market $159,400 Active 51 DOM
-
2026-06-05days on market $159,400 Active 48 DOM
-
2026-06-03days on market $159,400 Active 47 DOM
-
2026-06-02days on market $159,400 Active 46 DOM
-
2026-06-01days on market $159,400 Active 45 DOM
-
2026-05-31days on market $159,400 Active 44 DOM
-
2026-05-30days on market $159,400 Active 43 DOM
-
2026-05-18price $159,400
-
2026-04-17$164,500 Active
-
2009-12-14soldstatus $75,000
-
1996-10-18soldstatus $34,000
ⓘ Source: listings_history table (triggers on properties + properties_extension) + one-shot
backfill from property_details.listing_events for pre-trigger history.
Tax reassessment forecast CO · Resets to sale price
- Current annual tax
- $727 · $61/mo
- Projected year-2 tax
- $852 · $71/mo
- Expected delta
- +$125/yr (+$10/mo · 17.2%)
ⓘ Screening estimate from a state-policy table — verify with the county assessor before closing.
Climate risk First Street
- Flood 1/10 Low FEMA zone X · 0% chance over 30 yrs
- Wildfire 5/10 Major
- Heat 2/10 Low 3 d/yr ≥89°F today · 7 d/yr by 30 yrs out
- Wind 1/10 Low
- Air quality 1/10 Low 0 unhealthy d/yr today · 0 by 30 yrs out
Nearby sold comps map
Loading sold comps map…
Walkable amenities ~0.75 mi
Loading nearby amenities…
Taxation est. · year 1
- Rental income
- $16,430
- − Mortgage interest
- −$8,682
- − Property taxes
- −$727
- − Insurance
- −$775
- − Repairs & maintenance
- −$1,314
- − Management
- −$1,314
- − Depreciation
- −$4,509
- Taxable loss
- −$892
- Est. tax savings @ 24.0%
- +$214
- After-tax cash flow
- $1,938/yr
For passive investors: Depreciation is non-cash, so a rental often shows a tax loss while cash-flowing — sheltering income. Rental losses are passive: they offset passive income freely, and up to $25,000/yr can offset ordinary (W-2) income if you actively participate and your MAGI is under $100k (phasing out to $0 by $150k); unused losses carry forward. On sale, claimed depreciation is recaptured at up to 25%, and gains may owe capital-gains tax (a 1031 exchange can defer both). Figures are a year-1 estimate at your 24.0% rate — not tax advice; consult a CPA.
Schools (NCES district)
- District
- Dolores County School District Re-2J
- NCES district ID
- 0803420
- Math proficiency
- 6% ▼ -14.00%
- Reading proficiency
- 20% ▬ 0.00%
- Median HH income
- $39,413
- Composite
- 14.6/100
- National rank
- #14405
- State rank
- #167 of 176 in CO
Livability — Dove Creek
- Score
- 66/100
- State rank
- #135
- US rank
- #11387
Category grades
Schools grade is shown separately in the Schools card above.
Census & demographics
- Census place
- Dove Creek, CO
- Population (ZIP)
- 1,639
Population outlook (Dolores County) Hauer SSP2
- Today (2025)
- 1,762 people
- By 2030
- 1,634 · -7.3%
- By 2040
- 1,386 · -21.3%
- By 2050
- 1,185 · -32.7%
- By 2075
- 966 · -45.2%
- By 2100
- 811 · -54.0%
Race, ethnicity, and origin ACS 2023
- Neighborhood character
- Predominantly White (80%)
- Race & ethnicity
- White 80% Hispanic / Latino 16% Two or more races 10%
- Hispanic origin (detail)
- Mexican 16%
- Common ancestry
- Scottish 3% Serbian 3% Iranian 2%
- Languages at home
- 87% English-only · Spanish 11% German/W. Germanic 1%
Political lean MEDSL · Dolores
- 2024 margin
- Solid R (+52.9) · D 22.9% · R 75.8% · Other 1.3%
- 2008→2024 swing
- -16.0pp toward R · 2008: -36.9pp · 2024: -52.9pp
- All cycles
- 2024: R+52.9 2020: R+51.6 2016: R+57.6 2012: R+41.8 2008: R+36.9
Not yet ingested
- Civics
- —
Market trends
- HPI YoY
- ▲ 5.45%
- Current HPI
- 211.1044
- Rent YoY
- —
- Metro
- —
- State GDP YoY
- ▲ 1.95%
- F500 in state
- 14
Industry mix (Fortune 500 HQ in CO)
| Industry | F500 HQs | Revenue |
|---|---|---|
| Technology Distribution | 1 | $31B |
|
||
| Food / Agriculture | 1 | $18B |
|
||
| Packaging | 1 | $14B |
|
||
| Healthcare | 1 | $13B |
|
||
| Energy | 1 | $10B |
|
||
| Technology | 1 | $4B |
|
||
Price history
+368.8% since first listed4 events — show timeline
- 2026-05-18 Price Changed $159,400 cren
- 2026-04-17 Listed $164,500 cren
- 2009-12-14 Sold (Public Records) $75,000 Public Records
- 1996-10-18 Sold (Public Records) $34,000 Public Records
Property tax history
+7.0%/yrLatest (2025): $727 · +92.6% YoY. Source: county tax records.
Cash-flow waterfall
monthlySold comps — $/sqft
last 12 mo · ≤1 miLoading sold comps…