4412 E Mulberry St #270 · Fort Collins, CO
Flood risk 1/10 · Minimal
- FEMA flood zone
- X (unshaded)
- Chance of flooding over 30 yrs
- 0.0%
- Est. flood insurance / yr
- $507 – $1,088
Fire risk 3/10 · Minor
- Est. fire insurance / yr
- $939 – $1,743
Heat risk 3/10 · Minor
- Hot days now (above 92°F)
- 7 days/yr
- Hot days in 30 yrs
- 19 days/yr
Wind risk 1/10 · Minimal
- Chance of severe wind over 30 yrs
- —
Air-quality risk 6/10 · Moderate
- Unhealthy air days now
- 13 days/yr
- Unhealthy air days in 30 yrs
- 13 days/yr
Risk factors via First Street. Map © Google.
Why this score? — see what drove the B+ grade
The composite is a weighted blend of 9 inputs, each scored 0–100. Each bar is that input's sub-score; the figure is the points it added to the 100-point composite (weight × sub-score).
- Cash flow +30.0/30.0
- ARV discount +15.0/15.0
- 1% rule +10.0/10.0
- DSCR +10.0/10.0
- Schools +4.5/10.0
- Livability +4.0/5.0
- Rent growth +3.5/5.0
- Condition / age +2.5/5.0
- Appreciation +0.0/10.0
$130,000
🖨 Deal sheet (PDF) 📄 Offer letter ✓ Due diligence
Listing remarks
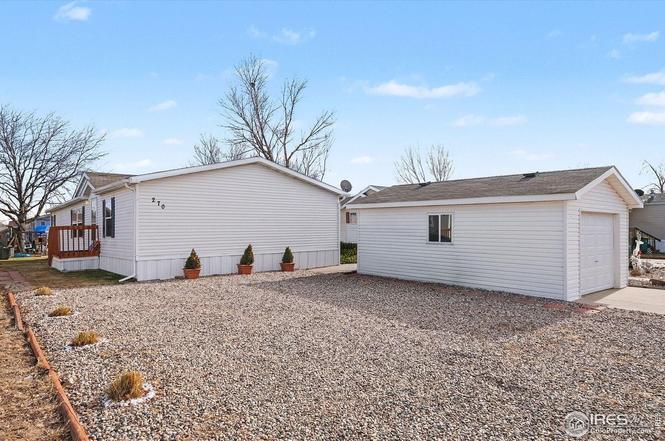
Check out this spacious and beautifully maintained double-wide located in Cloverleaf Park. 3-bedrooms, 2-bath, 1500sf and a garage! This home offers an open and functional layout with a large kitchen featuring a butcher block island, abundant cabinet space, and seamless flow between the living room - perfect for everyday living and entertaining. The home showcases luxury vinyl plank flooring throughout (no carpet!), central A/C, and a remodeled primary bathroom complete with tile floors, a new double vanity, and updated sinks. Washer and dryer are included for added convenience. Outside, you'll appreciate the brick patio, wheelchair-accessible ramp from the detached one-car garage, and rare
Key facts
- Tile floors
- Large kitchen
- Butcher block island
Tags
Property features AI
Finance
- HOA & community: No association fees
Exterior
- Parking: Carport
- Utilities: City water (meter installed); Public sewer; Natural gas available; Electricity available; Cable available; High-speed internet available
- Home design: Manufactured in park; Mobile home; Builder: Skyline
- Construction: Vinyl siding; Composition roof
- Exterior features: Ramp access; No stairs; Minimal flood or C rating
Interior
- Kitchen: Electric range; Dishwasher; Refrigerator; Microwave
- Bedrooms: 3 bedrooms
- Bathrooms: 2 full bathrooms
- Heating & cooling: Forced air heating; Central air conditioning
- Interior features: Eat-in kitchen; Open floorplan; Workshop; Kitchen island
- Laundry & utility: Washer; Dryer
Neighborhood map
What this means for you Summary
Snapshot
- This is a 3-bed/2.0-bath manufactured listed at $130k.
Deal economics
- At list price, monthly cash flow is $1k ($15k/yr) — positive.
- The deal already cash-flows at list — no discount required.
- Meets the 1% rule at list price ($3k rent vs $130k).
- Recommended offer: $114k (12.0% below list) — sets the bar for market timing.
- Cap rate 18.0% vs local median 2.6% in Fort Collins — top-decile yield for the area; either an underpriced asset or a hidden risk that comps aren't pricing in. Stress-test before assuming the spread holds.
Location & tenants
- Location reads 80/100 on livability (#11 in CO, #1,750 nationally) — a professional / high-income tenant draw. Strengths: amenities A+, commute A+, health & safety A+; Watch: cost of living F.
- Poudre School District R-1 (urban): math 45% / reading 60% proficiency, ranked #10 of 86 in CO (top 12%) — acceptable for families but not a draw, mixed tenant base, ~2y average lease.
- Market conditions: Rents rising fast (+4.1%/yr); 422 active listings in the ZIP; 6 comparable units currently listed for rent nearby; rentals at typical pace (median 22d on market — plan ~3-4 weeks tenant-placement turnaround); solid renter incomes; 1,786 units permitted in Larimer County in 2024 (402 in 5+ unit buildings).
- This rent runs 37% of the median local income ($85k/yr) — at the standard rent-burdened threshold; future hikes will face affordability resistance.
Forward outlook
- Local home prices are declining (-3.0%/yr); year-one equity from $899 of loan paydown is wiped out by about $4k of value loss. Plan a longer hold.
- Larimer County population projected at +51% by 2050 — long-run rental-demand tailwind backs the buy-and-hold thesis.
- At projected returns (-3.0% appreciation + 4.1% rent growth), your $36k cash investment doubles in ~3 years — after that, you're playing with house money.
Negotiation context
- It's been on market 125 days — a 12% lower offer ($114k) is reasonable based on typical stale-listing flexibility.
- 2 sale attempts since 17y ago with the ask held roughly flat each time — persistent listings suggest the price (not the market) is what's stuck; bring a comps-based counter.
Questions for the listing agent
- It's been on market 125 days. Have you received any prior offers? Is the seller open to a 12% concession, seller financing, or rate buy-down credit?
- Why hasn't it sold? Are there any deal-killer items the seller is aware of (foundation, flood, title, zoning, code violations)?
- Is there a deadline driving the sale (1031 exchange, divorce, estate, relocation)? That informs how much negotiation room exists.
- Schools are B-rated — typically a magnet for longer-tenancy family renters. What's the average tenant stay here, and is there a school-zone premium baked into asking?
- What's the average days-on-market for RENTAL listings here right now (not sales)? A rising rental-DOM trend means longer vacancies and softer asking-rent achievability than the comps imply.
- What's the recent tenant-quality profile in this submarket — average credit score on applications, eviction rate, late-payment / NSF rate, and stable-employment percentage? A property-management company in the area should have these aggregated.
- How much new for-sale + rental construction is in the pipeline within 1–3 miles? Heavy new supply typically softens prices + rents 12–24 months out; constrained supply supports both.
Investment metrics
- 1% rule
- 2.01% ✓
- Cap rate
- 18.02%
- Cash-on-cash
- 41.87%
- DSCR
- 2.86
- GRM
- 4.1
CMA / ARV
- ARV (on-the-fly)
- $214,704
- Comps found
- 8
Show comp detail 8 sales within ~0.75 mi
| Address | Dist | Beds/Ba | Sqft | Sold | Price | $/sf | Match |
|---|---|---|---|---|---|---|---|
| 648 Brandt Cir | 0.32mi | 2/2.0 (-1) | 1,504 (-0%) | 13mo | $205,000 | $136 | 69 |
| 922 Pleasure Dr | 0.56mi | 3/2.0 | 1,448 (-4%) | 1mo | $197,900 | $137 | 66 |
| 4408 Espirit Dr | 0.56mi | 3/2.0 | 1,616 (+7%) | 7mo | $230,000 | $142 | 57 |
| 826 Sunchase Dr | 0.51mi | 2/2.0 (-1) | 1,448 (-4%) | 13mo | $205,000 | $142 | 53 |
| 919 Vitala Dr | 0.57mi | 2/2.0 (-1) | 1,556 (+3%) | 14mo | $220,000 | $141 | 52 |
| 4465 Espirit Dr | 0.58mi | 2/2.0 (-1) | 1,561 (+3%) | 13mo | $220,000 | $141 | 51 |
| 961 Sunchase Dr | 0.63mi | 2/2.0 (-1) | 1,352 (-11%) | 2mo | $205,000 | $152 | 46 |
| 909 Sunchase Dr | 0.56mi | 2/2.0 (-1) | 1,616 (+7%) | 14mo | $230,000 | $142 | 46 |
Match score weights: distance 35% · size 25% · config 20% · recency 20%. Top-matched comps best support the ARV.
Projected returns pro-forma
-3.0% appreciation · 4.13% rent growth · sell at horizon
- IRR
- 39.7%
- Equity multiple
- 2.73×
- Total profit
- $62,813
- Equity at exit
- $19,383
- IRR
- 46.6%
- Equity multiple
- 5.71×
- Total profit
- $171,399
- Equity at exit
- $11,240
Cash invested: $36,400 (down + closing). Projections, not guarantees.
Landlord ↔ Tenant lean methodology
- Overall (STATE)
- 38 Tenant-Leaning
- State Colorado
- 38 Tenant-Leaning · D+4
- County
- — inherits STATE
- City
- — inherits STATE
ZIP-level market 80524
- Rents YoY
- 4.1%
- Active inventory
- 422
- Price-to-rent
- 4.1×
Monthly cashflow live
- Estimated rent
- $2,617 high interval (Pro) →
- Mortgage (P&I)
- −$682
- Tax from tax record
- −$61 /mo · $736/yr
- Insurance
- −$54
- HOA
- −$0
- Vacancy / Maint / Mgmt
- −$550
- Net cashflow
- $1,270
Break-even live
Sensitivity live
| Price | -10% $1,344 | -5% $1,307 | +0% $1,270 | +5% $1,233 | +10% $1,196 |
|---|---|---|---|---|---|
| Rent | -10% $1,063 | -5% $1,167 | +0% $1,270 | +5% $1,373 | +10% $1,477 |
| Rate | -1.0pp $1,336 | -0.5pp $1,303 | base $1,270 | +0.5pp $1,236 | +1.0pp $1,202 |
UW: 25.0% down · 7.5% · 30yr · 1.5% tax · 5.0% vac · 8.0% maint · 8.0% mgmt
Financing live
Cash to close
- Down payment
- $32,500
- Closing costs
- $3,900
- Reserves months
- —
- Total cash needed
- —
Loan-product check · same deal, 3 products live
Conventional
25% down · 7.5% · 30yr
- Down + closing
- —
- Monthly P&I
- —
- Monthly cashflow
- —
- DSCR
- —
- Eligible?
- —
Personal DTI + credit; lowest rate.
DSCR
20% down · 8.5% · 30yr
- Down + closing
- —
- Monthly P&I
- —
- Monthly cashflow
- —
- DSCR
- —
- Eligible?
- —
No personal income docs; deal must DSCR.
Hard money
10% down · 12.0% · 12mo
- Down + closing
- —
- Monthly P&I
- —
- Monthly cashflow
- —
- DSCR
- —
- Eligible?
- —
Short-term bridge; refi at stabilization.
Rent comps 6 comps
| Address | Beds | Baths | Sqft | Rent | $/sqft | DOM | Units | Dist |
|---|---|---|---|---|---|---|---|---|
| 4692 Palamino Ln Fort Collins, CO | 3.0 | 2.5 | 1606 | $2,600 | $1.62 | 22d | 1 | 0.37mi |
| 908 Rollins Den Dr Fort Collins, CO | 4.0 | 2.0 | 1888 | $3,080 | $1.63 | 14d | 1 | 0.69mi |
| 802 Waterglen Dr Fort Collins, CO | 3.0 | 2.5 | 1285 | $2,075 | $1.61 | 24d | 2 | 0.94mi |
| 505 N Aria Way Fort Collins, CO | 3.0 | 2.0 | 1779 | $2,800 | $1.57 | 24d | 1 | 1.22mi |
| 3210 Sykes Dr Fort Collins, CO | 3.0 | 2.5 | 1485 | $2,700 | $1.82 | 14d | 1 | 1.35mi |
| 3950 Celtic Ln Fort Collins, CO | 3.0 | 2.5 | 1538 | $2,600 | $1.69 | 14d | 1 | 1.40mi |
Listing history 18 events
-
2026-06-18days on market $130,000 Active 125 DOM
-
2026-06-17days on market $130,000 Active 124 DOM
-
2026-06-16days on market $130,000 Active 123 DOM
-
2026-06-15days on market $130,000 Active 122 DOM
-
2026-06-14days on market $130,000 Active 120 DOM
-
2026-06-10days on market $130,000 Active 117 DOM
-
2026-06-09days on market $130,000 Active 116 DOM
-
2026-06-08days on market $130,000 Active 115 DOM
-
2026-06-07days on market $130,000 Active 114 DOM
-
2026-06-03days on market $130,000 Active 110 DOM
-
2026-06-02days on market $130,000 Active 109 DOM
-
2026-06-01days on market $130,000 Active 108 DOM
-
2026-05-31days on market $130,000 Active 107 DOM
-
2026-05-30days on market $130,000 Active 106 DOM
-
2026-03-05price $130,000
-
2026-02-13$135,000 Active
-
2010-06-26historical
-
2009-03-22$59,900
ⓘ Source: listings_history table (triggers on properties + properties_extension) + one-shot
backfill from property_details.listing_events for pre-trigger history.
Tax reassessment forecast CO · Resets to sale price
- Current annual tax
- $736 · $61/mo
- Projected year-2 tax
- $736 · $61/mo
- Expected delta
- $0/yr ($0/mo · 0.0%)
ⓘ Screening estimate from a state-policy table — verify with the county assessor before closing.
Climate risk First Street
- Flood 1/10 Low FEMA zone X (unshaded) · 0% chance over 30 yrs
- Wildfire 3/10 Moderate
- Heat 3/10 Moderate 7 d/yr ≥92°F today · 19 d/yr by 30 yrs out
- Wind 1/10 Low
- Air quality 6/10 Major 13 unhealthy d/yr today · 13 by 30 yrs out
Nearby sold comps map
Loading sold comps map…
Walkable amenities ~0.75 mi
Loading nearby amenities…
Taxation est. · year 1
- Rental income
- $31,402
- − Mortgage interest
- −$7,282
- − Property taxes
- −$736
- − Insurance
- −$650
- − Repairs & maintenance
- −$2,512
- − Management
- −$2,512
- − Depreciation
- −$3,782
- Taxable income
- $13,928
- Est. tax owed @ 24.0%
- −$3,343
- After-tax cash flow
- $11,898/yr
For passive investors: Depreciation is non-cash, so a rental often shows a tax loss while cash-flowing — sheltering income. Rental losses are passive: they offset passive income freely, and up to $25,000/yr can offset ordinary (W-2) income if you actively participate and your MAGI is under $100k (phasing out to $0 by $150k); unused losses carry forward. On sale, claimed depreciation is recaptured at up to 25%, and gains may owe capital-gains tax (a 1031 exchange can defer both). Figures are a year-1 estimate at your 24.0% rate — not tax advice; consult a CPA.
Schools (NCES district)
- District
- Poudre School District R-1
- NCES district ID
- 0803990
- Math proficiency
- 45% ▼ -7.00%
- Reading proficiency
- 60% ▼ -2.00%
- Median HH income
- $57,281
- Composite
- 45.5/100
- National rank
- #2610
- State rank
- #10 of 86 in CO
Livability — Fort Collins
- Score
- 80/100
- State rank
- #11
- US rank
- #1750
Category grades
Schools grade is shown separately in the Schools card above.
Census & demographics
- County
- Larimer County · 338,255 people
- City population
- 202,303
- Metro
- Fort Collins, CO
- Population (ZIP)
- 40,030
- Household income
- $85,035
- Rent vs Own
- Severe rent burden
- 1860.0
Population outlook (Larimer County) Hauer SSP2
- Today (2025)
- 415,361 people
- By 2030
- 457,762 · +10.2%
- By 2040
- 542,310 · +30.6%
- By 2050
- 627,048 · +51.0%
- By 2075
- 833,722 · +100.7%
- By 2100
- 952,590 · +129.3%
Race, ethnicity, and origin ACS 2023
- Neighborhood character
- Predominantly White (77%)
- Race & ethnicity
- White 77% Hispanic / Latino 17% Two or more races 11% Asian 1% Native American 1%
- Hispanic origin (detail)
- Mexican 13%
- Common ancestry
- Slovak 3% Portuguese 3% Italian 3%
- Foreign-born
- 8% · Canada
- Languages at home
- 88% English-only · Spanish 10% German/W. Germanic 1%
Political lean MEDSL · Larimer
- 2024 margin
- D (+17.6) · D 57.4% · R 39.8% · Other 2.9%
- 2008→2024 swing
- +7.9pp toward D · 2008: 9.7pp · 2024: 17.6pp
- All cycles
- 2024: D+17.6 2020: D+15.4 2016: D+4.9 2012: D+5.2 2008: D+9.7
Not yet ingested
- Civics
- —
Market trends
- HPI YoY
- ▼ -581.67%
- Current HPI
- 274.4026
- Rent YoY
- ▲ 4.13%
- Metro
- Fort Collins, CO
- State GDP YoY
- ▲ 1.95%
- F500 in state
- 14
Industry mix (Fortune 500 HQ in CO)
| Industry | F500 HQs | Revenue |
|---|---|---|
| Technology Distribution | 1 | $31B |
|
||
| Food / Agriculture | 1 | $18B |
|
||
| Packaging | 1 | $14B |
|
||
| Healthcare | 1 | $13B |
|
||
| Energy | 1 | $10B |
|
||
| Technology | 1 | $4B |
|
||
Price history
+117.0% since first listed4 events — show timeline
- 2026-03-05 Price Changed $130,000 IRES
- 2026-02-13 Listed $135,000 IRES
- 2010-06-26 Listing Removed — IRES
- 2009-03-22 Listed $59,900 IRES
Property tax history
+6.4%/yrLatest (2025): $736 · +656.7% YoY. Source: county tax records.
Cash-flow waterfall
monthlySold comps — $/sqft
last 12 mo · ≤1 miLoading sold comps…