 🌊 Lakefront
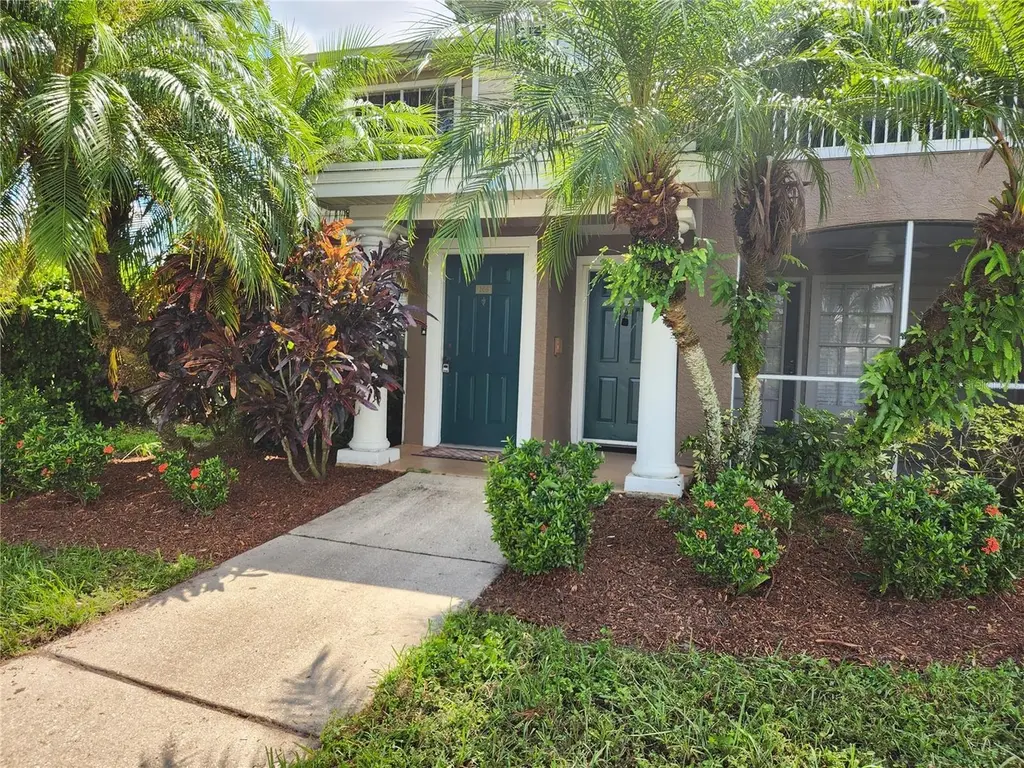
8933 Manor Loop #105 · Lakewood Ranch, FL
Flood risk 1/10 · Minimal
- FEMA flood zone
- X (shaded)
- Chance of flooding over 30 yrs
- 0.0%
- Est. flood insurance / yr
- $507 – $1,088
Fire risk 1/10 · Minimal
- Est. fire insurance / yr
- $947 – $1,759
Heat risk 10/10 · Severe
- Hot days now (above 108°F)
- 7 days/yr
- Hot days in 30 yrs
- 29 days/yr
Wind risk 10/10 · Severe
- Chance of severe wind over 30 yrs
- 99.0%
Air-quality risk 3/10 · Minor
- Unhealthy air days now
- 2 days/yr
- Unhealthy air days in 30 yrs
- 2 days/yr
Risk factors via First Street. Map © Google.
Why this score? — see what drove the D- grade
The composite is a weighted blend of 9 inputs, each scored 0–100. Each bar is that input's sub-score; the figure is the points it added to the 100-point composite (weight × sub-score).
- Cash flow +7.7/30.0
- ARV discount +7.5/15.0
- 1% rule +4.4/10.0
- Appreciation +4.4/10.0
- Schools +4.4/10.0
- Livability +2.5/5.0
- Condition / age +2.5/5.0
- Rent growth +2.4/5.0
- DSCR +1.8/10.0
$219,900
🖨 Deal sheet 📄 Offer letter ✓ Due diligence
Listing remarks
Virtually Staged. FABULOUS LAKE VIEWS FROM THIS FIRST FLOOR CONDO IN LAKEWOOD RANCH! Village at Town Park 2 Bedroom, 2 Bathroom condo that has been freshly painted, new carpet in bedrooms, faux wood blinds, tiled Living Room. The kitchen has granite counters, stainless steel appliances, and there is a full size washer & dryer in the hallway. French door access to the front screened portch, with the DIRECT LAKEFRONT & FOUNTAIN VIEWS! Plus extra storage closet. Primary Bedroom has a large walk-n closet & Ensuite Bathroom, & extra windows. 2nd Bedroom also has a walk-in closet. Both bathrooms are upgraded & have tub/shower combo. Exra large storage closet under the
Key facts
- Fitness center
- Clubhouse
- Lake views
Tags
Property features AI
Finance
- Other: Association contact: David Daly
- Financial info: Total monthly fees: $419; Total annual fees: $5,028; Lease restrictions apply
- HOA & community: Monthly condo fee: $419 (includes common area taxes, pool, escrow reserves, structure and grounds maintenance, management, recreational facilities, trash); Association requires approval; Association amenities: clubhouse, fitness center, pool, playground; Community features: association-owned recreation, clubhouse, community mailbox, deed restrictions, fitness center, no truck/RV/motorcycle parking, playground, pool, sidewalks; Pets allowed with restrictions (breed and number limits)
Exterior
- Parking: Parking available on the side of the building
- Utilities: Public water; Public sewer; Electricity connected; Cable available; Fiber optics available; High‑speed internet / broadband available; Underground utilities
- Home design: Condominium; One story; Front entrance faces the lake
- Construction: Vinyl siding; Shingle roof; Slab foundation; Built as part of building number 8933
- Exterior features: Covered front porch with screened area; Playground on site; Sidewalks; North-facing with lake view; Lake frontage (20 feet)
Interior
- Kitchen: Dishwasher; Disposal; Microwave; Range; Refrigerator; Solid surface counters; Eat-in kitchen
- Bedrooms: 2 bedrooms
- Flooring: Carpet; Ceramic tile
- Bathrooms: 2 full bathrooms
- Heating & cooling: Central heating (electric); Central air
- Interior features: Ceiling fans; Eat-in kitchen; Solid surface counters; Split bedroom floor plan; Thermostat; Walk-in closet(s); Blinds
- Laundry & utility: Inside laundry in a laundry closet; Washer; Dryer; Electric water heater; Inside utility room
Neighborhood map
What this means for you Summary
Snapshot
- This is a 2-bed/2.0-bath condo listed at $220k.
Deal economics
- At list price, monthly cash flow is $-252 ($-3k/yr) — negative.
- To cash-flow at today's rent, offer at most $175k (20.2% below list).
- To meet the 1% rule (rent ≥ 1% of price), the offer needs to be $208k (5.6% below list).
- Recommended offer: $175k (20.2% below list) — sets the bar for cash-flow.
- Cap rate 4.9% vs local median 3.3% in Lakewood Ranch — top-decile yield for the area; either an underpriced asset or a hidden risk that comps aren't pricing in. Stress-test before assuming the spread holds.
Location & tenants
- Location reads: area grade D — affects rentability + tenant quality, not the cash-flow math above.
- Manatee (suburban): math 54% / reading 50% proficiency, ranked #26 of 73 in FL (top 36%) — acceptable for families but not a draw, mixed tenant base, ~2y average lease.
- Zoned schools: Robert Willis Elementary School (math 83% / reading 79%, grade A+, #95 of 2,144 statewide, top 5%, 765 students, 22% FRL); Lakewood Ranch High School (math 47% / reading 63%, grade C, #135 of 667 statewide, top 20%, 2,435 students, 22% FRL) — zoned schools average 22% FRL vs 51% district-wide (28 pts lower); this property's tenant base skews higher-income than the district average.
- Zoned-school proficiency averages 68% at this address vs 52% district-wide (+16 pts) — the actual schools serving this property are materially stronger than the Manatee average implies; a family-tenant draw the district grade alone would hide.
- Market conditions: Rents soft (-0.5%/yr); 497 active listings in the ZIP; 14 comparable units currently listed for rent nearby; rentals at typical pace (median 24d on market — plan ~3-4 weeks tenant-placement turnaround); high-income renter base; 7,472 units permitted in Manatee County in 2024 (1,782 in 5+ unit buildings).
Forward outlook
- Local home prices are declining (-1.2%/yr); year-one equity from $2k of loan paydown is wiped out by about $3k of value loss. Plan a longer hold.
- Manatee County population projected at +43% by 2050 — long-run rental-demand tailwind backs the buy-and-hold thesis.
Negotiation context
- Only 7 days on market — expect competitive offers; lowballing is unlikely to land.
- 4 sale attempts since 20y ago with the ask held roughly flat each time — persistent listings suggest the price (not the market) is what's stuck; bring a comps-based counter.
Risks & watch-outs
- Watch-outs: HOA is 20% of rent.
- Climate carrying-cost: severe wind risk, 99% chance of damaging wind over 30y; extreme-heat days projected 7→29/yr by 2055 (HVAC capex compounding) — expect insurance premiums to compound above CPI over the hold.
Questions for the listing agent
- What do current leases actually rent for vs. the listed asking? Can we see a recent rent roll and the last 12 months of T-12 income?
- What does the HOA fee cover, when was the last increase, and are there any pending special assessments or reserve-fund shortfalls?
- Any open or pending special assessments — roof, HVAC, plumbing, elevator, façade? What's the per-unit balance and payoff schedule, and is the seller paying it off at close or rolling it to the buyer?
- Is there a deadline driving the sale (1031 exchange, divorce, estate, relocation)? That informs how much negotiation room exists.
- The area grade is low — what's the realistic commute time and amenity access for the typical tenant pool here? Any planned neighborhood developments (good or bad) we should know about?
- This sits on a lake — are riparian / water-frontage rights deeded with the parcel? Any dock permits, shoreline easements, or HOA water-use restrictions?
- What's the documented flood / surge / shoreline-erosion history here (FEMA AND non-FEMA — e.g., storm surge, creek backup, septic-field saturation)?
- Any water-quality or seasonal algae-bloom issues that affect tenant satisfaction or short-term-rental demand?
- What's the average days-on-market for RENTAL listings here right now (not sales)? A rising rental-DOM trend means longer vacancies and softer asking-rent achievability than the comps imply.
- What's the recent tenant-quality profile in this submarket — average credit score on applications, eviction rate, late-payment / NSF rate, and stable-employment percentage? A property-management company in the area should have these aggregated.
- How much new apartment / multifamily construction is in the pipeline within 1–3 miles? Heavy new supply (>2% of stock underway) typically softens rents 12–24 months out; light construction supports rent growth.
Investment metrics
- 1% rule
- 0.94% ✗
- Cap rate
- 4.92%
- Cash-on-cash
- -4.91%
- DSCR
- 0.78
- GRM
- 8.8
CMA / ARV
No comps found within radius.
Projected returns pro-forma
-1.2% appreciation · 0.0% rent growth · sell at horizon
- IRR
- -16.1%
- Equity multiple
- 0.34×
- Total profit
- $-40,393
- Equity at exit
- $50,991
- IRR
- -13.2%
- Equity multiple
- -0.01×
- Total profit
- $-62,394
- Equity at exit
- $51,783
Cash invested: $61,572 (down + closing). Projections, not guarantees.
Landlord ↔ Tenant lean methodology
- Overall (STATE)
- 87 Strongly Landlord-Friendly
- State Florida
- 87 Strongly Landlord-Friendly · R+3
- County
- — inherits STATE
- City
- — inherits STATE
ZIP-level market 34202
- Home prices YoY
- -0.5%
- Rents YoY
- -0.5%
- Active inventory
- 497
- Price-to-rent
- 8.8×
Monthly cashflow live
- Estimated rent
- $2,077 high interval (Pro) →
- Mortgage (P&I)
- −$1,153
- Tax from tax record
- −$229 /mo · $2,746/yr
- Insurance
- −$92
- HOA
- −$419
- Vacancy / Maint / Mgmt
- −$436
- Net cashflow
- $-252
Break-even live
UW: 25.0% down · 7.5% · 30yr · 1.5% tax · 5.0% vac · 8.0% maint · 8.0% mgmt
Financing live
Cash to close
- Down payment
- $54,975
- Closing costs
- $6,597
- Reserves months
- —
- Total cash needed
- —
Loan-product check · same deal, 3 products live
Conventional
25% down · 7.5% · 30yr
- Down + closing
- —
- Monthly P&I
- —
- Monthly cashflow
- —
- DSCR
- —
- Eligible?
- —
Personal DTI + credit; lowest rate.
DSCR
20% down · 8.5% · 30yr
- Down + closing
- —
- Monthly P&I
- —
- Monthly cashflow
- —
- DSCR
- —
- Eligible?
- —
No personal income docs; deal must DSCR.
Hard money
10% down · 12.0% · 12mo
- Down + closing
- —
- Monthly P&I
- —
- Monthly cashflow
- —
- DSCR
- —
- Eligible?
- —
Short-term bridge; refi at stabilization.
Rent comps 14 comps
| Address | Beds | Baths | Sqft | Rent | $/sqft | DOM | Units | Dist |
|---|---|---|---|---|---|---|---|---|
| 8932 Manor Loop #205 Lakewood Ranch, FL | 2.0 | 2.0 | 1080 | $1,900 | $1.76 | 23d | 1 | 0.03mi |
| 8926 Manor Loop Lakewood Ranch, FL | 2.0–3.0 | 2.0 | 1165 | $1,800 | $1.55 | 23d | 2 | 0.03mi |
| 8917 Manor Loop #205 Lakewood Ranch, FL | 2.0 | 2.0 | 1080 | $2,150 | $1.99 | 23d | 1 | 0.07mi |
| 7411 Vista Way #203 Bradenton, FL | 2.0 | 2.0 | 1080 | $1,800 | $1.67 | 23d | 1 | 0.23mi |
| 8925 77th Ter E Lakewood Ranch, FL | 1.0–2.0 | 1.0–2.0 | 1049 | $4,200 | $4.00 | 15d | 67 | 0.23mi |
| 8858 White Sage Loop Lakewood Ranch, FL | 2.0 | 2.5 | 1064 | $1,900 | $1.79 | 3d | 1 | 0.35mi |
| 8828 White Sage Loop Lakewood Ranch, FL | 2.0 | 2.5 | 1092 | $1,975 | $1.81 | 3d | 1 | 0.43mi |
| 8809 White Sage Loop Lakewood Ranch, FL | 2.0 | 2.5 | 1064 | $2,200 | $2.07 | 11d | 1 | 0.43mi |
| 8808 White Sage Loop Lakewood Ranch, FL | 2.0 | 2.5 | 1092 | $2,300 | $2.11 | 23d | 1 | 0.45mi |
| 7350 Black Walnut Way Lakewood Ranch, FL | 2.0 | 2.5 | 1064 | $1,995 | $1.88 | 23d | 1 | 0.50mi |
| 7341 Black Walnut Way Lakewood Ranch, FL | 2.0 | 2.5 | 1100 | $2,300 | $2.09 | 23d | 1 | 0.53mi |
| 8100 Natures Way Lakewood Ranch, FL | 1.0–3.0 | 1.0–2.0 | 1091 | $1,926 | $1.76 | 1d | 19 | 0.75mi |
| 8240 Lakewood Ranch Blvd Bradenton, FL | 1.0–3.0 | 1.0–2.0 | 1021 | $1,949 | $1.91 | 3d | 18 | 1.03mi |
| 6325 Health Park Way Lakewood Ranch, FL | 1.0–3.0 | 1.0–2.0 | 1114 | $3,038 | $2.73 | 3d | 22 | 1.11mi |
HOA detail condo
- Monthly dues
- $419 · $5,028/yr
- Assessments
- None detected in remarks — confirm with the listing agent.
Listing history 7 events
-
2026-06-18days on market $219,900 Active 7 DOM
-
2026-06-17days on market $219,900 Active 6 DOM
-
2026-06-16days on market $219,900 Active 5 DOM
-
2026-06-15pricedays on market $219,900 Active 4 DOM
-
2026-06-13days on market $229,900 Active 2 DOM
-
2026-06-13remarks 679-char remark
-
2026-06-13$229,900 Active 1 DOM
ⓘ Source: listings_history table (triggers on properties + properties_extension) + one-shot
backfill from property_details.listing_events for pre-trigger history.
Tax reassessment forecast FL · Resets to sale price
- Current annual tax
- $2,746 · $229/mo
- Projected year-2 tax
- $2,746 · $229/mo
- Expected delta
- $0/yr ($0/mo · 0.0%)
ⓘ Screening estimate from a state-policy table — verify with the county assessor before closing.
Climate risk First Street
- Flood 1/10 Low FEMA zone X (shaded) · 0% chance over 30 yrs
- Wildfire 1/10 Low
- Heat 10/10 Extreme 7 d/yr ≥108°F today · 29 d/yr by 30 yrs out
- Wind 10/10 Extreme 99% chance of damaging wind over 30 yrs
- Air quality 3/10 Moderate 2 unhealthy d/yr today · 2 by 30 yrs out
Nearby sold comps map
Loading sold comps map…
Walkable amenities ~0.75 mi
Loading nearby amenities…
Taxation est. · year 1
- Rental income
- $24,922
- − Mortgage interest
- −$12,318
- − Property taxes
- −$2,746
- − Insurance
- −$1,100
- − Repairs & maintenance
- −$1,994
- − Management
- −$1,994
- − HOA
- −$5,028
- − Depreciation
- −$6,397
- Taxable loss
- −$6,654
- Est. tax savings @ 24.0%
- +$1,597
- After-tax cash flow
- $-1,426/yr
For passive investors: Depreciation is non-cash, so a rental often shows a tax loss while cash-flowing — sheltering income. Rental losses are passive: they offset passive income freely, and up to $25,000/yr can offset ordinary (W-2) income if you actively participate and your MAGI is under $100k (phasing out to $0 by $150k); unused losses carry forward. On sale, claimed depreciation is recaptured at up to 25%, and gains may owe capital-gains tax (a 1031 exchange can defer both). Figures are a year-1 estimate at your 24.0% rate — not tax advice; consult a CPA.
Schools (NCES district)
- District
- Manatee
- NCES district ID
- 1201230
- Math proficiency
- 54% ▼ -6.00%
- Reading proficiency
- 50% ▼ -2.00%
- Median HH income
- $49,607
- Composite
- 44.43/100
- National rank
- #2806
- State rank
- #26 of 73 in FL
Livability — Lakewood Ranch
No livability data for this city. (Only ~50 U.S. cities are tracked.)
Census & demographics
- County
- Manatee County · 416,364 people
- City population
- 52,177
- Metro
- North Port-Sarasota-Bradenton, FL
- Population (ZIP)
- 27,197
- Household income
- $121,659
- Rent vs Own
- Severe rent burden
- 574.0
Population outlook (Manatee County) Hauer SSP2
- Today (2025)
- 447,342 people
- By 2030
- 488,911 · +9.3%
- By 2040
- 567,934 · +27.0%
- By 2050
- 637,995 · +42.6%
- By 2075
- 781,970 · +74.8%
- By 2100
- 848,272 · +89.6%
Race, ethnicity, and origin ACS 2023
- Neighborhood character
- Predominantly White (80%)
- Race & ethnicity
- White 80% Two or more races 10% Hispanic / Latino 9% Asian 3% Black 2%
- Hispanic origin (detail)
- Puerto Rican 4% Cuban 2%
- Common ancestry
- Romanian 4% Italian 4% Slovak 3%
- Foreign-born
- 12% · Canada, Vietnam, China
- Languages at home
- 88% English-only · Spanish 5% Arabic 1% Other Asian/Pacific 1%
Political lean MEDSL · Manatee
- 2024 margin
- Strong R (+23.5) · D 37.9% · R 61.4%
- 2008→2024 swing
- -16.5pp toward R · 2008: -7.0pp · 2024: -23.5pp
- All cycles
- 2024: R+23.5 2020: R+16.1 2016: R+17.1 2012: R+12.5 2008: R+7.0
Not yet ingested
- Civics
- —
Market trends
- HPI YoY
- ▼ -1.20%
- Current HPI
- 240.7087
- Rent YoY
- ▼ -0.54%
- Metro
- North Port-Sarasota-Bradenton, FL
- State GDP YoY
- ▲ 3.28%
- F500 in state
- 36
Industry mix (Fortune 500 HQ in FL)
| Industry | F500 HQs | Revenue |
|---|---|---|
| Industrial Technology | 2 | $29B |
|
||
| Insurance | 2 | $17B |
|
||
| Retail | 1 | $60B |
|
||
| Technology Distribution | 1 | $58B |
|
||
| Homebuilding | 1 | $35B |
|
||
| Technology Manufacturing | 1 | $35B |
|
||
Price history
+6.9% since first listed11 events — show timeline
- 2026-06-11 Listed $229,900 Stellar MLS as Distributed by MLS Grid
- 2026-01-27 Rental Removed $1,675 STELLARMLS
- 2025-10-29 Price Changed $1,675 STELLARMLS
- 2025-10-08 Price Changed $1,695 STELLARMLS
- 2025-08-03 Price Changed $1,750 STELLARMLS
- 2025-07-20 Price Changed $1,800 STELLARMLS
- 2025-07-08 Listed for Rent $1,900 STELLARMLS
- 2008-01-10 Listing Removed — Stellar MLS as Distributed by MLS Grid
- 2007-03-07 Listed $199,000 Stellar MLS as Distributed by MLS Grid
- 2006-03-04 Listed $249,000 Stellar MLS as Distributed by MLS Grid
- 2005-12-28 Sold (Public Records) $215,000 Public Records
Property tax history
+9.4%/yrLatest (2025): $2,746 · -1.7% YoY. Source: county tax records.
Cash-flow waterfall
monthlySold comps — $/sqft
last 12 mo · ≤1 miLoading sold comps…