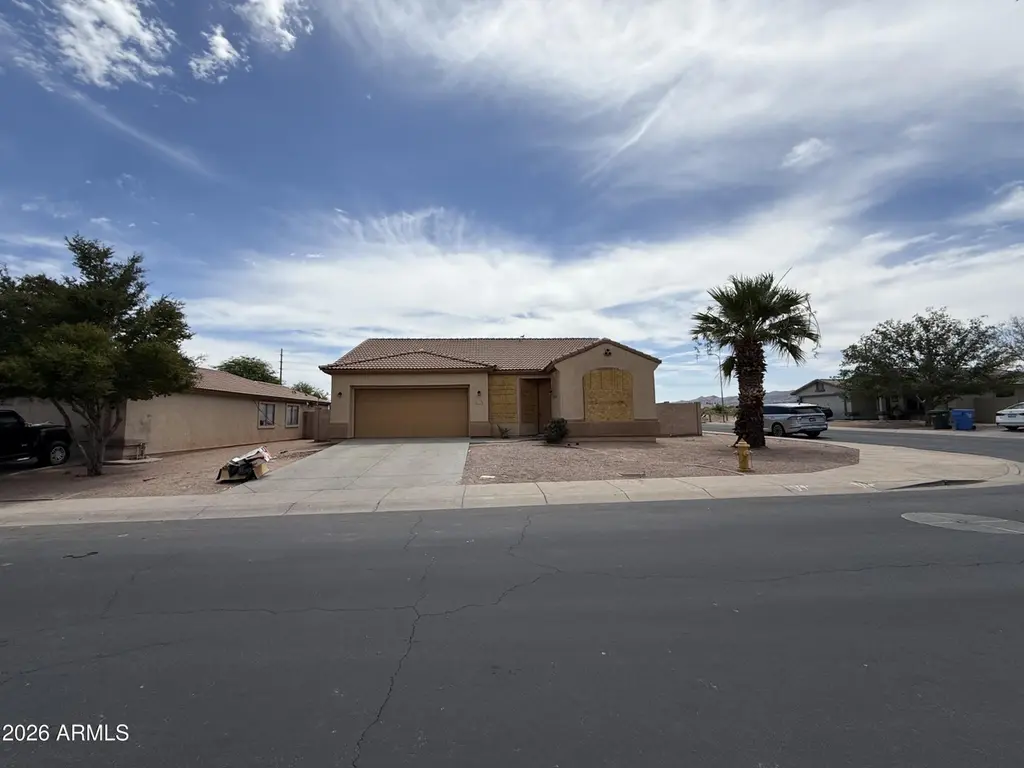
6537 S 15th Dr · Phoenix, AZ
Flood risk 1/10 · Minimal
- FEMA flood zone
- X (shaded)
- Chance of flooding over 30 yrs
- 0.0%
- Est. flood insurance / yr
- $507 – $1,088
Fire risk 4/10 · Minor
- Est. fire insurance / yr
- $610 – $1,132
Heat risk 9/10 · Severe
- Hot days now (above 111°F)
- 7 days/yr
- Hot days in 30 yrs
- 19 days/yr
Wind risk 1/10 · Minimal
- Chance of severe wind over 30 yrs
- —
Air-quality risk 2/10 · Minimal
- Unhealthy air days now
- 2 days/yr
- Unhealthy air days in 30 yrs
- 2 days/yr
Risk factors via First Street. Map © Google.
Why this score? — see what drove the D+ grade
The composite is a weighted blend of 9 inputs, each scored 0–100. Each bar is that input's sub-score; the figure is the points it added to the 100-point composite (weight × sub-score).
- ARV discount +15.0/15.0
- Cash flow +14.4/30.0
- DSCR +4.4/10.0
- Livability +3.8/5.0
- 1% rule +3.3/10.0
- Condition / age +2.5/5.0
- Rent growth +2.3/5.0
- Schools +1.0/10.0
- Appreciation +0.0/10.0
$259,900
🖨 Deal sheet 📄 Offer letter ✓ Due diligence
Listing remarks MLS
This home is not a Short Sale or Lender Owned. Easy to show! Beautifully kept and newly painted inside. This home is a great starter home. Large backyard to make into your own setting. Your buyers will not be dissapointed.
Key facts
- Attached bathroom
- Large backyard
- Covered patio
Tags
Property features AI
Finance
- Other: Lot approximately 7,618 sq ft (assessor); Assessor building area source
- HOA & community: Monthly association fee of $99 (association provides other services—see remarks)
Exterior
- Parking: Covered parking for 2; 2-car garage
- Utilities: City water; Public sewer
- Home design: Single family residence; Fee simple ownership
- Construction: Stucco and painted wood frame construction; Tile roof
- Exterior features: Block fencing; Desert front yard
Interior
- Kitchen: Eat-in kitchen
- Bedrooms: 3 possible bedrooms
- Bathrooms: 2 full bathrooms
- Heating & cooling: Electric heating; Central air conditioning
- Interior features: Eat-in kitchen; Master bedroom with 3/4 bath
- Laundry & utility: Laundry details: see remarks
Neighborhood map
What this means for you Summary
Snapshot
- This is a 3-bed/3.0-bath single-family listed at $260k.
Deal economics
- At list price, monthly cash flow is $52 ($625/yr) — positive.
- The deal already cash-flows at list — no discount required.
- To meet the 1% rule (rent ≥ 1% of price), the offer needs to be $216k (16.9% below list).
- Recommended offer: $216k (16.9% below list) — sets the bar for 1% rule.
- Cap rate 6.5% vs local median 3.3% in Phoenix — top-decile yield for the area; either an underpriced asset or a hidden risk that comps aren't pricing in. Stress-test before assuming the spread holds.
Location & tenants
- Location reads 75/100 on livability (#16 in AZ, #3,924 nationally) — a middle-class / working-renter tenant base. Strengths: amenities A+, commute A+, housing A+; Watch: health & safety C-, crime F.
- Roosevelt Elementary District (4279) (urban): math 8% / reading 14% proficiency, ranked #234 of 249 in AZ (top 94%) — low school quality limits family demand, transient renter base, plan for 1-2y turnover.
- Zoned schools: Ignacio Conchos School (math 2% / reading 8%, grade F, #1,084 of 1,109 statewide, top 99%, 328 students, 86% FRL) — zoned schools average 86% FRL vs 36% district-wide (50 pts higher); higher-poverty schools than district average — tighter screening recommended.
- Market conditions: Rents soft (-0.8%/yr); 252 active listings in the ZIP; 26 comparable units currently listed for rent nearby; rentals leasing fast (median 1d on market — plan ~1-2 weeks tenant-placement turnaround); solid renter incomes; 36,011 units permitted in Maricopa County in 2024 (12,801 in 5+ unit buildings).
- This rent runs 34% of the median local income ($75k/yr) — at the standard rent-burdened threshold; future hikes will face affordability resistance.
Forward outlook
- Local home prices are declining (-3.0%/yr); year-one equity from $2k of loan paydown is wiped out by about $8k of value loss. Plan a longer hold.
- Maricopa County population projected at +38% by 2050 — long-run rental-demand tailwind backs the buy-and-hold thesis.
Negotiation context
- Only 9 days on market — expect competitive offers; lowballing is unlikely to land.
- 9 sale attempts since 22y ago with the ask held roughly flat each time — persistent listings suggest the price (not the market) is what's stuck; bring a comps-based counter.
- Current owner paid $93k; list at $260k implies a 179% gain — meaningful room to come down on a strong offer.
Risks & watch-outs
- Climate carrying-cost: extreme-heat days projected 7→19/yr by 2055 (HVAC capex compounding) — expect insurance premiums to compound above CPI over the hold.
Questions for the listing agent
- What does the HOA fee cover, when was the last increase, and are there any pending special assessments or reserve-fund shortfalls?
- Is there a deadline driving the sale (1031 exchange, divorce, estate, relocation)? That informs how much negotiation room exists.
- Crime grade is F in this area — have there been break-ins, vandalism, or insurance claims at this property in the last 3 years? What carrier currently insures it and at what premium?
- The area grade is low — what's the realistic commute time and amenity access for the typical tenant pool here? Any planned neighborhood developments (good or bad) we should know about?
- What's the average days-on-market for RENTAL listings here right now (not sales)? A rising rental-DOM trend means longer vacancies and softer asking-rent achievability than the comps imply.
- What's the recent tenant-quality profile in this submarket — average credit score on applications, eviction rate, late-payment / NSF rate, and stable-employment percentage? A property-management company in the area should have these aggregated.
- How much new for-sale + rental construction is in the pipeline within 1–3 miles? Heavy new supply typically softens prices + rents 12–24 months out; constrained supply supports both.
Investment metrics
- 1% rule
- 0.83% ✗
- Cap rate
- 6.53%
- Cash-on-cash
- 0.86%
- DSCR
- 1.04
- GRM
- 10.0
CMA / ARV
- ARV (on-the-fly)
- $314,974
- Comps found
- 12
Show comp detail 12 sales within ~0.75 mi
| Address | Dist | Beds/Ba | Sqft | Sold | Price | $/sf | Match |
|---|---|---|---|---|---|---|---|
| 6434 S 10th Dr | 0.30mi | 2/2.0 (-1) | 1,152 (+2%) | 0mo | $320,000 | $278 | 74 |
| 5807 S 13th Ave | 0.50mi | 3/2.0 | 1,128 (-0%) | 2mo | $400,000 | $355 | 70 |
| 904 W Saint Charles Ave | 0.41mi | 2/2.0 (-1) | 1,152 (+2%) | 1mo | $320,000 | $278 | 69 |
| 910 W St Anne Ave | 0.39mi | 3/2.0 | 1,208 (+7%) | 3mo | $349,900 | $290 | 64 |
| 6216 S 16th Ln | 0.27mi | 3/2.0 | 1,298 (+15%) | 0mo | $357,500 | $275 | 59 |
| 713 W Saint Charles Ave | 0.50mi | 3/2.0 | 1,207 (+6%) | 10mo | $345,000 | $286 | 53 |
| 6614 S 18th Ln | 0.44mi | 3/2.0 | 1,279 (+13%) | 1mo | $351,000 | $274 | 53 |
| 1832 W Lydia Ln | 0.41mi | 3/2.0 | 1,279 (+13%) | 3mo | $342,000 | $267 | 53 |
| 1760 W Sunland Ave | 0.71mi | 3/2.0 | 1,212 (+7%) | 8mo | $315,000 | $260 | 44 |
| 401 W Vineyard Rd | 0.73mi | 3/2.0 | 1,240 (+9%) | 6mo | $355,000 | $286 | 41 |
| 1747 W Maldonado Rd | 0.41mi | 4/2.0 (+1) | 1,296 (+14%) | 8mo | $352,000 | $272 | 41 |
| 812 W Saint Charles Ave | 0.47mi | 2/1.0 (-1) | 964 (-15%) | 2mo | $310,000 | $322 | 39 |
Match score weights: distance 35% · size 25% · config 20% · recency 20%. Top-matched comps best support the ARV.
Projected returns pro-forma
-3.0% appreciation · 0.0% rent growth · sell at horizon
- IRR
- -18.1%
- Equity multiple
- 0.38×
- Total profit
- $-45,181
- Equity at exit
- $38,752
- IRR
- -17.0%
- Equity multiple
- 0.18×
- Total profit
- $-59,757
- Equity at exit
- $22,471
Cash invested: $72,772 (down + closing). Projections, not guarantees.
Landlord ↔ Tenant lean methodology
- Overall (STATE)
- 87 Strongly Landlord-Friendly
- State Arizona
- 87 Strongly Landlord-Friendly · R+3
- County
- — inherits STATE
- City
- — inherits STATE
ZIP-level market 85041
- Home prices YoY
- -33.0%
- Rents YoY
- -0.8%
- Active inventory
- 252
- Price-to-rent
- 10.0×
Monthly cashflow live
- Estimated rent
- $2,160 high interval (Pro) →
- Mortgage (P&I)
- −$1,363
- Tax from tax record
- −$103 /mo · $1,240/yr
- Insurance
- −$108
- HOA
- −$80
- Vacancy / Maint / Mgmt
- −$454
- Net cashflow
- $52
Break-even live
UW: 25.0% down · 7.5% · 30yr · 1.5% tax · 5.0% vac · 8.0% maint · 8.0% mgmt
Financing live
Cash to close
- Down payment
- $64,975
- Closing costs
- $7,797
- Reserves months
- —
- Total cash needed
- —
Loan-product check · same deal, 3 products live
Conventional
25% down · 7.5% · 30yr
- Down + closing
- —
- Monthly P&I
- —
- Monthly cashflow
- —
- DSCR
- —
- Eligible?
- —
Personal DTI + credit; lowest rate.
DSCR
20% down · 8.5% · 30yr
- Down + closing
- —
- Monthly P&I
- —
- Monthly cashflow
- —
- DSCR
- —
- Eligible?
- —
No personal income docs; deal must DSCR.
Hard money
10% down · 12.0% · 12mo
- Down + closing
- —
- Monthly P&I
- —
- Monthly cashflow
- —
- DSCR
- —
- Eligible?
- —
Short-term bridge; refi at stabilization.
Rent comps 26 comps
| Address | Beds | Baths | Sqft | Rent | $/sqft | DOM | Units | Dist |
|---|---|---|---|---|---|---|---|---|
| 6614 S 10th Dr Phoenix, AZ | 3.0 | 2.0 | 1347 | $2,200 | $1.63 | 16d | 1 | 0.29mi |
| 1016 W Lydia Ln Phoenix, AZ | 3.0 | 2.0 | 1263 | $1,875 | $1.48 | 11d | 1 | 0.32mi |
| 5926 S 12th Ln Phoenix, AZ | 4.0 | 2.0 | 1470 | $2,695 | $1.83 | 24d | 1 | 0.42mi |
| 6055 S 11th Ave Phoenix, AZ | 2.0–3.0 | 1.0–2.0 | 956 | $1,600 | $1.67 | 1d | 7 | 0.42mi |
| 916 W Carter Rd Phoenix, AZ | 3.0 | 2.0 | 1350 | $2,199 | $1.63 | 14d | 1 | 0.49mi |
| 1807 W Carter Rd Phoenix, AZ | 4.0 | 2.0 | 1376 | $2,400 | $1.74 | 1d | 1 | 0.50mi |
| 5636 S 12th Ln Phoenix, AZ | 4.0 | 2.0 | 1470 | $2,695 | $1.83 | 1d | 1 | 0.58mi |
| 6224 S 20th Gln Phoenix, AZ | 3.0 | 2.0 | 1289 | $1,300 | $1.01 | 12d | 1 | 0.73mi |
| 2050 W Southern Ave Unit 2 Phoenix, AZ | 2.0 | 2.0 | 907 | $1,438 | $1.59 | 3d | 1 | 0.75mi |
| 2050 W Southern Ave Phoenix, AZ | 2.0 | 2.0 | 907 | $1,438 | $1.59 | 1d | 1 | 0.75mi |
| 915 W Bowker St Phoenix, AZ | 3.0 | 2.0 | 1455 | $1,850 | $1.27 | 1d | 1 | 0.75mi |
| 6821 S Montezuma St Phoenix, AZ | 3.0–4.0 | 2.5–3.0 | 1469 | $1,845 | $1.26 | 1d | 11 | 0.85mi |
| 5405 S 19th Ave Phoenix, AZ | 1.0–3.0 | 1.0–2.0 | 867 | $1,570 | $1.81 | 1d | 4 | 0.87mi |
| 5646 S Montezuma St Apt 9 Phoenix, AZ | 2.0 | 1.0 | 850 | $1,150 | $1.35 | 1d | 1 | 0.90mi |
| 2141 W Pecan Rd Phoenix, AZ | 3.0 | 2.0 | 1244 | $1,710 | $1.37 | 5d | 1 | 1.05mi |
| 5609 S Central Ave Phoenix, AZ | 1.0–2.0 | 1.0–2.0 | 893 | $1,175 | $1.32 | 1d | 6 | 1.25mi |
| 40 E Sunland Ave Phoenix, AZ | 1.0–2.0 | 1.0–1.5 | 700 | $1,400 | $2.00 | 1d | 18 | 1.29mi |
| 136 W Latona Rd Phoenix, AZ | 3.0 | 2.5 | 1499 | $2,350 | $1.57 | 1d | 1 | 1.31mi |
| 207 W Latona Rd Phoenix, AZ | 3.0 | 2.0 | 1319 | $2,205 | $1.67 | 1d | 1 | 1.31mi |
| 2410 W La Salle St Unit NA Phoenix, AZ | 3.0 | 2.0 | 1400 | $3,500 | $2.50 | 1d | 1 | 1.32mi |
| 2414 W La Salle St Phoenix, AZ | 3.0 | 2.0 | 1232 | $2,400 | $1.95 | 16d | 1 | 1.33mi |
| 105 W Latona Rd Phoenix, AZ | 3.0 | 2.5 | 1499 | $2,350 | $1.57 | 1d | 1 | 1.34mi |
| 2440 W Bowker St Phoenix, AZ | 3.0 | 2.0 | 1411 | $2,295 | $1.63 | 11d | 1 | 1.35mi |
| 2321 W Mobile Ln Phoenix, AZ | 4.0 | 2.0 | 1390 | $2,220 | $1.60 | 24d | 1 | 1.35mi |
| 2321 W Mobile Ln Phoenix, AZ | 4.0 | 2.0 | 1390 | $2,210 | $1.59 | 1d | 1 | 1.35mi |
| 300 E Jessie Owens Pkwy Phoenix, AZ | 1.0–3.0 | 1.0–2.0 | 916 | $1,666 | $1.82 | 1d | 1 | 1.36mi |
HOA detail
- Monthly dues
- $80 · $960/yr
Listing history 7 events
-
2026-06-18days on market $259,900 Active 9 DOM
-
2026-06-17days on market $259,900 Active 8 DOM
-
2026-06-16days on market $259,900 Active 7 DOM
-
2026-06-15days on market $259,900 Active 6 DOM
-
2026-06-13days on market $259,900 Active 4 DOM
-
2026-06-13days on market $259,900 Active 3 DOM
-
2026-06-10$259,900 Active 1 DOM
ⓘ Source: listings_history table (triggers on properties + properties_extension) + one-shot
backfill from property_details.listing_events for pre-trigger history.
Tax reassessment forecast AZ · Resets to sale price
- Current annual tax
- $1,240 · $103/mo
- Projected year-2 tax
- $1,715 · $143/mo
- Expected delta
- +$476/yr (+$40/mo · 38.4%)
ⓘ Screening estimate from a state-policy table — verify with the county assessor before closing.
Climate risk First Street
- Flood 1/10 Low FEMA zone X (shaded) · 0% chance over 30 yrs
- Wildfire 4/10 Moderate
- Heat 9/10 Extreme 7 d/yr ≥111°F today · 19 d/yr by 30 yrs out
- Wind 1/10 Low
- Air quality 2/10 Low 2 unhealthy d/yr today · 2 by 30 yrs out
Nearby sold comps map
Loading sold comps map…
Walkable amenities ~0.75 mi
Loading nearby amenities…
Taxation est. · year 1
- Rental income
- $25,924
- − Mortgage interest
- −$14,558
- − Property taxes
- −$1,240
- − Insurance
- −$1,300
- − Repairs & maintenance
- −$2,074
- − Management
- −$2,074
- − HOA
- −$960
- − Depreciation
- −$7,561
- Taxable loss
- −$3,842
- Est. tax savings @ 24.0%
- +$922
- After-tax cash flow
- $1,548/yr
For passive investors: Depreciation is non-cash, so a rental often shows a tax loss while cash-flowing — sheltering income. Rental losses are passive: they offset passive income freely, and up to $25,000/yr can offset ordinary (W-2) income if you actively participate and your MAGI is under $100k (phasing out to $0 by $150k); unused losses carry forward. On sale, claimed depreciation is recaptured at up to 25%, and gains may owe capital-gains tax (a 1031 exchange can defer both). Figures are a year-1 estimate at your 24.0% rate — not tax advice; consult a CPA.
Schools (NCES district)
- District
- Roosevelt Elementary District (4279)
- NCES district ID
- 0407080
- Math proficiency
- 8% ▼ -13.00%
- Reading proficiency
- 14% ▼ -8.00%
- Median HH income
- $42,813
- Composite
- 9.74/100
- National rank
- #9829
- State rank
- #234 of 249 in AZ
Livability — Phoenix
- Score
- 75/100
- State rank
- #16
- US rank
- #3924
Category grades
Schools grade is shown separately in the Schools card above.
Census & demographics
- Census place
- Phoenix, AZ
- County
- Maricopa County · 4,537,380 people
- City population
- 1,500,198
- Metro
- Phoenix-Mesa-Chandler, AZ
- Population (ZIP)
- 63,862
- Household income
- $75,301
- Rent vs Own
- Severe rent burden
- 1473.0
Population outlook (Maricopa County) Hauer SSP2
- Today (2025)
- 4,979,203 people
- By 2030
- 5,378,229 · +8.0%
- By 2040
- 6,156,598 · +23.6%
- By 2050
- 6,872,376 · +38.0%
- By 2075
- 8,401,270 · +68.7%
- By 2100
- 9,247,439 · +85.7%
Race, ethnicity, and origin ACS 2023
- Neighborhood character
- Predominantly Hispanic (66%)
- Race & ethnicity
- Hispanic / Latino 66% Two or more races 28% Black 15% White 13% Native American 3% Asian 2%
- Hispanic origin (detail)
- Mexican 60%
- Common ancestry
- Romanian 1% Lithuanian 1% Slovak 1%
- Foreign-born
- 24% · Canada, Vietnam
- Languages at home
- 49% English-only · Spanish 45% Other Asian/Pacific 1% Other Indo-European 1%
Political lean MEDSL · Maricopa
- 2024 margin
- Toss-up / Even · D 47.7% · R 51.2% · Other 1.1%
- 2008→2024 swing
- +7.1pp toward D · 2008: -10.6pp · 2024: -3.5pp
- All cycles
- 2024: R+3.5 2020: D+2.2 2016: R+3.5 2012: R+12.0 2008: R+10.6
Not yet ingested
- Civics
- —
Market trends
- HPI YoY
- ▼ -168.81%
- Current HPI
- 342.4961
- Rent YoY
- ▼ -0.84%
- Metro
- Phoenix-Mesa-Chandler, AZ
- State GDP YoY
- ▲ 4.54%
- F500 in state
- 20
Industry mix (Fortune 500 HQ in AZ)
| Industry | F500 HQs | Revenue |
|---|---|---|
| Technology | 2 | $13B |
|
||
| Mining / Metals | 1 | $23B |
|
||
| Environmental Services | 1 | $16B |
|
||
| Metals / Steel | 1 | $14B |
|
||
| Technology Distribution | 1 | $9B |
|
||
| Homebuilding | 1 | $8B |
|
||
Price history
+319.8% since first listed25 events — show timeline
- 2026-06-08 Listed $259,900 ARMLS
- 2012-06-20 Sold (Public Records) $93,000 Public Records
- 2012-06-18 Sold (MLS) $93,000 ARMLS
- 2012-06-06 Pending — ARMLS
- 2012-06-04 Listed $94,900 ARMLS
- 2010-05-05 Listing Removed — ARMLS
- 2010-04-29 Relisted — ARMLS
- 2010-04-13 Pending — ARMLS
- 2010-03-31 Relisted — ARMLS
- 2010-03-28 Pending — ARMLS
- 2010-02-04 Listed $83,500 ARMLS
- 2009-10-22 Sold (MLS) $61,000 ARMLS
- 2009-10-09 Listing Removed — ARMLS
- 2009-08-28 Listed $64,900 ARMLS
- 2007-03-30 Sold (Public Records) $189,000 Public Records
- 2007-02-27 Sold (MLS) $189,000 ARMLS
- 2007-01-20 Listing Removed — ARMLS
- 2007-01-17 Listing Removed — ARMLS
- 2007-01-12 Listed $187,500 ARMLS
- 2006-11-13 Listed $216,000 ARMLS
- 2004-09-16 Sold (Public Records) $138,000 Public Records
- 2004-08-31 Sold (MLS) $138,000 ARMLS
- 2004-08-03 Listing Removed — ARMLS
- 2004-06-29 Listed $140,000 ARMLS
- 2002-10-21 Sold (Public Records) $61,913 Public Records
Property tax history
-0.8%/yrLatest (2025): $1,240 · +2.6% YoY. Source: county tax records.
Cash-flow waterfall
monthlySold comps — $/sqft
last 12 mo · ≤1 miLoading sold comps…