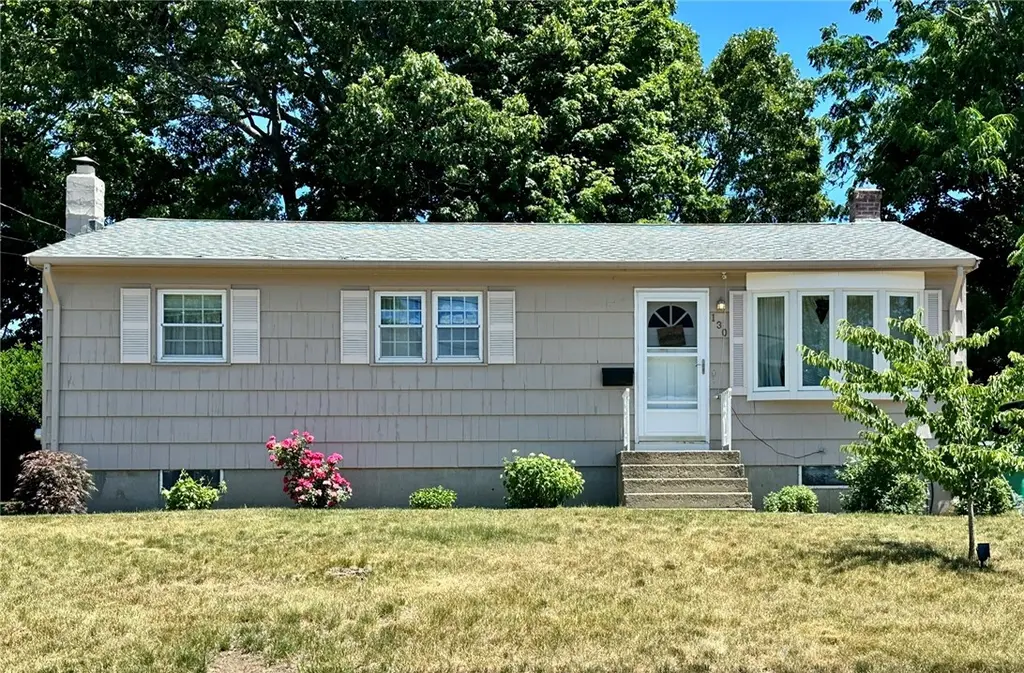
130 Kerri Lyn Rd · Warwick, RI
Flood risk 1/10 · Minimal
- FEMA flood zone
- X (unshaded)
- Chance of flooding over 30 yrs
- 0.0%
- Est. flood insurance / yr
- $473 – $860
Fire risk 1/10 · Minimal
- Est. fire insurance / yr
- $835 – $1,551
Heat risk 5/10 · Moderate
- Hot days now (above 95°F)
- 7 days/yr
- Hot days in 30 yrs
- 16 days/yr
Wind risk 7/10 · Major
- Chance of severe wind over 30 yrs
- 78.0%
Air-quality risk 2/10 · Minimal
- Unhealthy air days now
- 2 days/yr
- Unhealthy air days in 30 yrs
- 2 days/yr
Risk factors via First Street. Map © Google.
Why this score? — see what drove the F grade
The composite is a weighted blend of 9 inputs, each scored 0–100. Each bar is that input's sub-score; the figure is the points it added to the 100-point composite (weight × sub-score).
- Cash flow +6.8/30.0
- ARV discount +6.5/15.0
- Livability +3.9/5.0
- Rent growth +2.5/5.0
- Condition / age +2.5/5.0
- Schools +2.2/10.0
- 1% rule +1.3/10.0
- DSCR +1.0/10.0
- Appreciation +0.0/10.0
$400,000
🖨 Deal sheet 📄 Offer letter ✓ Due diligence
Listing remarks MLS
Welcome Home to this one-of-a-kind Ranch home built in 1969 with only one owner!! Well-maintained with only a 2-year-old heating system and Central Air. The roof is under 5 years old, fenced-in back yard with a sprinkler system, public water, and sewage. Even though the house does need some updating, it is move-in ready. It has a very functional kitchen with a dining area and sliding doors to take you to a private yard. Hardwoods in upstairs bedrooms and under the living room carpet. The finished basement offers a large family room and an additional room perfect for a guest room or a home office. Perfect starter home or a great condo alternative for those looking to downsize and enjoy easy-maintenance living. The location is incredible, close to highways, shopping, little mom-and-pop shops and restaurants, daycares, and schools, yet set back in a quaint Nausauket neighborhood. Book your showings today !!
Key facts
- Modern updates
- Finished basement
- Young roof
Tags
Property features AI
Exterior
- Parking: No garage; 2 parking spaces (total)
- Utilities: Public water (connected); Public sewer (connected); 100 amp electrical service
- Home design: Single-story home; Concrete perimeter foundation
- Construction: Wood siding; Drywall construction
- Exterior features: Sprinkler/irrigation system; Fenced yard
Interior
- Kitchen: Gas water heater
- Bedrooms: Total rooms: 7
- Flooring: Carpet; Hardwood; Laminate
- Bathrooms: 1 full bathroom
- Heating & cooling: Forced air gas heating; Central air conditioning
- Interior features: Tub/shower; Free-standing fireplace; Finished basement
Neighborhood map
What this means for you Summary
Snapshot
- This is a 3-bed/1.0-bath single-family listed at $400k.
Deal economics
- At list price, monthly cash flow is $-625 ($-7k/yr) — negative.
- To cash-flow at today's rent, offer at most $290k (27.6% below list).
- To meet the 1% rule (rent ≥ 1% of price), the offer needs to be $253k (36.7% below list).
- Recommended offer: $253k (36.7% below list) — sets the bar for 1% rule.
Location & tenants
- Location reads 78/100 on livability (#6 in RI, #2,425 nationally) — a middle-class / working-renter tenant base. Strengths: crime A+, commute A+, housing A+; Watch: schools D+, amenities F.
- Warwick (urban): math 15% / reading 32% proficiency, ranked #25 of 39 in RI (top 64%) — low school quality limits family demand, transient renter base, plan for 1-2y turnover.
- Market conditions: 120 active listings in the ZIP; 6 comparable units currently listed for rent nearby; rentals at typical pace (median 24d on market — plan ~3-4 weeks tenant-placement turnaround); 471 units permitted in Kent County in 2024 (240 in 5+ unit buildings).
Forward outlook
- Local home prices are declining (-3.0%/yr); year-one equity from $3k of loan paydown is wiped out by about $12k of value loss. Plan a longer hold.
- Kent County population projected at -14% by 2050 — secular population decline; favor cash flow + early exit over multi-decade hold.
Negotiation context
- Only 3 days on market — expect competitive offers; lowballing is unlikely to land.
- 2 sale attempts since 3y ago with the ask held roughly flat each time — persistent listings suggest the price (not the market) is what's stuck; bring a comps-based counter.
- Current owner paid $340k; 18% above their basis — modest negotiation headroom, anchor on the comps not their cost.
Risks & watch-outs
- Climate carrying-cost: major wind risk, 78% chance of damaging wind over 30y; extreme-heat days projected 7→16/yr by 2055 (HVAC capex compounding) — expect insurance premiums to compound above CPI over the hold.
Questions for the listing agent
- What do current leases actually rent for vs. the listed asking? Can we see a recent rent roll and the last 12 months of T-12 income?
- Built in 1969 — when were the roof, HVAC, electrical panel, plumbing, and water heater last replaced?
- Is there a deadline driving the sale (1031 exchange, divorce, estate, relocation)? That informs how much negotiation room exists.
- Schools are D-rated, which usually means shorter tenancies and higher turnover. Who's the typical renter profile here, and what's been the actual vacancy rate?
- The area grade is low — what's the realistic commute time and amenity access for the typical tenant pool here? Any planned neighborhood developments (good or bad) we should know about?
- What's the average days-on-market for RENTAL listings here right now (not sales)? A rising rental-DOM trend means longer vacancies and softer asking-rent achievability than the comps imply.
- What's the recent tenant-quality profile in this submarket — average credit score on applications, eviction rate, late-payment / NSF rate, and stable-employment percentage? A property-management company in the area should have these aggregated.
- How much new for-sale + rental construction is in the pipeline within 1–3 miles? Heavy new supply typically softens prices + rents 12–24 months out; constrained supply supports both.
Investment metrics
- 1% rule
- 0.63% ✗
- Cap rate
- 4.42%
- Cash-on-cash
- -6.69%
- DSCR
- 0.70
- GRM
- 13.2
CMA / ARV
- ARV (on-the-fly)
- $391,680
- Comps found
- 12
Show comp detail 12 sales within ~0.75 mi
| Address | Dist | Beds/Ba | Sqft | Sold | Price | $/sf | Match |
|---|---|---|---|---|---|---|---|
| 48 Wellington Ave | 0.25mi | 3/1.0 | 960 (0%) | 9mo | $440,000 | $458 | 81 |
| 288 Cove Ave | 0.23mi | 3/1.0 | 1,004 (+5%) | 4mo | $420,000 | $418 | 78 |
| 190 White Ave | 0.20mi | 3/1.0 | 912 (-5%) | 9mo | $379,000 | $416 | 75 |
| 77 Buttonwoods Ave | 0.43mi | 3/1.0 | 972 (+1%) | 4mo | $397,000 | $408 | 74 |
| 148 Asylum Rd | 0.39mi | 3/1.0 | 1,008 (+5%) | 1mo | $430,000 | $427 | 73 |
| 201 Hollis Ave | 0.63mi | 2/1.0 (-1) | 940 (-2%) | 3mo | $335,000 | $356 | 60 |
| 71 Macarthur Dr | 0.19mi | 2/1.0 (-1) | 1,080 (+12%) | 7mo | $362,500 | $336 | 60 |
| 28 Wesleyan Ave | 0.72mi | 3/1.0 | 960 (0%) | 9mo | $401,000 | $418 | 59 |
| 65 Almy St | 0.49mi | 3/1.0 | 1,080 (+12%) | 4mo | $390,000 | $361 | 53 |
| 130 Brentwood Ave | 0.69mi | 3/1.0 | 1,080 (+12%) | 1mo | $361,000 | $334 | 46 |
| 103 Everglade Ave | 0.71mi | 3/1.0 | 1,037 (+8%) | 9mo | $413,155 | $398 | 46 |
| 163 Reynolds Ave | 0.69mi | 2/1.0 (-1) | 859 (-10%) | 10mo | $296,500 | $345 | 37 |
Match score weights: distance 35% · size 25% · config 20% · recency 20%. Top-matched comps best support the ARV.
Projected returns pro-forma
-3.0% appreciation · 3.0% rent growth · sell at horizon
- IRR
- -27.9%
- Equity multiple
- 0.07×
- Total profit
- $-104,652
- Equity at exit
- $59,641
- IRR
- -26.7%
- Equity multiple
- -0.27×
- Total profit
- $-142,555
- Equity at exit
- $34,585
Cash invested: $112,000 (down + closing). Projections, not guarantees.
Landlord ↔ Tenant lean methodology
- Overall (STATE)
- 31 Tenant-Leaning
- State Rhode Island
- 31 Tenant-Leaning · D+8
- County
- — inherits STATE
- City
- — inherits STATE
ZIP-level market 02889
- Active inventory
- 120
- Price-to-rent
- 13.2×
Monthly cashflow live
- Estimated rent
- $2,532 high interval (Pro) →
- Mortgage (P&I)
- −$2,098
- Tax from tax record
- −$360 /mo · $4,326/yr
- Insurance
- −$167
- HOA
- −$0
- Vacancy / Maint / Mgmt
- −$532
- Net cashflow
- $-625
Break-even live
UW: 25.0% down · 7.5% · 30yr · 1.5% tax · 5.0% vac · 8.0% maint · 8.0% mgmt
Financing live
Cash to close
- Down payment
- $100,000
- Closing costs
- $12,000
- Reserves months
- —
- Total cash needed
- —
Loan-product check · same deal, 3 products live
Conventional
25% down · 7.5% · 30yr
- Down + closing
- —
- Monthly P&I
- —
- Monthly cashflow
- —
- DSCR
- —
- Eligible?
- —
Personal DTI + credit; lowest rate.
DSCR
20% down · 8.5% · 30yr
- Down + closing
- —
- Monthly P&I
- —
- Monthly cashflow
- —
- DSCR
- —
- Eligible?
- —
No personal income docs; deal must DSCR.
Hard money
10% down · 12.0% · 12mo
- Down + closing
- —
- Monthly P&I
- —
- Monthly cashflow
- —
- DSCR
- —
- Eligible?
- —
Short-term bridge; refi at stabilization.
Rent comps 6 comps
| Address | Beds | Baths | Sqft | Rent | $/sqft | DOM | Units | Dist |
|---|---|---|---|---|---|---|---|---|
| 5 Moccasin Dr Warwick, RI | 2.0 | 1.0 | 930 | $2,350 | $2.53 | 16d | 1 | 0.31mi |
| 168 Main Ave Warwick, RI | 2.0 | 1.0 | 800 | $2,500 | $3.12 | 16d | 1 | 0.45mi |
| 191 Shand Ave Warwick, RI | 2.0 | 1.0 | 900 | $3,000 | $3.33 | 20d | 1 | 0.59mi |
| 3524 W Shore Rd Warwick, RI | 1.0–2.0 | 1.0–1.5 | 910 | $2,500 | $2.75 | 43d | 2 | 1.11mi |
| 3524 W Shore Rd #505 Warwick, RI | 2.0 | 1.5 | 1100 | $2,500 | $2.27 | 44d | 1 | 1.11mi |
| 185 Ottawa Ave Warwick, RI | 2.0 | 2.0 | 928 | $2,450 | $2.64 | 23d | 1 | 1.41mi |
Listing history 4 events
-
2026-06-18days on market $400,000 Active 3 DOM
-
2026-06-17days on market $400,000 Active 2 DOM
-
2026-06-16remarks 699-char remark
-
2026-06-16$400,000 Active 1 DOM
ⓘ Source: listings_history table (triggers on properties + properties_extension) + one-shot
backfill from property_details.listing_events for pre-trigger history.
Tax reassessment forecast RI · Partial reset (capped growth)
- Current annual tax
- $4,326 · $360/mo
- Projected year-2 tax
- $5,423 · $452/mo
- Expected delta
- +$1,097/yr (+$91/mo · 25.4%)
ⓘ Screening estimate from a state-policy table — verify with the county assessor before closing.
Climate risk First Street
- Flood 1/10 Low FEMA zone X (unshaded) · 0% chance over 30 yrs
- Wildfire 1/10 Low
- Heat 5/10 Major 7 d/yr ≥95°F today · 16 d/yr by 30 yrs out
- Wind 7/10 Severe 78% chance of damaging wind over 30 yrs
- Air quality 2/10 Low 2 unhealthy d/yr today · 2 by 30 yrs out
Nearby sold comps map
Loading sold comps map…
Walkable amenities ~0.75 mi
Loading nearby amenities…
Taxation est. · year 1
- Rental income
- $30,381
- − Mortgage interest
- −$22,406
- − Property taxes
- −$4,326
- − Insurance
- −$2,000
- − Repairs & maintenance
- −$2,431
- − Management
- −$2,431
- − Depreciation
- −$11,636
- Taxable loss
- −$14,848
- Est. tax savings @ 24.0%
- +$3,564
- After-tax cash flow
- $-3,933/yr
For passive investors: Depreciation is non-cash, so a rental often shows a tax loss while cash-flowing — sheltering income. Rental losses are passive: they offset passive income freely, and up to $25,000/yr can offset ordinary (W-2) income if you actively participate and your MAGI is under $100k (phasing out to $0 by $150k); unused losses carry forward. On sale, claimed depreciation is recaptured at up to 25%, and gains may owe capital-gains tax (a 1031 exchange can defer both). Figures are a year-1 estimate at your 24.0% rate — not tax advice; consult a CPA.
Schools (NCES district)
- District
- Warwick
- NCES district ID
- 4401110
- Math proficiency
- 15% ▼ -11.00%
- Reading proficiency
- 32% ▼ -7.00%
- Median HH income
- $63,420
- Composite
- 22.03/100
- National rank
- #8203
- State rank
- #25 of 39 in RI
Livability — Warwick
- Score
- 78/100
- State rank
- #6
- US rank
- #2425
Category grades
Schools grade is shown separately in the Schools card above.
Census & demographics
- Census place
- Warwick, RI
- City population
- 108,434
- Population (ZIP)
- 27,533
Population outlook (Kent County) Hauer SSP2
- Today (2025)
- 160,994 people
- By 2030
- 157,428 · -2.2%
- By 2040
- 148,389 · -7.8%
- By 2050
- 137,995 · -14.3%
- By 2075
- 118,536 · -26.4%
- By 2100
- 102,266 · -36.5%
Race, ethnicity, and origin ACS 2023
- Neighborhood character
- Predominantly White (85%)
- Race & ethnicity
- White 85% Hispanic / Latino 7% Two or more races 7% Black 2% Asian 2%
- Hispanic origin (detail)
- Mexican 1% Puerto Rican 2% Dominican 2%
- Common ancestry
- Lithuanian 10% Russian 9% Romanian 4%
- Foreign-born
- 6% · Canada, China
- Languages at home
- 92% English-only · Spanish 3% Other Indo-European 2% French/Haitian/Cajun 1%
Political lean MEDSL · Kent
- 2024 margin
- Toss-up / Even · D 49.9% · R 48.1% · Other 2.0%
- 2008→2024 swing
- -15.6pp toward R · 2008: 17.5pp · 2024: 1.9pp
- All cycles
- 2024: D+1.9 2020: D+7.6 2016: R+0.7 2012: D+18.4 2008: D+17.5
Not yet ingested
- Civics
- —
Market trends
- HPI YoY
- ▼ -493.61%
- Current HPI
- 398.7453
- Rent YoY
- —
- Metro
- —
- State GDP YoY
- ▲ 2.25%
- F500 in state
- 10
Industry mix (Fortune 500 HQ in RI)
| Industry | F500 HQs | Revenue |
|---|---|---|
| Healthcare | 1 | $373B |
|
||
| Food Distribution | 1 | $31B |
|
||
| Aerospace / Defense | 1 | $14B |
|
||
| Financial Services | 1 | $8B |
|
||
| Consumer Goods | 1 | $4B |
|
||
Price history
+33.4% since first listed4 events — show timeline
- 2026-06-15 Listed $400,000 RIS
- 2023-07-14 Sold (MLS) $340,000 RIS
- 2023-05-29 Pending — RIS
- 2023-05-21 Listed $299,900 RIS
Property tax history
+3.2%/yrLatest (2025): $4,326 · +11.0% YoY. Source: county tax records.
Cash-flow waterfall
monthlySold comps — $/sqft
last 12 mo · ≤1 miLoading sold comps…