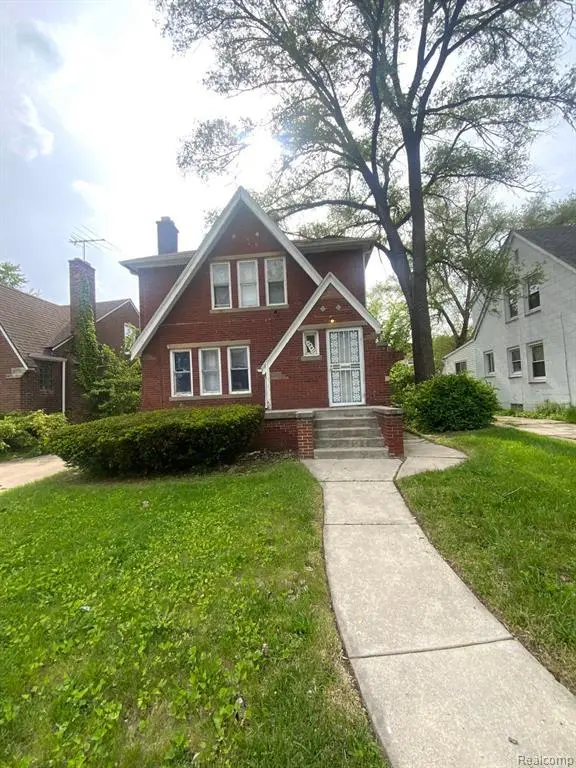
15411 Ferguson St · Detroit, MI
Flood risk 1/10 · Minimal
- FEMA flood zone
- X (unshaded)
- Chance of flooding over 30 yrs
- 0.0%
- Est. flood insurance / yr
- $473 – $860
Fire risk 1/10 · Minimal
- Est. fire insurance / yr
- $784 – $1,456
Heat risk 3/10 · Minor
- Hot days now (above 98°F)
- 7 days/yr
- Hot days in 30 yrs
- 15 days/yr
Wind risk 2/10 · Minimal
- Chance of severe wind over 30 yrs
- —
Air-quality risk 3/10 · Minor
- Unhealthy air days now
- 2 days/yr
- Unhealthy air days in 30 yrs
- 5 days/yr
Risk factors via First Street. Map © Google.
Why this score? — see what drove the B+ grade
The composite is a weighted blend of 9 inputs, each scored 0–100. Each bar is that input's sub-score; the figure is the points it added to the 100-point composite (weight × sub-score).
- Cash flow +30.0/30.0
- ARV discount +15.0/15.0
- 1% rule +10.0/10.0
- DSCR +10.0/10.0
- Rent growth +3.9/5.0
- Livability +3.7/5.0
- Condition / age +2.5/5.0
- Schools +1.3/10.0
- Appreciation +0.0/10.0
$79,900
🖨 Deal sheet 📄 Offer letter ✓ Due diligence
Listing remarks MLS
Located in Detroit's established B. E. Taylors Luana Subdivision, this is a compelling opportunity with a huge spread investors or sweat equity deal hunters seeking a value-add project in a neighborhood known for its classic brick colonials, strong rental demand, and active sales activity. The surrounding area features a consistent housing stock of larger two-story homes, many with basements and garages, creating a solid foundation for both renovation and long-term hold strategies. Ferguson continues to see investor interest due to its affordability, proximity to major roads, shopping, and employment corridors, while recent neighborhood sales demonstrate ongoing demand for updated properties. This brick colonial offers the kind of spread and upside experienced investors look for - a chance to create meaningful equity through improvements in an area where well-executed renovations continue to attract buyers and tenants alike. And speaking of tenants - unlike many of the other properties for sale in the area, this property is vacant and will be vacant at closing. There are no territorial tenants complicating things or preventing your entry or ability to do a peaceful and private walkthrough. Situations like this are very rare in this area, so don't miss out. Listing broker holds contractual equitable interest in the property and may receive consideration from the transaction. Property is being marketed pursuant to a purchase agreement with the seller. Closing will be conducted via contract assignment. Seller to provide marketable title at closing. Seller pays ALL: water bills owed, taxes owed, blight tickets or anything else. Buyer to pay closing costs, including title insurance and closing fees. Sold AS IS - Buyer to verify all information listed.
Key facts
- 4,792 sq ft lot
- Garage
- Built 1928
Property features AI
Exterior
- Parking: Detached 1-car garage
- Utilities: Public water; Public sewer
- Home design: Single-family residence; Two levels; Ground-level entry with steps; Brick exterior
- Construction: Brick construction
- Exterior features: Paved road access; Lot dimensions approximately 44 x 106.6 (0.11 acres)
Interior
- Bathrooms: One full bathroom
- Heating & cooling: Forced air heating; Natural gas heating; No central cooling
- Interior features: Unfinished basement; Five total rooms
Neighborhood map
What this means for you Summary
Snapshot
- This is a 3-bed/1.0-bath single-family listed at $80k.
Deal economics
- At list price, monthly cash flow is $519 ($6k/yr) — positive.
- The deal already cash-flows at list — no discount required.
- Meets the 1% rule at list price ($1k rent vs $80k).
- Recommended offer: $79k (1.5% below list) — sets the bar for market timing.
- Cap rate 14.1% vs local median 10.2% in Detroit — top-decile yield for the area; either an underpriced asset or a hidden risk that comps aren't pricing in. Stress-test before assuming the spread holds.
Location & tenants
- Location reads 73/100 on livability (#218 in MI) — a middle-class / working-renter tenant base. Strengths: amenities A+, commute A+, cost of living A+; Watch: schools F, crime F, employment F.
- Detroit Public Schools Community District (urban): math 10% / reading 24% proficiency, ranked #499 of 540 in MI (top 92%) — low school quality limits family demand, transient renter base, plan for 1-2y turnover; 90% free/reduced lunch — lower-income household profile, screen leases tightly.
- Market conditions: Rents rising fast (+5.6%/yr); 385 active listings in the ZIP; 40 comparable units currently listed for rent nearby; rentals at typical pace (median 20d on market — plan ~3-4 weeks tenant-placement turnaround); lower-income renter base — watch delinquency; 2,639 units permitted in Wayne County in 2024 (1,216 in 5+ unit buildings).
- At $1,381/mo this rent would consume 45% of the median local household income ($37k/yr) (locally 2371% of renters already pay >50% of income on rent) — very limited rent-growth headroom before tenants either downsize or default.
Forward outlook
- Local home prices are declining (-3.0%/yr); year-one equity from $552 of loan paydown is wiped out by about $2k of value loss. Plan a longer hold.
- Wayne County population projected at -17% by 2050 — secular population decline; favor cash flow + early exit over multi-decade hold.
- At projected returns (-3.0% appreciation + 5.6% rent growth), your $22k cash investment doubles in ~4 years — after that, you're playing with house money.
Negotiation context
- It's been on market 16 days — a 2% lower offer ($79k) is reasonable based on typical stale-listing flexibility.
- 2 sale attempts with the ask held roughly flat each time — persistent listings suggest the price (not the market) is what's stuck; bring a comps-based counter.
Risks & watch-outs
- Watch-outs: built in 1928 — expect roof / HVAC / electrical / plumbing capex.
Questions for the listing agent
- Built in 1928 — when were the roof, HVAC, electrical panel, plumbing, and water heater last replaced?
- Is there a deadline driving the sale (1031 exchange, divorce, estate, relocation)? That informs how much negotiation room exists.
- Schools are F-rated, which usually means shorter tenancies and higher turnover. Who's the typical renter profile here, and what's been the actual vacancy rate?
- Crime grade is F in this area — have there been break-ins, vandalism, or insurance claims at this property in the last 3 years? What carrier currently insures it and at what premium?
- What's the average days-on-market for RENTAL listings here right now (not sales)? A rising rental-DOM trend means longer vacancies and softer asking-rent achievability than the comps imply.
- What's the recent tenant-quality profile in this submarket — average credit score on applications, eviction rate, late-payment / NSF rate, and stable-employment percentage? A property-management company in the area should have these aggregated.
- How much new for-sale + rental construction is in the pipeline within 1–3 miles? Heavy new supply typically softens prices + rents 12–24 months out; constrained supply supports both.
Investment metrics
- 1% rule
- 1.73% ✓
- Cap rate
- 14.09%
- Cash-on-cash
- 27.83%
- DSCR
- 2.24
- GRM
- 4.8
CMA / ARV
- ARV (on-the-fly)
- $121,354
- Comps found
- 12
Show comp detail 12 sales within ~0.75 mi
| Address | Dist | Beds/Ba | Sqft | Sold | Price | $/sf | Match |
|---|---|---|---|---|---|---|---|
| 15771 Rutherford St | 0.33mi | 3/1.0 | 1,289 (-0%) | 1mo | $55,106 | $43 | 84 |
| 15725 Asbury Park | 0.15mi | 3/2.0 | 1,206 (-7%) | 2mo | $80,200 | $67 | 76 |
| 14736 Mansfield St | 0.48mi | 3/1.0 | 1,318 (+2%) | 0mo | $62,000 | $47 | 74 |
| 15800 Biltmore St | 0.24mi | 3/2.5 | 1,188 (-8%) | 3mo | $112,000 | $94 | 67 |
| 15508 Saint Marys St | 0.21mi | 3/1.0 | 1,100 (-15%) | 0mo | $59,900 | $54 | 66 |
| 15328 Prest St E | 0.64mi | 3/1.5 | 1,298 (+0%) | 3mo | $66,999 | $52 | 65 |
| 15316 Prevost St NE | 0.38mi | 2/1.5 (-1) | 1,193 (-8%) | 2mo | $157,000 | $132 | 62 |
| 15092 Faust Ave | 0.70mi | 3/2.0 | 1,310 (+2%) | 1mo | $127,500 | $97 | 60 |
| 16709 Lindsay St | 0.65mi | 3/1.0 | 1,218 (-6%) | 2mo | $124,888 | $103 | 58 |
| 16533 Harlow St | 0.60mi | 3/1.5 | 1,385 (+7%) | 2mo | $83,989 | $61 | 57 |
| 16727 Mansfield St | 0.69mi | 3/1.5 | 1,207 (-6%) | 3mo | $165,000 | $137 | 53 |
| 14837 Ashton Rd | 0.67mi | 3/1.5 | 1,386 (+7%) | 2mo | $200,000 | $144 | 52 |
Match score weights: distance 35% · size 25% · config 20% · recency 20%. Top-matched comps best support the ARV.
Projected returns pro-forma
-3.0% appreciation · 5.59% rent growth · sell at horizon
- IRR
- 24.9%
- Equity multiple
- 2.06×
- Total profit
- $23,825
- Equity at exit
- $11,913
- IRR
- 34.3%
- Equity multiple
- 4.55×
- Total profit
- $79,412
- Equity at exit
- $6,908
Cash invested: $22,372 (down + closing). Projections, not guarantees.
Landlord ↔ Tenant lean methodology
- Overall (STATE)
- 62 Landlord-Friendly
- State Michigan
- 62 Landlord-Friendly · EVEN
- County
- — inherits STATE
- City
- — inherits STATE
ZIP-level market 48227
- Rents YoY
- 5.6%
- Active inventory
- 385
- Price-to-rent
- 4.8×
Monthly cashflow live
- Estimated rent
- $1,381 high interval (Pro) →
- Mortgage (P&I)
- −$419
- Tax from tax record
- −$120 /mo · $1,440/yr
- Insurance
- −$33
- HOA
- −$0
- Vacancy / Maint / Mgmt
- −$290
- Net cashflow
- $519
Break-even live
UW: 25.0% down · 7.5% · 30yr · 1.5% tax · 5.0% vac · 8.0% maint · 8.0% mgmt
Financing live
Cash to close
- Down payment
- $19,975
- Closing costs
- $2,397
- Reserves months
- —
- Total cash needed
- —
Loan-product check · same deal, 3 products live
Conventional
25% down · 7.5% · 30yr
- Down + closing
- —
- Monthly P&I
- —
- Monthly cashflow
- —
- DSCR
- —
- Eligible?
- —
Personal DTI + credit; lowest rate.
DSCR
20% down · 8.5% · 30yr
- Down + closing
- —
- Monthly P&I
- —
- Monthly cashflow
- —
- DSCR
- —
- Eligible?
- —
No personal income docs; deal must DSCR.
Hard money
10% down · 12.0% · 12mo
- Down + closing
- —
- Monthly P&I
- —
- Monthly cashflow
- —
- DSCR
- —
- Eligible?
- —
Short-term bridge; refi at stabilization.
Rent comps 40 comps
| Address | Beds | Baths | Sqft | Rent | $/sqft | DOM | Units | Dist |
|---|---|---|---|---|---|---|---|---|
| 15065 Gilchrist St Detroit, MI | 3.0 | 1.0 | 1100 | $1,250 | $1.14 | 44d | 1 | 0.16mi |
| 15736 Biltmore St Detroit, MI | 3.0 | 1.5 | 1000 | $1,200 | $1.20 | 17d | 1 | 0.17mi |
| 15332 Saint Marys St Detroit, MI | 3.0 | 1.0 | 1200 | $1,200 | $1.00 | 17d | 1 | 0.21mi |
| 14800 Woodmont Ave Detroit, MI | 3.0 | 2.0 | 1612 | $1,525 | $0.95 | 15d | 1 | 0.32mi |
| 15375 Prevost St Detroit, MI | 4.0 | 1.0 | 907 | $1,300 | $1.43 | 17d | 1 | 0.34mi |
| 15752 Rutherford St Detroit, MI | 3.0 | 2.0 | 1174 | $1,386 | $1.18 | 5d | 1 | 0.36mi |
| 15866 Mansfield St Detroit, MI | 3.0 | 1.0 | 1324 | $1,425 | $1.08 | 24d | 1 | 0.41mi |
| 16014 Hackett St Detroit, MI | 4.0 | 2.0 | 1142 | $1,500 | $1.31 | 44d | 1 | 0.43mi |
| 14753 Saint Marys St Detroit, MI | 2.0 | 1.0 | 900 | $1,150 | $1.28 | 5d | 1 | 0.45mi |
| 14753 Saint Marys St Detroit, MI | 2.0 | 1.0 | 900 | $1,150 | $1.28 | 12d | 1 | 0.45mi |
| 16210 Ferguson St Detroit, MI | 4.0 | 2.0 | 1493 | $1,750 | $1.17 | 3d | 1 | 0.49mi |
| 14716 Archdale St Detroit, MI | 2.0 | 1.0 | 900 | $1,100 | $1.22 | 44d | 1 | 0.51mi |
| 14836 Rutherford St Unit 2 Detroit, MI | 2.0 | 1.0 | 1104 | $950 | $0.86 | 44d | 1 | 0.52mi |
| 16535 Asbury Park Detroit, MI | 3.0 | 1.5 | 1152 | $1,450 | $1.26 | 24d | 1 | 0.55mi |
| 14535 Mettetal St Unit 1 Detroit, MI | 2.0 | 1.0 | 965 | $1,000 | $1.04 | 44d | 1 | 0.59mi |
| 14510 Asbury Park Detroit, MI | 2.0 | 1.0 | 1771 | $1,250 | $0.71 | 44d | 1 | 0.61mi |
| 14504 Saint Marys St Detroit, MI | 4.0 | 1.0 | 1362 | $1,473 | $1.08 | 44d | 1 | 0.64mi |
| 14893 Prest St Detroit, MI | 3.0 | 1.0 | 1100 | $1,000 | $0.91 | 15d | 1 | 0.72mi |
| 14580 Forrer St Unit Unit Detroit, MI | 2.0 | 1.0 | 1300 | $900 | $0.69 | 20d | 1 | 0.72mi |
| 14615 Winthrop St Detroit, MI | 2.0 | 1.0 | 1217 | $1,300 | $1.07 | 17d | 1 | 0.75mi |
| 15468 Sussex St #2 Detroit, MI | 2.0 | 1.0 | 900 | $1,250 | $1.39 | 44d | 1 | 0.78mi |
| 15330 Coyle St Unit 1 Detroit, MI | 3.0 | 1.0 | 1000 | $1,375 | $1.38 | 24d | 1 | 0.84mi |
| 15330 Coyle St Unit 1 Detroit, MI | 3.0 | 1.0 | 1000 | $1,425 | $1.43 | 12d | 1 | 0.84mi |
| 15330 Coyle St Unit 2 Detroit, MI | 3.0 | 1.0 | 1000 | $1,450 | $1.45 | 24d | 1 | 0.84mi |
| 15328 Coyle St Detroit, MI | 3.0 | 1.0 | 1000 | $1,450 | $1.45 | 18d | 1 | 0.84mi |
| 16876 Harlow Ave Unit (NO) Detroit, MI | 3.0 | 1.0 | 1250 | $1,350 | $1.08 | 44d | 1 | 0.87mi |
| 14814 Sussex St Unit 2 Detroit, MI | 3.0 | 1.0 | 1100 | $1,000 | $0.91 | 44d | 1 | 0.89mi |
| 15341 Lauder St Detroit, MI | 4.0 | 1.5 | 1080 | $1,475 | $1.37 | 17d | 1 | 0.94mi |
| 15810 Robson St Detroit, MI | 3.0 | 1.0 | 1142 | $1,500 | $1.31 | 24d | 1 | 0.94mi |
| 16151 Robson St Detroit, MI | 3.0 | 1.0 | 1300 | $1,525 | $1.17 | 15d | 1 | 0.98mi |
| 17201 Saint Marys St Detroit, MI | 2.0 | 1.0 | 1200 | $1,200 | $1.00 | 3d | 1 | 1.00mi |
| 17165 Prevost St Detroit, MI | 3.0 | 1.0 | 1060 | $2,400 | $2.26 | 2d | 1 | 1.01mi |
| 16757 Greenview Ave Unit 1A Detroit, MI | 3.0 | 1.5 | 1600 | $1,500 | $0.94 | 5d | 1 | 1.01mi |
| 14375 Terry St Detroit, MI | 3.0 | 2.0 | 1300 | $1,425 | $1.10 | 44d | 1 | 1.15mi |
| 16823 Stahelin Ave Detroit, MI | 3.0 | 2.5 | 1500 | $1,600 | $1.07 | 18d | 1 | 1.15mi |
| 14264 Coyle St Detroit, MI | 2.0 | 1.0 | 1000 | $1,150 | $1.15 | 44d | 1 | 1.17mi |
| 15762 Mark Twain St Detroit, MI | 3.0 | 2.0 | 1430 | $1,250 | $0.87 | 17d | 1 | 1.23mi |
| 14104 Coyle St Detroit, MI | 3.0 | 1.0 | 1327 | $1,350 | $1.02 | 5d | 1 | 1.24mi |
| 14559 Strathmoor St Detroit, MI | 2.0 | 1.0 | 1033 | $1,150 | $1.11 | 20d | 1 | 1.25mi |
| 14600 Strathmoor St Detroit, MI | 4.0 | 1.0 | 1300 | $1,450 | $1.12 | 44d | 1 | 1.26mi |
Listing history 12 events
-
2026-06-18days on market $79,900 Active 16 DOM
-
2026-06-17days on market $79,900 Active 15 DOM
-
2026-06-16days on market $79,900 Active 14 DOM
-
2026-06-15days on market $79,900 Active 13 DOM
-
2026-06-13days on market $79,900 Active 11 DOM
-
2026-06-13days on market $79,900 Active 10 DOM
-
2026-06-09days on market $79,900 Active 7 DOM
-
2026-06-08days on market $79,900 Active 6 DOM
-
2026-06-07days on market $79,900 Active 5 DOM
-
2026-06-04days on market $79,900 Active 2 DOM
-
2026-06-02remarks 693-char remark
Show marketing remark (1778 chars)
Located in Detroit's established B. E. Taylors Luana Subdivision, this is a compelling opportunity with a huge spread investors or sweat equity deal hunters seeking a value-add project in a neighborhood known for its classic brick colonials, strong rental demand, and active sales activity. The surrounding area features a consistent housing stock of larger two-story homes, many with basements and garages, creating a solid foundation for both renovation and long-term hold strategies. Ferguson continues to see investor interest due to its affordability, proximity to major roads, shopping, and employment corridors, while recent neighborhood sales demonstrate ongoing demand for updated properties. This brick colonial offers the kind of spread and upside experienced investors look for - a chance to create meaningful equity through improvements in an area where well-executed renovations continue to attract buyers and tenants alike. And speaking of tenants - unlike many of the other properties for sale in the area, this property is vacant and will be vacant at closing. There are no territorial tenants complicating things or preventing your entry or ability to do a peaceful and private walkthrough. Situations like this are very rare in this area, so don't miss out. Listing broker holds contractual equitable interest in the property and may receive consideration from the transaction. Property is being marketed pursuant to a purchase agreement with the seller. Closing will be conducted via contract assignment. Seller to provide marketable title at closing. Seller pays ALL: water bills owed, taxes owed, blight tickets or anything else. Buyer to pay closing costs, including title insurance and closing fees. Sold AS IS - Buyer to verify all information listed.
-
2026-06-02$79,900 Active 1 DOM
Show marketing remark (1778 chars)
Located in Detroit's established B. E. Taylors Luana Subdivision, this is a compelling opportunity with a huge spread investors or sweat equity deal hunters seeking a value-add project in a neighborhood known for its classic brick colonials, strong rental demand, and active sales activity. The surrounding area features a consistent housing stock of larger two-story homes, many with basements and garages, creating a solid foundation for both renovation and long-term hold strategies. Ferguson continues to see investor interest due to its affordability, proximity to major roads, shopping, and employment corridors, while recent neighborhood sales demonstrate ongoing demand for updated properties. This brick colonial offers the kind of spread and upside experienced investors look for - a chance to create meaningful equity through improvements in an area where well-executed renovations continue to attract buyers and tenants alike. And speaking of tenants - unlike many of the other properties for sale in the area, this property is vacant and will be vacant at closing. There are no territorial tenants complicating things or preventing your entry or ability to do a peaceful and private walkthrough. Situations like this are very rare in this area, so don't miss out. Listing broker holds contractual equitable interest in the property and may receive consideration from the transaction. Property is being marketed pursuant to a purchase agreement with the seller. Closing will be conducted via contract assignment. Seller to provide marketable title at closing. Seller pays ALL: water bills owed, taxes owed, blight tickets or anything else. Buyer to pay closing costs, including title insurance and closing fees. Sold AS IS - Buyer to verify all information listed.
ⓘ Source: listings_history table (triggers on properties + properties_extension) + one-shot
backfill from property_details.listing_events for pre-trigger history.
Tax reassessment forecast MI · Partial reset (capped growth)
- Current annual tax
- $1,440 · $120/mo
- Projected year-2 tax
- $1,440 · $120/mo
- Expected delta
- $0/yr ($0/mo · 0.0%)
ⓘ Screening estimate from a state-policy table — verify with the county assessor before closing.
Climate risk First Street
- Flood 1/10 Low FEMA zone X (unshaded) · 0% chance over 30 yrs
- Wildfire 1/10 Low
- Heat 3/10 Moderate 7 d/yr ≥98°F today · 15 d/yr by 30 yrs out
- Wind 2/10 Low
- Air quality 3/10 Moderate 2 unhealthy d/yr today · 5 by 30 yrs out
Nearby sold comps map
Loading sold comps map…
Walkable amenities ~0.75 mi
Loading nearby amenities…
Taxation est. · year 1
- Rental income
- $16,575
- − Mortgage interest
- −$4,476
- − Property taxes
- −$1,440
- − Insurance
- −$400
- − Repairs & maintenance
- −$1,326
- − Management
- −$1,326
- − Depreciation
- −$2,324
- Taxable income
- $5,283
- Est. tax owed @ 24.0%
- −$1,268
- After-tax cash flow
- $4,958/yr
For passive investors: Depreciation is non-cash, so a rental often shows a tax loss while cash-flowing — sheltering income. Rental losses are passive: they offset passive income freely, and up to $25,000/yr can offset ordinary (W-2) income if you actively participate and your MAGI is under $100k (phasing out to $0 by $150k); unused losses carry forward. On sale, claimed depreciation is recaptured at up to 25%, and gains may owe capital-gains tax (a 1031 exchange can defer both). Figures are a year-1 estimate at your 24.0% rate — not tax advice; consult a CPA.
Schools (NCES district)
- District
- Detroit Public Schools Community District
- NCES district ID
- 2601103
- Math proficiency
- 10% ▼ -2.00%
- Reading proficiency
- 24% ▲ 6.00%
- Median HH income
- $25,815
- Composite
- 13.06/100
- National rank
- #9564
- State rank
- #499 of 540 in MI
Livability — Detroit
- Score
- 73/100
- State rank
- #218
- US rank
- #5427
Category grades
Schools grade is shown separately in the Schools card above.
Census & demographics
- Census place
- Detroit, MI
- County
- Wayne County · 1,562,939 people
- City population
- 572,865
- Metro
- Detroit-Warren-Dearborn, MI
- Population (ZIP)
- 40,302
- Household income
- $36,527
- Rent vs Own
- Severe rent burden
- 2371.0
Population outlook (Wayne County) Hauer SSP2
- Today (2025)
- 1,675,273 people
- By 2030
- 1,620,300 · -3.3%
- By 2040
- 1,502,341 · -10.3%
- By 2050
- 1,384,039 · -17.4%
- By 2075
- 1,124,592 · -32.9%
- By 2100
- 881,193 · -47.4%
Race, ethnicity, and origin ACS 2023
- Neighborhood character
- Predominantly Black (95%)
- Race & ethnicity
- Black 95% Two or more races 3% White 1%
- Foreign-born
- 1%
- Languages at home
- 98% English-only · Spanish 1% French/Haitian/Cajun 1%
Political lean MEDSL · Wayne
- 2024 margin
- Strong D (+29.0) · D 62.7% · R 33.7% · Other 3.6%
- 2008→2024 swing
- -20.5pp toward R · 2008: 49.5pp · 2024: 29.0pp
- All cycles
- 2024: D+29.0 2020: D+38.1 2016: D+37.3 2012: D+46.9 2008: D+49.5
Not yet ingested
- Civics
- —
Market trends
- HPI YoY
- ▼ -125.00%
- Current HPI
- 186.4158
- Rent YoY
- ▲ 5.59%
- Metro
- Detroit-Warren-Dearborn, MI
- State GDP YoY
- ▲ 1.37%
- F500 in state
- 28
Industry mix (Fortune 500 HQ in MI)
| Industry | F500 HQs | Revenue |
|---|---|---|
| Automotive Parts | 3 | $48B |
|
||
| Automotive | 2 | $372B |
|
||
| Chemicals | 1 | $45B |
|
||
| Automotive Retail | 1 | $29B |
|
||
| Healthcare / Medical Devices | 1 | $23B |
|
||
| Automotive Technology | 1 | $20B |
|
||
Price history
+0.8% since first listed3 events — show timeline
- 2026-06-02 Listed $79,900 REALCOMP
- 2026-06-02 Listed $79,900 MiRealSource-MiMLS
- 2002-02-08 Sold (Public Records) $79,255 Public Records
Property tax history
-1.6%/yrLatest (2025): $1,440 · -54.1% YoY. Source: county tax records.
Cash-flow waterfall
monthlySold comps — $/sqft
last 12 mo · ≤1 miLoading sold comps…