 Fourplex
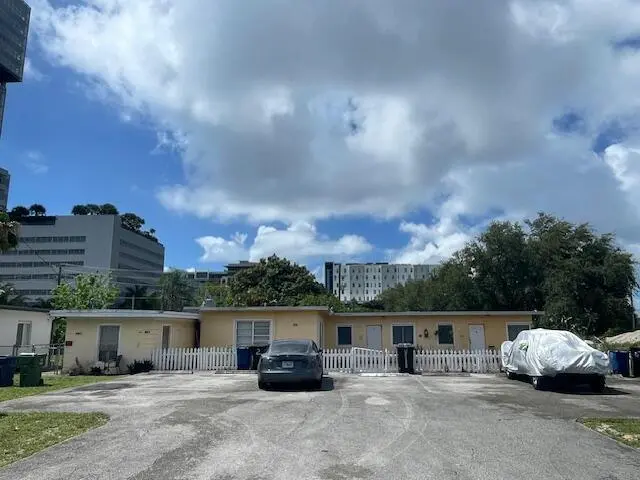
224 SE 9th Ct Unit 1-4 · Hallandale Beach, FL
Flood risk 7/10 · Major
- FEMA flood zone
- AE
- Chance of flooding over 30 yrs
- 0.72%
- Est. flood insurance / yr
- $1,737 – $8,500
Fire risk 1/10 · Minimal
- Est. fire insurance / yr
- $947 – $1,759
Heat risk 10/10 · Severe
- Hot days now (above 104°F)
- 7 days/yr
- Hot days in 30 yrs
- 26 days/yr
Wind risk 10/10 · Severe
- Chance of severe wind over 30 yrs
- 99.0%
Air-quality risk 2/10 · Minimal
- Unhealthy air days now
- 1 days/yr
- Unhealthy air days in 30 yrs
- 2 days/yr
Risk factors via First Street. Map © Google.
Why this score? — see what drove the D grade
The composite is a weighted blend of 9 inputs, each scored 0–100. Each bar is that input's sub-score; the figure is the points it added to the 100-point composite (weight × sub-score).
- Cash flow +18.5/30.0
- DSCR +5.8/10.0
- 1% rule +4.9/10.0
- Schools +4.1/10.0
- Livability +4.0/5.0
- Rent growth +2.6/5.0
- Condition / age +2.5/5.0
- ARV discount +0.0/15.0
- Appreciation +0.0/10.0
$879,000
🖨 Deal sheet (PDF) 📄 Offer letter ✓ Due diligence
Multi-family units
County records classify this as Multi-Family (2-4 Unit). Listing-text estimate: 4 units. confirmed
Listing remarks
The property at 224 SE 9th Ct. , Hallandale Beach, FL 33009 is a multifamily 4-plex located on a 9,903 SF lot within the Central RAC zoning district. This zoning designation allows redevelopment potential of up to 12 residential units. Neighborhood & Development Trends: The Southeastern Core Corridor of Hallandale Beach is experiencing significant new development, with upscale office, retail, and residential projects transforming the area into a high-end mixed-use hub. Major Redevelopment Potential: Given its Central RAC zoning, the property has the flexibility to be expanded into a higher-density residential development, which is attractive for investors looking to capitalize on the
Key facts
- Multifamily 4-plex
- Central rac zoning
- 9,903 sq ft lot
Tags
Property features AI
Finance
- Financial info: Two total units on the parcel, four units in the community; Gross income: $50,400; Net operating income: $32,256; Tenants pay electricity; Pets allowed with no restrictions
Exterior
- Utilities: Public water; Public sewer; Cable connected; Electricity connected; Sewer connected; Water available; Four separate electric meters
- Home design: Quadruplex; One story; City street frontage
- Construction: Stucco and CBS construction; Composition roof; Slab foundation; Built as a single-story building
- Exterior features: Chain link front-yard fencing with gate; Fenced yard; Room for a pool; Asphalt city street frontage; Not waterfront
Interior
- Flooring: Ceramic tile
- Heating & cooling: Window/wall heating; Ceiling fans; Wall/window cooling units
- Interior features: Ceramic tile floors
Neighborhood map
What this means for you Summary
Snapshot
- This is a 4 × 2-bed/1-bath units multifamily listed at $879k.
Deal economics
- At list price, monthly cash flow is $413 ($5k/yr) — positive. Per door: $103/mo.
- The deal already cash-flows at list — no discount required.
- To meet the 1% rule (rent ≥ 1% of price), the offer needs to be $872k (0.7% below list).
- Recommended offer: $853k (3.0% below list) — sets the bar for market timing.
- Cap rate 7.4% vs local median 5.2% in Hallandale Beach — top-decile yield for the area; either an underpriced asset or a hidden risk that comps aren't pricing in. Stress-test before assuming the spread holds.
Location & tenants
- Location reads 81/100 on livability (#86 in FL, #1,400 nationally) — a professional / high-income tenant draw. Strengths: commute A+, health & safety A+, crime B+; Watch: employment D-.
- Broward (suburban): math 42% / reading 53% proficiency, ranked #46 of 73 in FL (top 63%) — families likely to look elsewhere, expect single-tenant / working-renter base with shorter leases.
- Zoned schools: Gulfstream Academy of Hallandale Beach (math 32% / reading 40%, grade F, #1,670 of 2,144 statewide, top 78%, 1,317 students, 73% FRL); Nova Middle School (math 44% / reading 53%, grade C-, #274 of 571 statewide, top 50%, 1,284 students, 68% FRL); Hallandale High School (math 10% / reading 24%, grade F, #597 of 667 statewide, top 90%, 1,104 students, 70% FRL) — zoned schools average 70% FRL vs 51% district-wide (19 pts higher); higher-poverty schools than district average — tighter screening recommended.
- Zoned-school proficiency averages 34% at this address vs 48% district-wide (-14 pts) — the specific schools serving this property underperform the Broward average; the district grade overstates school quality for this exact location.
- Market conditions: Rents flat; 1384 active listings in the ZIP; 35 comparable units currently listed for rent nearby; rentals at typical pace (median 24d on market — plan ~3-4 weeks tenant-placement turnaround); 2,111 units permitted in Broward County in 2024 (1,265 in 5+ unit buildings).
- At $8,725/mo this rent would consume 201% of the median local household income ($52k/yr) (locally 3293% of renters already pay >50% of income on rent) — very limited rent-growth headroom before tenants either downsize or default.
Forward outlook
- Local home prices are declining (-3.0%/yr); year-one equity from $6k of loan paydown is wiped out by about $26k of value loss. Plan a longer hold.
- Broward County population projected at +34% by 2050 — long-run rental-demand tailwind backs the buy-and-hold thesis.
Negotiation context
- It's been on market 33 days — a 3% lower offer ($853k) is reasonable based on typical stale-listing flexibility.
- Current owner paid $55k; list at $879k implies a 1498% gain — meaningful room to come down on a strong offer.
Risks & watch-outs
- Watch-outs: flood insurance adds $427/mo; built in 1953 — expect roof / HVAC / electrical / plumbing capex.
- Climate carrying-cost: in FEMA flood zone AE (mandatory federal flood insurance); severe wind risk, 99% chance of damaging wind over 30y; extreme-heat days projected 7→26/yr by 2055 (HVAC capex compounding) — expect insurance premiums to compound above CPI over the hold.
Questions for the listing agent
- It's been on market 33 days. Have you received any prior offers? Is the seller open to a 3% concession, seller financing, or rate buy-down credit?
- Can we see the unit-by-unit rent roll, current vacancy, and any below-market leases? What's the average tenancy length?
- What capital expenditures (roof, boiler, parking lot, exteriors) have been made in the last 5 years, and what's planned in the next 2?
- Built in 1953 — when were the roof, HVAC, electrical panel, plumbing, and water heater last replaced?
- What's the actual annual flood-insurance premium (NFIP or private), and is the property in a SFHA with mandatory coverage?
- Is there a deadline driving the sale (1031 exchange, divorce, estate, relocation)? That informs how much negotiation room exists.
- The area grade is low — what's the realistic commute time and amenity access for the typical tenant pool here? Any planned neighborhood developments (good or bad) we should know about?
- What's the average days-on-market for RENTAL listings here right now (not sales)? A rising rental-DOM trend means longer vacancies and softer asking-rent achievability than the comps imply.
- What's the recent tenant-quality profile in this submarket — average credit score on applications, eviction rate, late-payment / NSF rate, and stable-employment percentage? A property-management company in the area should have these aggregated.
- How much new apartment / multifamily construction is in the pipeline within 1–3 miles? Heavy new supply (>2% of stock underway) typically softens rents 12–24 months out; light construction supports rent growth.
Investment metrics
- 1% rule
- 0.99% ✗
- Cap rate
- 7.44%
- Cash-on-cash
- 4.09%
- DSCR
- 1.18
- GRM
- 8.4
CMA / ARV
- ARV (on-the-fly)
- $596,925
- Comps found
- 1
Show comp detail 1 sale within ~0.75 mi
| Address | Dist | Beds/Ba | Sqft | Sold | Price | $/sf | Match |
|---|---|---|---|---|---|---|---|
| 508 SW 10th St | 0.54mi | 6/3.0 | 1,611 (+2%) | 23mo | $610,000 | $379 | 52 |
Match score weights: distance 35% · size 25% · config 20% · recency 20%. Top-matched comps best support the ARV.
Projected returns pro-forma
-3.0% appreciation · 0.43% rent growth · sell at horizon
- IRR
- -16.2%
- Equity multiple
- 0.44×
- Total profit
- $-137,773
- Equity at exit
- $131,062
- IRR
- -13.6%
- Equity multiple
- 0.31×
- Total profit
- $-170,321
- Equity at exit
- $76,000
Cash invested: $246,120 (down + closing). Projections, not guarantees.
Landlord ↔ Tenant lean methodology
- Overall (STATE)
- 87 Strongly Landlord-Friendly
- State Florida
- 87 Strongly Landlord-Friendly · R+3
- County
- — inherits STATE
- City
- — inherits STATE
ZIP-level market 33009
- Rents YoY
- 0.4%
- Active inventory
- 1384
- Price-to-rent
- 33.6×
Monthly cashflow live
- Estimated rent
- $8,725 medium interval (Pro) →
- Mortgage (P&I)
- −$4,610
- Tax from tax record
- −$1,078 /mo · $12,933/yr
- Insurance
- −$366
- Flood insurance flood zone
- −$427 /mo · $5,118/yr
- HOA
- −$0
- Lot rent
- −$0
- Vacancy / Maint / Mgmt
- −$1,832
- Net cashflow
- $413
Break-even live
Sensitivity live
| Price | -10% $910 | -5% $661 | +0% $413 | +5% $164 | +10% $-85 |
|---|---|---|---|---|---|
| Rent | -10% $-277 | -5% $68 | +0% $413 | +5% $757 | +10% $1,102 |
| Rate | -1.0pp $855 | -0.5pp $636 | base $413 | +0.5pp $185 | +1.0pp $-47 |
4-unit breakdown (identical units grouped — click to expand)
| Units | Beds | Baths | Est. rent |
|---|---|---|---|
| 4× units | 2 | 1 | $8,724 |
| #1 | 2 | 1 | $2,181 |
| #2 | 2 | 1 | $2,181 |
| #3 | 2 | 1 | $2,181 |
| #4 | 2 | 1 | $2,181 |
| Total (4 units) | $8,725 | ||
UW: 25.0% down · 7.5% · 30yr · 1.5% tax · 5.0% vac · 8.0% maint · 8.0% mgmt
Financing live
Cash to close
- Down payment
- $219,750
- Closing costs
- $26,370
- Reserves months
- —
- Total cash needed
- —
Loan-product check · same deal, 3 products live
Conventional
25% down · 7.5% · 30yr
- Down + closing
- —
- Monthly P&I
- —
- Monthly cashflow
- —
- DSCR
- —
- Eligible?
- —
Personal DTI + credit; lowest rate.
DSCR
20% down · 8.5% · 30yr
- Down + closing
- —
- Monthly P&I
- —
- Monthly cashflow
- —
- DSCR
- —
- Eligible?
- —
No personal income docs; deal must DSCR.
Hard money
10% down · 12.0% · 12mo
- Down + closing
- —
- Monthly P&I
- —
- Monthly cashflow
- —
- DSCR
- —
- Eligible?
- —
Short-term bridge; refi at stabilization.
Rent comps 35 comps
| Address | Beds | Baths | Sqft | Rent | $/sqft | DOM | Units | Dist |
|---|---|---|---|---|---|---|---|---|
| 215 SE 5th St Hallandale Beach, FL | 2.0–3.0 | 2.0 | 1133 | $2,700 | $2.38 | 26d | 5 | 0.37mi |
| 223 SW 10th St Hallandale Beach, FL | 3.0 | 3.0 | 1289 | $3,900 | $3.03 | 26d | 1 | 0.39mi |
| 707 SW 3rd Ave Hallandale Beach, FL | 3.0 | 2.0 | 1369 | $5,500 | $4.02 | 7d | 1 | 0.42mi |
| 211 SE 4th St #3 Hallandale Beach, FL | 3.0 | 2.5 | 1290 | $3,950 | $3.06 | 26d | 1 | 0.43mi |
| 301 SW 5th St Hallandale Beach, FL | 2.0 | 2.0 | 1792 | $4,000 | $2.23 | 23d | 1 | 0.52mi |
| 90 SW 3rd St Unit 2400 Hallandale Beach, FL | 2.0 | 2.0 | 1079 | $3,700 | $3.43 | 26d | 1 | 0.54mi |
| 644 SW 7th Ct Hallandale Beach, FL | 3.0 | 2.0 | 1492 | $3,800 | $2.55 | 5d | 1 | 0.70mi |
| 110 N Federal Hwy #1401 Hallandale Beach, FL | 2.0 | 2.0 | 1220 | $3,999 | $3.28 | 10d | 1 | 0.84mi |
| 232 SW 7th Ave Hallandale Beach, FL | 3.0 | 2.5 | 1941 | $3,900 | $2.01 | 17d | 1 | 0.84mi |
| 232 SW 7th Ave Hallandale Beach, FL | 3.0 | 2.5 | 1941 | $3,700 | $1.91 | 26d | 1 | 0.84mi |
| 839 SW 8th St #1 Hallandale Beach, FL | 2.0 | 1.5 | 1300 | $1,500 | $1.15 | 24d | 1 | 0.92mi |
| 401 N Federal Hwy Hallandale Beach, FL | 1.0–3.0 | 1.0–2.0 | 973 | $2,765 | $2.84 | 17d | 48 | 1.03mi |
| 401 SW 10th Ter Unit A Hallandale Beach, FL | 2.0 | 1.0 | 1200 | $2,400 | $2.00 | 23d | 1 | 1.22mi |
| 906 NE 6th St Hallandale Beach, FL | 3.0 | 2.0 | 1080 | $4,250 | $3.94 | 7d | 1 | 1.24mi |
| 906 NE 6th St Hallandale Beach, FL | 3.0 | 2.0 | 1080 | $4,250 | $3.94 | 26d | 1 | 1.24mi |
| 906 NE 6th St Hallandale Beach, FL | 3.0 | 2.0 | 1080 | $4,250 | $3.94 | 14d | 1 | 1.24mi |
| 1745 E Hallandale Beach Blvd Ph 05W Hallandale Beach, FL | 3.0 | 3.0 | 1715 | $5,000 | $2.92 | 5d | 1 | 1.24mi |
| 1101 NE 5th St Hallandale Beach, FL | 2.0 | 2.0 | 2200 | $6,200 | $2.82 | 19d | 1 | 1.25mi |
| 1745 E Hallandale Beach Blvd Unit 2302W Hallandale Beach, FL | 3.0 | 2.0 | 1481 | $3,900 | $2.63 | 26d | 1 | 1.26mi |
| 1745 E Hallandale Beach Blvd Unit 802W Hallandale Beach, FL | 3.0 | 2.0 | 1481 | $3,600 | $2.43 | 26d | 1 | 1.26mi |
| 1745 E Hallandale Beach Blvd Unit 2302W Hallandale Beach, FL | 3.0 | 2.0 | 1481 | $3,900 | $2.63 | 17d | 1 | 1.26mi |
| 1755 E Hallandale Beach Blvd Unit 2207E Hallandale Beach, FL | 2.0 | 2.0 | 1354 | $3,950 | $2.92 | 26d | 1 | 1.27mi |
| 1755 E Hallandale Beach Blvd Unit 1407E Hallandale Beach, FL | 2.0 | 2.0 | 1354 | $3,650 | $2.70 | 26d | 1 | 1.27mi |
| 1124 NE 6th St Hallandale Beach, FL | 3.0 | 2.0 | 1892 | $5,495 | $2.90 | 26d | 1 | 1.30mi |
| 322 SW 11th Ave Hallandale Beach, FL | 3.0 | 1.0 | 1200 | $2,699 | $2.25 | 26d | 1 | 1.30mi |
| 1077 SW 2nd St Unit 2 Hallandale Beach, FL | 2.0 | 1.0 | 1829 | $2,500 | $1.37 | 10d | 1 | 1.32mi |
| 201 Golden Isles Dr #302 Hallandale Beach, FL | 2.0 | 2.0 | 1150 | $3,975 | $3.46 | 26d | 1 | 1.33mi |
| 1124 NE 7th St Hallandale Beach, FL | 3.0 | 2.0 | 1320 | $3,900 | $2.95 | 24d | 1 | 1.34mi |
| 121 Golden Isles Dr #1 Hallandale Beach, FL | 2.0 | 2.0 | 1379 | $4,000 | $2.90 | 26d | 1 | 1.44mi |
| 2017 S Ocean Dr #1107 Hallandale Beach, FL | 2.0 | 2.0 | 1270 | $3,900 | $3.07 | 16d | 1 | 1.46mi |
| 200 E Pembroke Rd Hallandale Beach, FL | 3.0 | 1.0–2.0 | 1006 | $3,472 | $3.45 | 1d | 63 | 1.47mi |
| 2069 S Ocean Dr Unit TH16 Hallandale Beach, FL | 3.0 | 3.0 | 1614 | $4,500 | $2.79 | 5d | 1 | 1.49mi |
| 2069 S Ocean Dr Unit TH16 Hallandale Beach, FL | 3.0 | 3.0 | 1614 | $4,500 | $2.79 | 26d | 1 | 1.49mi |
| 2069 S Ocean Dr Unit TH12 Hallandale Beach, FL | 3.0 | 3.0 | 1500 | $4,800 | $3.20 | 26d | 1 | 1.49mi |
| 2069 S Ocean Dr Unit TH12 Hallandale Beach, FL | 3.0 | 3.0 | 1500 | $4,800 | $3.20 | 13d | 1 | 1.49mi |
Listing history 17 events
-
2026-06-22days on market $879,000 Active 33 DOM
-
2026-06-21days on market $879,000 Active 32 DOM
-
2026-06-18days on market $879,000 Active 29 DOM
-
2026-06-17days on market $879,000 Active 28 DOM
-
2026-06-16days on market $879,000 Active 27 DOM
-
2026-06-15days on market $879,000 Active 26 DOM
-
2026-06-13days on market $879,000 Active 24 DOM
-
2026-06-09days on market $879,000 Active 20 DOM
-
2026-06-08days on market $879,000 Active 19 DOM
-
2026-06-07days on market $879,000 Active 18 DOM
-
2026-06-04days on market $879,000 Active 15 DOM
-
2026-06-03days on market $879,000 Active 14 DOM
-
2026-06-02days on market $879,000 Active 13 DOM
-
2026-06-01days on market $879,000 Active 12 DOM
-
2026-05-31days on market $879,000 Active 11 DOM
-
2026-05-20$879,000 Active
-
1977-12-01soldstatus $55,000
ⓘ Source: listings_history table (triggers on properties + properties_extension) + one-shot
backfill from property_details.listing_events for pre-trigger history.
Tax reassessment forecast FL · Resets to sale price
- Current annual tax
- $12,933 · $1,078/mo
- Projected year-2 tax
- $12,933 · $1,078/mo
- Expected delta
- $0/yr ($0/mo · 0.0%)
ⓘ Screening estimate from a state-policy table — verify with the county assessor before closing.
Climate risk First Street
- Flood 7/10 Severe FEMA zone AE · 72% chance over 30 yrs
- Wildfire 1/10 Low
- Heat 10/10 Extreme 7 d/yr ≥104°F today · 26 d/yr by 30 yrs out
- Wind 10/10 Extreme 99% chance of damaging wind over 30 yrs
- Air quality 2/10 Low 1 unhealthy d/yr today · 2 by 30 yrs out
Nearby sold comps map
Loading sold comps map…
Walkable amenities ~0.75 mi
Loading nearby amenities…
Taxation est. · year 1
- Rental income
- $104,700
- − Mortgage interest
- −$49,238
- − Property taxes
- −$12,933
- − Insurance
- −$9,514
- − Repairs & maintenance
- −$8,376
- − Management
- −$8,376
- − Depreciation
- −$25,571
- Taxable loss
- −$9,307
- Est. tax savings @ 24.0%
- +$2,234
- After-tax cash flow
- $7,185/yr
For passive investors: Depreciation is non-cash, so a rental often shows a tax loss while cash-flowing — sheltering income. Rental losses are passive: they offset passive income freely, and up to $25,000/yr can offset ordinary (W-2) income if you actively participate and your MAGI is under $100k (phasing out to $0 by $150k); unused losses carry forward. On sale, claimed depreciation is recaptured at up to 25%, and gains may owe capital-gains tax (a 1031 exchange can defer both). Figures are a year-1 estimate at your 24.0% rate — not tax advice; consult a CPA.
Schools (NCES district)
- District
- Broward
- NCES district ID
- 1200180
- Math proficiency
- 42% ▼ -18.00%
- Reading proficiency
- 53% ▼ -5.00%
- Median HH income
- $52,139
- Composite
- 40.88/100
- National rank
- #3621
- State rank
- #46 of 73 in FL
Livability — Hallandale Beach
- Score
- 81/100
- State rank
- #86
- US rank
- #1400
Category grades
Schools grade is shown separately in the Schools card above.
Census & demographics
- Census place
- Hallandale Beach, FL
- County
- Broward County · 1,963,430 people
- City population
- 44,021
- Metro
- Miami-Fort Lauderdale-Pompano Beach, FL
- Population (ZIP)
- 44,502
- Household income
- $52,079
- Rent vs Own
- Severe rent burden
- 3293.0
Population outlook (Broward County) Hauer SSP2
- Today (2025)
- 2,207,033 people
- By 2030
- 2,360,704 · +7.0%
- By 2040
- 2,661,208 · +20.6%
- By 2050
- 2,946,698 · +33.5%
- By 2075
- 3,602,273 · +63.2%
- By 2100
- 3,970,984 · +79.9%
Race, ethnicity, and origin ACS 2023
- Neighborhood character
- Diverse neighborhood (Simpson 0.67)
- Race & ethnicity
- Hispanic / Latino 39% White 39% Two or more races 24% Black 17% Asian 1%
- Hispanic origin (detail)
- Mexican 2% Puerto Rican 3% Cuban 9% Dominican 3% Salvadoran 2%
- Common ancestry
- Scotch-Irish 5% Hispanic 5% Subsaharan African 3%
- Foreign-born
- 51% · Canada, Jamaica, Dominican Republic
- Languages at home
- 38% English-only · Spanish 36% Russian/Polish/Slavic 12% French/Haitian/Cajun 7%
Political lean MEDSL · Broward
- 2024 margin
- D (+17.0) · D 58.0% · R 41.0%
- 2008→2024 swing
- -17.8pp toward R · 2008: 34.7pp · 2024: 17.0pp
- All cycles
- 2024: D+17.0 2020: D+29.8 2016: D+35.0 2012: D+34.9 2008: D+34.7
Not yet ingested
- Civics
- —
Market trends
- HPI YoY
- ▼ -299.13%
- Current HPI
- 329.9081
- Rent YoY
- ▲ 0.43%
- Metro
- Miami-Fort Lauderdale-Pompano Beach, FL
- State GDP YoY
- ▲ 3.28%
- F500 in state
- 36
Industry mix (Fortune 500 HQ in FL)
| Industry | F500 HQs | Revenue |
|---|---|---|
| Industrial Technology | 2 | $29B |
|
||
| Insurance | 2 | $17B |
|
||
| Retail | 1 | $60B |
|
||
| Technology Distribution | 1 | $58B |
|
||
| Homebuilding | 1 | $35B |
|
||
| Technology Manufacturing | 1 | $35B |
|
||
Price history
+1498.2% since first listed2 events — show timeline
- 2026-05-20 Listed $879,000 Beaches MLS
- 1977-12-01 Sold (Public Records) $55,000 Public Records
Property tax history
+12.1%/yrLatest (2025): $12,933 · +14.8% YoY. Source: county tax records.
Cash-flow waterfall
monthlySold comps — $/sqft
last 12 mo · ≤1 miLoading sold comps…