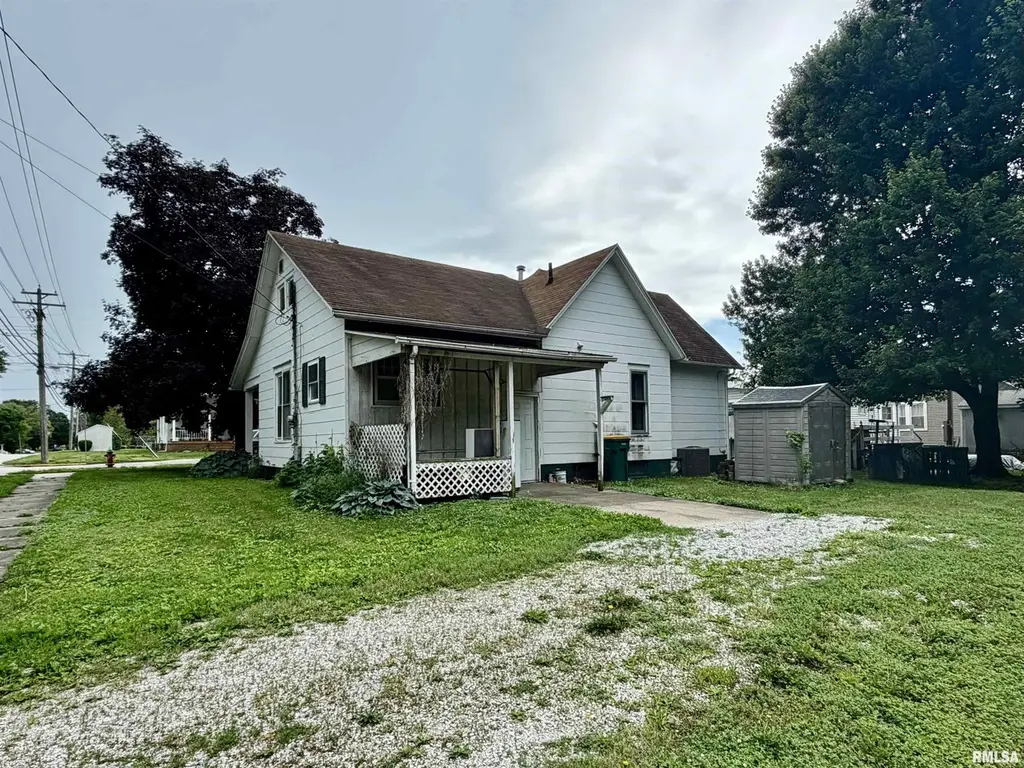
332 E Summit St · Macomb, IL
Flood risk 1/10 · Minimal
- FEMA flood zone
- —
- Chance of flooding over 30 yrs
- 0.0%
- Est. flood insurance / yr
- —
Fire risk 1/10 · Minimal
- Est. fire insurance / yr
- $804 – $1,492
Heat risk 3/10 · Minor
- Hot days now (above 107°F)
- 7 days/yr
- Hot days in 30 yrs
- 17 days/yr
Wind risk 2/10 · Minimal
- Chance of severe wind over 30 yrs
- —
Air-quality risk 2/10 · Minimal
- Unhealthy air days now
- 0 days/yr
- Unhealthy air days in 30 yrs
- 1 days/yr
Risk factors via First Street. Map © Google.
Why this score? — see what drove the C+ grade
The composite is a weighted blend of 9 inputs, each scored 0–100. Each bar is that input's sub-score; the figure is the points it added to the 100-point composite (weight × sub-score).
- Cash flow +25.0/30.0
- ARV discount +13.9/15.0
- DSCR +8.1/10.0
- 1% rule +7.5/10.0
- Livability +3.5/5.0
- Rent growth +2.5/5.0
- Condition / age +2.5/5.0
- Schools +1.8/10.0
- Appreciation +0.0/10.0
$79,000
🖨 Deal sheet (PDF) 📄 Offer letter ✓ Due diligence
Listing remarks
This 3-bedroom home sits on a spacious corner lot and features a full basement with plenty of storage in a quiet area. Conveniently located just minutes from McDonough District Hospital, shopping, and dining. Perfect for first-time buyers, young families, or investors looking for a solid opportunity.
Key facts
- Plenty of storage
- Full basement
- Corner lot
Tags
Property features AI
Exterior
- Parking: Gravel parking (no garage)
- Utilities: Public water; Public sewer
- Home design: Single-family residence; Built in 1920
- Construction: Shingle roof; Total living area listed as 1228
- Exterior features: Corner lot; Lot dimensions approximately 60 x 114
Interior
- Kitchen: Kitchen on main level (vinyl flooring, approx. 13 x 10 ft)
- Bedrooms: 3 bedrooms (all on the main level); Primary bedroom approx. 13 x 10 ft (hardwood flooring, egress window); Second bedroom approx. 13 x 12 ft (carpet, egress window); Third bedroom approx. 10 x 10 ft (carpet, egress window)
- Flooring: Hardwood in primary bedroom; Carpet in two bedrooms; Vinyl in kitchen
- Bathrooms: 1 full bathroom
- Heating & cooling: Forced-air heating
- Interior features: Full, unfinished basement; No fireplaces listed; Forced-air heating
Neighborhood map
What this means for you Summary
Snapshot
- This is a 3-bed/1.0-bath single-family listed at $79k.
Deal economics
- At list price, monthly cash flow is $172 ($2k/yr) — positive.
- The deal already cash-flows at list — no discount required.
- Meets the 1% rule at list price ($991 rent vs $79k).
- Cap rate 8.9% vs local median 6.0% in Macomb — top-decile yield for the area; either an underpriced asset or a hidden risk that comps aren't pricing in. Stress-test before assuming the spread holds.
Location & tenants
- Location reads 70/100 on livability (#379 in IL) — a middle-class / working-renter tenant base. Strengths: cost of living A+, health & safety A+, housing B; Watch: crime D, amenities D, commute F.
- Macomb CUSD 185 (town): math 19% / reading 26% proficiency, ranked #410 of 620 in IL (top 66%) — low school quality limits family demand, transient renter base, plan for 1-2y turnover.
- Zoned schools: Lincoln Elem School (math 17% / reading 12%, grade F, #1,278 of 2,056 statewide, top 65%, 548 students, 0% FRL); Edison Elementary School (math 15% / reading 22%, grade F, #438 of 665 statewide, top 67%, 432 students, 0% FRL); Macomb Senior High School (math 27% / reading 37%, grade F, #157 of 693 statewide, top 25%, 622 students, 0% FRL) — zoned schools average 0% FRL vs 40% district-wide (40 pts lower); this property's tenant base skews higher-income than the district average.
- Market conditions: 140 active listings in the ZIP; 1 comparable units currently listed for rent nearby.
Forward outlook
- Local home prices are declining (-3.0%/yr); year-one equity from $546 of loan paydown is wiped out by about $2k of value loss. Plan a longer hold.
Negotiation context
- Only 11 days on market — expect competitive offers; lowballing is unlikely to land.
- 3 sale attempts since 18y ago with the ask held roughly flat each time — persistent listings suggest the price (not the market) is what's stuck; bring a comps-based counter.
- Current owner paid $58k; 36% above their basis — modest negotiation headroom, anchor on the comps not their cost.
Risks & watch-outs
- Watch-outs: built in 1920 — expect roof / HVAC / electrical / plumbing capex.
Questions for the listing agent
- Built in 1920 — when were the roof, HVAC, electrical panel, plumbing, and water heater last replaced?
- Is there a deadline driving the sale (1031 exchange, divorce, estate, relocation)? That informs how much negotiation room exists.
- Schools are D-rated, which usually means shorter tenancies and higher turnover. Who's the typical renter profile here, and what's been the actual vacancy rate?
- Crime grade is D in this area — have there been break-ins, vandalism, or insurance claims at this property in the last 3 years? What carrier currently insures it and at what premium?
- What's the average days-on-market for RENTAL listings here right now (not sales)? A rising rental-DOM trend means longer vacancies and softer asking-rent achievability than the comps imply.
- What's the recent tenant-quality profile in this submarket — average credit score on applications, eviction rate, late-payment / NSF rate, and stable-employment percentage? A property-management company in the area should have these aggregated.
- How much new for-sale + rental construction is in the pipeline within 1–3 miles? Heavy new supply typically softens prices + rents 12–24 months out; constrained supply supports both.
Investment metrics
- 1% rule
- 1.25% ✓
- Cap rate
- 8.90%
- Cash-on-cash
- 9.31%
- DSCR
- 1.41
- GRM
- 6.6
CMA / ARV
- ARV (on-the-fly)
- $92,100
- Comps found
- 12
Show comp detail 12 sales within ~0.75 mi
| Address | Dist | Beds/Ba | Sqft | Sold | Price | $/sf | Match |
|---|---|---|---|---|---|---|---|
| 715 Lawndale Dr | 0.34mi | 3/1.5 | 1,232 (+0%) | 6mo | $167,500 | $136 | 77 |
| 820 Jamie Ln | 0.46mi | 3/2.0 | 1,208 (-2%) | 1mo | $120,000 | $99 | 71 |
| 404 W Fisk St | 0.51mi | 3/1.0 | 1,276 (+4%) | 1mo | $75,000 | $59 | 69 |
| 802 Bobby Ave | 0.25mi | 3/2.0 | 1,340 (+9%) | 3mo | $111,000 | $83 | 67 |
| 336 S Madison St | 0.37mi | 3/1.0 | 1,334 (+9%) | 8mo | $20,000 | $15 | 62 |
| 210 S White St | 0.68mi | 2/1.0 (-1) | 1,246 (+2%) | 3mo | $67,000 | $54 | 58 |
| 715 E Piper St | 0.42mi | 2/1.0 (-1) | 1,314 (+7%) | 9mo | $71,000 | $54 | 56 |
| 830 S Lafayette St | 0.25mi | 2/2.0 (-1) | 1,348 (+10%) | 10mo | $125,000 | $93 | 55 |
| 836 S Johnson St | 0.44mi | 3/1.0 | 1,374 (+12%) | 9mo | $81,000 | $59 | 52 |
| 404 W Kelly St | 0.51mi | 3/1.0 | 1,056 (-14%) | 4mo | $95,000 | $90 | 50 |
| 115 W Washington St | 0.57mi | 3/3.0 | 1,141 (-7%) | 10mo | $60,000 | $53 | 45 |
| 420 W Jefferson St | 0.71mi | 2/2.0 (-1) | 1,138 (-7%) | 3mo | $85,000 | $75 | 43 |
Match score weights: distance 35% · size 25% · config 20% · recency 20%. Top-matched comps best support the ARV.
Projected returns pro-forma
-3.0% appreciation · 3.0% rent growth · sell at horizon
- IRR
- -2.2%
- Equity multiple
- 0.92×
- Total profit
- $-1,814
- Equity at exit
- $11,779
- IRR
- 7.6%
- Equity multiple
- 1.58×
- Total profit
- $12,722
- Equity at exit
- $6,830
Cash invested: $22,120 (down + closing). Projections, not guarantees.
Landlord ↔ Tenant lean methodology
- Overall (STATE)
- 43 Moderately Tenant-Leaning
- State Illinois
- 43 Moderately Tenant-Leaning · D+7
- County
- — inherits STATE
- City
- — inherits STATE
ZIP-level market 61455
- Home prices YoY
- -33.3%
- Active inventory
- 140
- Price-to-rent
- 6.6×
Monthly cashflow live
- Estimated rent
- $991 medium interval (Pro) →
- Mortgage (P&I)
- −$414
- Tax from tax record
- −$164 /mo · $1,964/yr
- Insurance
- −$33
- HOA
- −$0
- Vacancy / Maint / Mgmt
- −$208
- Net cashflow
- $172
Break-even live
Sensitivity live
| Price | -10% $216 | -5% $194 | +0% $172 | +5% $149 | +10% $127 |
|---|---|---|---|---|---|
| Rent | -10% $93 | -5% $133 | +0% $172 | +5% $211 | +10% $250 |
| Rate | -1.0pp $211 | -0.5pp $192 | base $172 | +0.5pp $151 | +1.0pp $130 |
UW: 25.0% down · 7.5% · 30yr · 1.5% tax · 5.0% vac · 8.0% maint · 8.0% mgmt
Financing live
Cash to close
- Down payment
- $19,750
- Closing costs
- $2,370
- Reserves months
- —
- Total cash needed
- —
Loan-product check · same deal, 3 products live
Conventional
25% down · 7.5% · 30yr
- Down + closing
- —
- Monthly P&I
- —
- Monthly cashflow
- —
- DSCR
- —
- Eligible?
- —
Personal DTI + credit; lowest rate.
DSCR
20% down · 8.5% · 30yr
- Down + closing
- —
- Monthly P&I
- —
- Monthly cashflow
- —
- DSCR
- —
- Eligible?
- —
No personal income docs; deal must DSCR.
Hard money
10% down · 12.0% · 12mo
- Down + closing
- —
- Monthly P&I
- —
- Monthly cashflow
- —
- DSCR
- —
- Eligible?
- —
Short-term bridge; refi at stabilization.
Rent comps 1 comps
| Address | Beds | Baths | Sqft | Rent | $/sqft | DOM | Units | Dist |
|---|---|---|---|---|---|---|---|---|
| 902 N Charles St Macomb, IL | 2.0 | 1.5 | 840 | $695 | $0.83 | 45d | 1 | 1.40mi |
Listing history 9 events
-
2026-06-21days on market $79,000 Active 11 DOM
-
2026-06-19days on market $79,000 Active 9 DOM
-
2026-06-18days on market $79,000 Active 8 DOM
-
2026-06-17days on market $79,000 Active 7 DOM
-
2026-06-16days on market $79,000 Active 6 DOM
-
2026-06-15days on market $79,000 Active 5 DOM
-
2026-06-14days on market $79,000 Active 3 DOM
-
2026-06-12remarks 301-char remark
-
2026-06-12$79,000 Active 2 DOM
ⓘ Source: listings_history table (triggers on properties + properties_extension) + one-shot
backfill from property_details.listing_events for pre-trigger history.
Tax reassessment forecast IL · Partial reset (capped growth)
- Current annual tax
- $1,964 · $164/mo
- Projected year-2 tax
- $1,964 · $164/mo
- Expected delta
- $0/yr ($0/mo · 0.0%)
ⓘ Screening estimate from a state-policy table — verify with the county assessor before closing.
Climate risk First Street
- Flood 1/10 Low 0% chance over 30 yrs
- Wildfire 1/10 Low
- Heat 3/10 Moderate 7 d/yr ≥107°F today · 17 d/yr by 30 yrs out
- Wind 2/10 Low
- Air quality 2/10 Low 0 unhealthy d/yr today · 1 by 30 yrs out
Nearby sold comps map
Loading sold comps map…
Walkable amenities ~0.75 mi
Loading nearby amenities…
Taxation est. · year 1
- Rental income
- $11,887
- − Mortgage interest
- −$4,425
- − Property taxes
- −$1,964
- − Insurance
- −$395
- − Repairs & maintenance
- −$951
- − Management
- −$951
- − Depreciation
- −$2,298
- Taxable income
- $902
- Est. tax owed @ 24.0%
- −$217
- After-tax cash flow
- $1,843/yr
For passive investors: Depreciation is non-cash, so a rental often shows a tax loss while cash-flowing — sheltering income. Rental losses are passive: they offset passive income freely, and up to $25,000/yr can offset ordinary (W-2) income if you actively participate and your MAGI is under $100k (phasing out to $0 by $150k); unused losses carry forward. On sale, claimed depreciation is recaptured at up to 25%, and gains may owe capital-gains tax (a 1031 exchange can defer both). Figures are a year-1 estimate at your 24.0% rate — not tax advice; consult a CPA.
Schools (NCES district)
- District
- Macomb CUSD 185
- NCES district ID
- 1723920
- Math proficiency
- 19% ▼ -7.00%
- Reading proficiency
- 26% ▼ -8.00%
- Median HH income
- $34,162
- Composite
- 18.45/100
- National rank
- #8927
- State rank
- #410 of 620 in IL
Livability — Macomb
- Score
- 70/100
- State rank
- #379
- US rank
- #7918
Category grades
Schools grade is shown separately in the Schools card above.
Census & demographics
- Census place
- Macomb, IL
- County
- McDonough County · 17,317 people
- City population
- 17,317
- Metro
- Macomb, IL
- Population (ZIP)
- 17,317
- Household income
- $48,679
- Rent vs Own
- Severe rent burden
- 1062.0
Population outlook (McDonough County) Hauer SSP2
- Today (2025)
- 33,242 people
- By 2030
- 33,318 · +0.2%
- By 2040
- 33,520 · +0.8%
- By 2050
- 33,630 · +1.2%
- By 2075
- 33,657 · +1.2%
- By 2100
- 33,127 · -0.3%
Race, ethnicity, and origin ACS 2023
- Neighborhood character
- Predominantly White (81%)
- Race & ethnicity
- White 81% Black 9% Two or more races 5% Hispanic / Latino 5% Asian 3%
- Common ancestry
- Romanian 3% Italian 3% Iranian 2%
- Foreign-born
- 4% · Canada, South Korea, China
- Languages at home
- 94% English-only · Spanish 2% Other Indo-European 1% Russian/Polish/Slavic 1%
Political lean MEDSL · McDonough
- 2024 margin
- R (+18.9) · D 39.7% · R 58.5% · Other 1.8%
- 2008→2024 swing
- -24.4pp toward R · 2008: 5.6pp · 2024: -18.9pp
- All cycles
- 2024: R+18.9 2020: R+16.6 2016: R+11.7 2012: R+1.5 2008: D+5.6
Not yet ingested
- Civics
- —
Market trends
- HPI YoY
- ▼ -70.20%
- Current HPI
- 140.4351
- Rent YoY
- —
- Metro
- Macomb, IL
- State GDP YoY
- ▲ 1.59%
- F500 in state
- 60
Industry mix (Fortune 500 HQ in IL)
| Industry | F500 HQs | Revenue |
|---|---|---|
| Insurance | 4 | $201B |
|
||
| Consumer Goods | 4 | $87B |
|
||
| Industrial Machinery | 3 | $64B |
|
||
| Healthcare | 2 | $55B |
|
||
| Retail / Pharmacy | 1 | $148B |
|
||
| Agriculture / Food | 1 | $86B |
|
||
Price history
+17.9% since first listed8 events — show timeline
- 2026-06-10 Listed $79,000 RMLSA as Distributed by MLS Grid
- 2021-08-06 Listing Removed — RMLSA as Distributed by MLS Grid
- 2021-08-06 Listing Removed — RMLSA as Distributed by MLS Grid
- 2021-06-22 Sold (Public Records) $57,900 Public Records
- 2021-06-18 Sold (MLS) $57,900 RMLSA as Distributed by MLS Grid
- 2020-09-01 Listed $59,900 RMLSA as Distributed by MLS Grid
- 2008-10-29 Sold (MLS) $60,000 RMLSA as Distributed by MLS Grid
- 2008-10-01 Listed $67,000 RMLSA as Distributed by MLS Grid
Property tax history
+3.1%/yrLatest (2024): $1,964 · -1.0% YoY. Source: county tax records.
Cash-flow waterfall
monthlySold comps — $/sqft
last 12 mo · ≤1 miLoading sold comps…