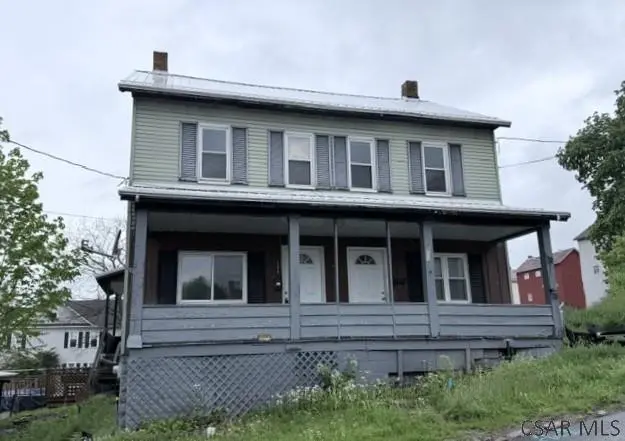
 Duplex
509-511 Broad St · South Fork, PA
Flood risk 1/10 · Minimal
- FEMA flood zone
- X (unshaded)
- Chance of flooding over 30 yrs
- 0.0%
- Est. flood insurance / yr
- $507 – $1,088
Fire risk 1/10 · Minimal
- Est. fire insurance / yr
- $511 – $949
Heat risk 3/10 · Minor
- Hot days now (above 92°F)
- 8 days/yr
- Hot days in 30 yrs
- 20 days/yr
Wind risk 2/10 · Minimal
- Chance of severe wind over 30 yrs
- —
Air-quality risk 3/10 · Minor
- Unhealthy air days now
- 2 days/yr
- Unhealthy air days in 30 yrs
- 4 days/yr
Risk factors via First Street. Map © Google.
Why this score? — see what drove the B grade
The composite is a weighted blend of 9 inputs, each scored 0–100. Each bar is that input's sub-score; the figure is the points it added to the 100-point composite (weight × sub-score).
- Cash flow +30.0/30.0
- 1% rule +10.0/10.0
- DSCR +10.0/10.0
- Appreciation +5.6/10.0
- ARV discount +4.5/15.0
- Schools +3.7/10.0
- Livability +2.8/5.0
- Rent growth +2.5/5.0
- Condition / age +2.5/5.0
$49,900
🖨 Deal sheet 📄 Offer letter ✓ Due diligence
Multi-family units
County records classify this as Multi-Family (2-4 Unit). Listing-text estimate: 2 units. confirmed
Listing remarks
EXPAND YOUR REAL ESTATE PORTFOLIO. .. this 2-unit home in South Fork Boro could be a great addition. Each of the units include living room, dining room, kitchen, 3 bedrooms, and full bath. Both units have oil forced air heat, metal roof, separate utilities, coverd porches, and off-street parking. Windows have been replaced and have lifetime transferable warranty. Don't miss the opportunity - call today for more details, to receive your tour packet, and to schedule a personal tour!
Key facts
- Kitchen
- Living room
- 2 unit home
Tags
Property features AI
Exterior
- Parking: Off-street parking
- Utilities: Public sewer
- Home design: Multi-family residential income property; 2-story building
- Construction: Frame construction; Metal roof
- Exterior features: Covered porch
Interior
- Bedrooms: Two 3-bedroom units
- Flooring: Carpet; Hardwood; Laminate; Wood
- Bathrooms: Each unit has 1 bathroom
- Heating & cooling: Oil forced-air heating
- Interior features: Full basement
Neighborhood map
What this means for you Summary
Snapshot
- This is a 2 × 3-bed/1.0-bath units multifamily listed at $50k.
Deal economics
- At list price, monthly cash flow is $1k ($15k/yr) — positive. Per door: $623/mo.
- The deal already cash-flows at list — no discount required.
- Meets the 1% rule at list price ($2k rent vs $50k).
- Recommended offer: $49k (1.5% below list) — sets the bar for market timing.
Location & tenants
- Location reads 56/100 on livability (#1,644 in PA) — a working-class tenant base; expect higher turnover. Strengths: cost of living A+, housing B+; Watch: crime D, schools F, amenities F.
- Forest Hills SD (rural): math 40% / reading 47% proficiency, ranked #293 of 539 in PA (top 54%) — families likely to look elsewhere, expect single-tenant / working-renter base with shorter leases.
- Market conditions: 8 active listings in the ZIP; 64 units permitted in Cambria County in 2024 (0 in 5+ unit buildings).
Forward outlook
- In year one you build about $961 of equity ($345 loan paydown + $616 appreciation (1.2% local appreciation)).
- Cambria County population projected at -28% by 2050 — secular population decline; favor cash flow + early exit over multi-decade hold.
- At projected returns (1.2% appreciation + 3.0% rent growth), your $14k cash investment doubles in ~1 year — after that, you're playing with house money.
Negotiation context
- It's been on market 27 days — a 2% lower offer ($49k) is reasonable based on typical stale-listing flexibility.
- 2 sale attempts with the ask held roughly flat each time — persistent listings suggest the price (not the market) is what's stuck; bring a comps-based counter.
- Current owner paid $27k; list at $50k implies a 85% gain — meaningful room to come down on a strong offer.
Questions for the listing agent
- Can we see the unit-by-unit rent roll, current vacancy, and any below-market leases? What's the average tenancy length?
- What capital expenditures (roof, boiler, parking lot, exteriors) have been made in the last 5 years, and what's planned in the next 2?
- Is there a deadline driving the sale (1031 exchange, divorce, estate, relocation)? That informs how much negotiation room exists.
- Schools are F-rated, which usually means shorter tenancies and higher turnover. Who's the typical renter profile here, and what's been the actual vacancy rate?
- Crime grade is D in this area — have there been break-ins, vandalism, or insurance claims at this property in the last 3 years? What carrier currently insures it and at what premium?
- What's the average days-on-market for RENTAL listings here right now (not sales)? A rising rental-DOM trend means longer vacancies and softer asking-rent achievability than the comps imply.
- What's the recent tenant-quality profile in this submarket — average credit score on applications, eviction rate, late-payment / NSF rate, and stable-employment percentage? A property-management company in the area should have these aggregated.
- How much new apartment / multifamily construction is in the pipeline within 1–3 miles? Heavy new supply (>2% of stock underway) typically softens rents 12–24 months out; light construction supports rent growth.
Investment metrics
- 1% rule
- 4.09% ✓
- Cap rate
- 36.27%
- Cash-on-cash
- 107.07%
- DSCR
- 5.76
- GRM
- 2.0
CMA / ARV
- ARV (median comp)
- $46,789
- List price
- $49,900
- Delta
- 6.65%
- Verdict
- FAIR
- Comps
- 3 within 1.0 mi
Projected returns pro-forma
1.24% appreciation · 3.0% rent growth · sell at horizon
- IRR
- —
- Equity multiple
- 6.79×
- Total profit
- $80,952
- Equity at exit
- $17,649
- IRR
- —
- Equity multiple
- 14.10×
- Total profit
- $182,994
- Equity at exit
- $23,935
Cash invested: $13,972 (down + closing). Projections, not guarantees.
Landlord ↔ Tenant lean methodology
- Overall (STATE)
- 62 Landlord-Friendly
- State Pennsylvania
- 62 Landlord-Friendly · EVEN
- County
- — inherits STATE
- City
- — inherits STATE
ZIP-level market 15956
- Home prices YoY
- 1.9%
- Active inventory
- 8
- Price-to-rent
- 4.1×
Monthly cashflow live
- Estimated rent
- $2,040 medium interval (Pro) →
- Mortgage (P&I)
- −$262
- Tax from tax record
- −$82 /mo · $990/yr
- Insurance
- −$21
- HOA
- −$0
- Vacancy / Maint / Mgmt
- −$428
- Net cashflow
- $1,247
Break-even live
2-unit breakdown (identical units grouped — click to expand)
| Units | Beds | Baths | Est. rent |
|---|---|---|---|
| 2× units | 3 | 1 | $2,040 |
| #1 | 3 | 1 | $1,020 |
| #2 | 3 | 1 | $1,020 |
| Total (2 units) | $2,040 | ||
UW: 25.0% down · 7.5% · 30yr · 1.5% tax · 5.0% vac · 8.0% maint · 8.0% mgmt
Financing live
Cash to close
- Down payment
- $12,475
- Closing costs
- $1,497
- Reserves months
- —
- Total cash needed
- —
Loan-product check · same deal, 3 products live
Conventional
25% down · 7.5% · 30yr
- Down + closing
- —
- Monthly P&I
- —
- Monthly cashflow
- —
- DSCR
- —
- Eligible?
- —
Personal DTI + credit; lowest rate.
DSCR
20% down · 8.5% · 30yr
- Down + closing
- —
- Monthly P&I
- —
- Monthly cashflow
- —
- DSCR
- —
- Eligible?
- —
No personal income docs; deal must DSCR.
Hard money
10% down · 12.0% · 12mo
- Down + closing
- —
- Monthly P&I
- —
- Monthly cashflow
- —
- DSCR
- —
- Eligible?
- —
Short-term bridge; refi at stabilization.
Listing history 11 events
-
2026-06-08statusdays on market $49,900 Pending 27 DOM
-
2026-06-07days on market $49,900 Active 26 DOM
-
2026-06-04days on market $49,900 Active 23 DOM
-
2026-06-02days on market $49,900 Active 22 DOM
-
2026-06-01days on market $49,900 Active 21 DOM
-
2026-05-31days on market $49,900 Active 20 DOM
-
2026-05-19status Active 485-char remark
-
2026-05-11status Pending 485-char remark
-
2026-05-04$49,900 Active 485-char remark
-
2009-09-04soldstatus $27,000
-
1989-10-01soldstatus $22,000
ⓘ Source: listings_history table (triggers on properties + properties_extension) + one-shot
backfill from property_details.listing_events for pre-trigger history.
Tax reassessment forecast PA · Partial reset (capped growth)
- Current annual tax
- $990 · $82/mo
- Projected year-2 tax
- $990 · $82/mo
- Expected delta
- $0/yr ($0/mo · 0.0%)
ⓘ Screening estimate from a state-policy table — verify with the county assessor before closing.
Climate risk First Street
- Flood 1/10 Low FEMA zone X (unshaded) · 0% chance over 30 yrs
- Wildfire 1/10 Low
- Heat 3/10 Moderate 8 d/yr ≥92°F today · 20 d/yr by 30 yrs out
- Wind 2/10 Low
- Air quality 3/10 Moderate 2 unhealthy d/yr today · 4 by 30 yrs out
Nearby sold comps map
Loading sold comps map…
Walkable amenities ~0.75 mi
Loading nearby amenities…
Taxation est. · year 1
- Rental income
- $24,480
- − Mortgage interest
- −$2,795
- − Property taxes
- −$990
- − Insurance
- −$250
- − Repairs & maintenance
- −$1,958
- − Management
- −$1,958
- − Depreciation
- −$1,452
- Taxable income
- $15,077
- Est. tax owed @ 24.0%
- −$3,618
- After-tax cash flow
- $11,341/yr
For passive investors: Depreciation is non-cash, so a rental often shows a tax loss while cash-flowing — sheltering income. Rental losses are passive: they offset passive income freely, and up to $25,000/yr can offset ordinary (W-2) income if you actively participate and your MAGI is under $100k (phasing out to $0 by $150k); unused losses carry forward. On sale, claimed depreciation is recaptured at up to 25%, and gains may owe capital-gains tax (a 1031 exchange can defer both). Figures are a year-1 estimate at your 24.0% rate — not tax advice; consult a CPA.
Schools (NCES district)
- District
- Forest Hills SD
- NCES district ID
- 4209940
- Math proficiency
- 40% ▼ -8.00%
- Reading proficiency
- 47% ▼ -20.00%
- Median HH income
- $48,950
- Composite
- 37.27/100
- National rank
- #4452
- State rank
- #293 of 539 in PA
Livability — South Fork
- Score
- 56/100
- State rank
- #1644
- US rank
- #22758
Category grades
Schools grade is shown separately in the Schools card above.
Census & demographics
- Census place
- South Fork, PA
- Population (ZIP)
- 2,464
Population outlook (Cambria County) Hauer SSP2
- Today (2025)
- 122,754 people
- By 2030
- 115,827 · -5.6%
- By 2040
- 101,309 · -17.5%
- By 2050
- 88,379 · -28.0%
- By 2075
- 65,237 · -46.9%
- By 2100
- 46,909 · -61.8%
Race, ethnicity, and origin ACS 2023
- Neighborhood character
- Predominantly White (96%)
- Race & ethnicity
- White 96% Two or more races 3% Hispanic / Latino 1%
- Common ancestry
- Romanian 7% Iranian 6% Polish 2%
- Foreign-born
- 0%
Political lean MEDSL · Cambria
- 2024 margin
- Solid R (+39.7) · D 29.8% · R 69.5%
- 2008→2024 swing
- -40.4pp toward R · 2008: 0.7pp · 2024: -39.7pp
- All cycles
- 2024: R+39.7 2020: R+37.3 2016: R+37.8 2012: R+17.8 2008: D+0.7
Not yet ingested
- Civics
- —
Market trends
- HPI YoY
- ▲ 1.24%
- Current HPI
- 65.5057
- Rent YoY
- —
- Metro
- —
- State GDP YoY
- ▲ 1.68%
- F500 in state
- 34
Industry mix (Fortune 500 HQ in PA)
| Industry | F500 HQs | Revenue |
|---|---|---|
| Healthcare | 2 | $309B |
|
||
| Insurance | 2 | $27B |
|
||
| Telecommunications / Media | 1 | $124B |
|
||
| Industrial Distribution | 1 | $22B |
|
||
| Financial Services | 1 | $20B |
|
||
| Chemicals / Materials | 1 | $18B |
|
||
Price history
+126.8% since first listed6 events — show timeline
- 2026-06-07 Pending — CSMLS
- 2026-05-19 Relisted — CSMLS
- 2026-05-11 Pending — CSMLS
- 2026-05-04 Listed $49,900 CSMLS
- 2009-09-04 Sold (Public Records) $27,000 Public Records
- 1989-10-01 Sold (Public Records) $22,000 Public Records
Property tax history
+2.3%/yrLatest (2026): $990 · +2.7% YoY. Source: county tax records.
Cash-flow waterfall
monthlySold comps — $/sqft
last 12 mo · ≤1 miLoading sold comps…