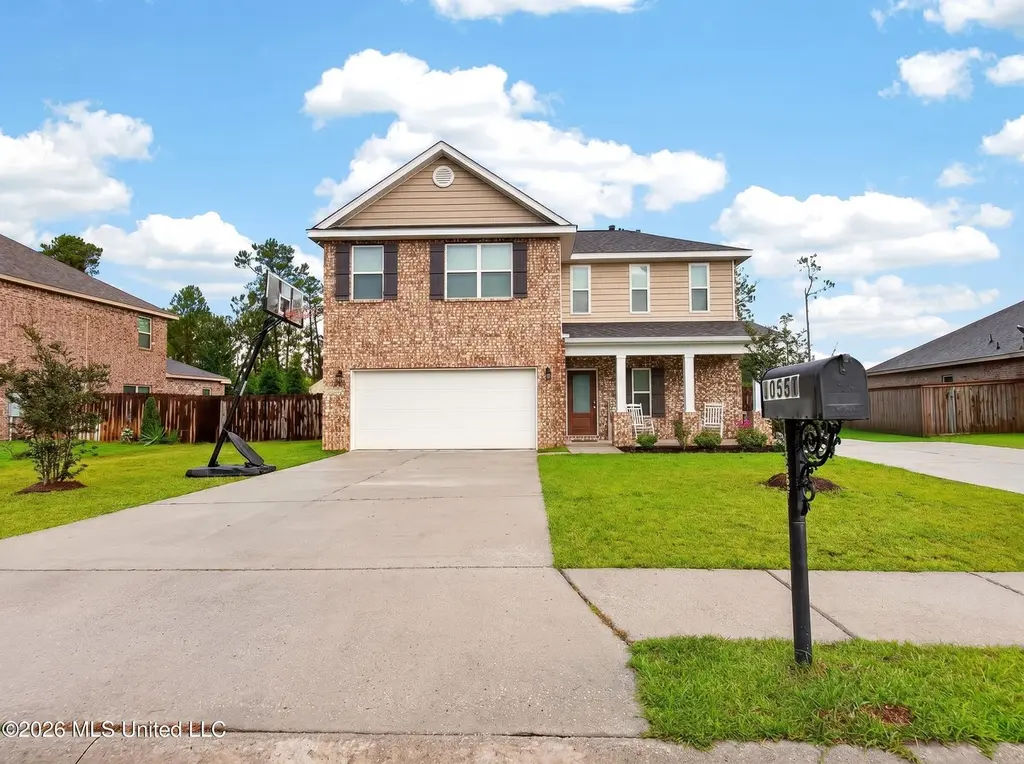
10557 Sweet Bay Dr · Gulfport, MS
Flood risk 1/10 · Minimal
- FEMA flood zone
- X (unshaded)
- Chance of flooding over 30 yrs
- 0.0%
- Est. flood insurance / yr
- $507 – $1,088
Fire risk 7/10 · Major
- Est. fire insurance / yr
- $1,241 – $2,305
Heat risk 9/10 · Severe
- Hot days now (above 108°F)
- 7 days/yr
- Hot days in 30 yrs
- 22 days/yr
Wind risk 9/10 · Severe
- Chance of severe wind over 30 yrs
- 99.0%
Air-quality risk 1/10 · Minimal
- Unhealthy air days now
- 0 days/yr
- Unhealthy air days in 30 yrs
- 0 days/yr
Risk factors via First Street. Map © Google.
Why this score? — see what drove the D- grade
The composite is a weighted blend of 9 inputs, each scored 0–100. Each bar is that input's sub-score; the figure is the points it added to the 100-point composite (weight × sub-score).
- Cash flow +10.9/30.0
- ARV discount +5.0/15.0
- Rent growth +4.2/5.0
- Schools +4.2/10.0
- Livability +3.7/5.0
- DSCR +3.1/10.0
- Condition / age +2.5/5.0
- 1% rule +2.2/10.0
- Appreciation +0.0/10.0
$332,000
🖨 Deal sheet (PDF) 📄 Offer letter ✓ Due diligence
Listing remarks MLS
Gorgeous 4br/2.5Ba on a huge lot. Home features a beautiful open floor plan, granite counter tops, large Island, dining area, large living room, laundry room, downstairs master bedroom with on suite, 3 bedrooms upstairs with bathroom, and huge 2nd living area, double-car garage, and privacy fence. Call today for your appointment!!!
Key facts
- Granite countertops
- Upstairs living room
- Crown molding
Tags
Property features AI
Finance
- HOA & community: Association present
Exterior
- Parking: Attached carport; Concrete parking pad; Storage; 2-car garage; Total parking for 8 vehicles
- Security: Prewired for security; Owned security system; Smoke detectors
- Utilities: Public sewer; Community water; Electricity connected; Phone available; Sewer connected; Water connected; Underground utilities
- Home design: Single-family house; Two levels; Move-in ready
- Construction: Brick construction; Shingle roof; Brick/mortar and slab foundation; Built by builder (year built source: Builder)
- Exterior features: Front porch; Rear porch; Rain gutters; Wood fencing; Pond on property; Shed(s); RV/boat storage
Interior
- Kitchen: Dishwasher; Disposal; Electric range; Ice maker; Microwave; Oven; Self-cleaning oven; Refrigerator; Stainless steel appliances; ENERGY STAR qualified dishwasher; Granite counters; Kitchen island; Pantry
- Bedrooms: Bedrooms located on main and upper levels (primary on main)
- Flooring: Luxury vinyl
- Bathrooms: Two full bathrooms and one half bathroom (total 3)
- Heating & cooling: Central heating; Central air conditioning
- Interior features: Ceiling fans; Crown molding; Double vanity; Granite counters; High-speed internet; Kitchen island; Pantry; Primary bedroom on main level; Recessed lighting; Soaking tub; Storage; Walk-in closets; Blinds; Insulated windows; Dead bolt locks; French doors
- Laundry & utility: Laundry room with inside electric dryer hookup; Electric water heater; Water heater
Neighborhood map
What this means for you Summary
Snapshot
- This is a 4-bed/2.0-bath single-family listed at $332k.
Deal economics
- At list price, monthly cash flow is $-148 ($-2k/yr) — negative.
- To cash-flow at today's rent, offer at most $306k (7.9% below list).
- To meet the 1% rule (rent ≥ 1% of price), the offer needs to be $239k (27.9% below list).
- Recommended offer: $239k (27.9% below list) — sets the bar for 1% rule.
Location & tenants
- Location reads 73/100 on livability (#15 in MS) — a middle-class / working-renter tenant base. Strengths: cost of living A+, housing A+, health & safety A+; Watch: amenities F, commute F, employment F.
- Harrison County School District (rural): math 52% / reading 46% proficiency, ranked #14 of 130 in MS (top 11%) — families likely to look elsewhere, expect single-tenant / working-renter base with shorter leases; 62% free/reduced lunch — lower-income household profile, screen leases tightly.
- Zoned schools: West Harrison Middle School (653 students, 100% FRL); West Harrison High School (math 57% / reading 52%, grade C-, #10 of 197 statewide, top 5%, 1,124 students, 100% FRL) — zoned schools average 100% FRL vs 62% district-wide (37 pts higher); higher-poverty schools than district average — tighter screening recommended.
- Market conditions: Rents rising fast (+7.0%/yr); 769 active listings in the ZIP; 2 comparable units currently listed for rent nearby; 2,194 units permitted in Harrison County in 2024 (0 in 5+ unit buildings).
- At $2,392/mo this rent would consume 46% of the median local household income ($63k/yr) (locally 1686% of renters already pay >50% of income on rent) — very limited rent-growth headroom before tenants either downsize or default.
Forward outlook
- Local home prices are declining (-3.0%/yr); year-one equity from $2k of loan paydown is wiped out by about $10k of value loss. Plan a longer hold.
- Harrison County population projected at +27% by 2050 — long-run rental-demand tailwind backs the buy-and-hold thesis.
Negotiation context
- It's been on market 15 days — a 2% lower offer ($327k) is reasonable based on typical stale-listing flexibility.
- 3 sale attempts since 7y ago with the ask held roughly flat each time — persistent listings suggest the price (not the market) is what's stuck; bring a comps-based counter.
- Current owner paid $218k; list at $332k implies a 52% gain — meaningful room to come down on a strong offer.
Risks & watch-outs
- Climate carrying-cost: severe wind risk, 99% chance of damaging wind over 30y; major wildfire risk; extreme-heat days projected 7→22/yr by 2055 (HVAC capex compounding) — expect insurance premiums to compound above CPI over the hold.
Questions for the listing agent
- What do current leases actually rent for vs. the listed asking? Can we see a recent rent roll and the last 12 months of T-12 income?
- Is there a deadline driving the sale (1031 exchange, divorce, estate, relocation)? That informs how much negotiation room exists.
- Schools are D-rated, which usually means shorter tenancies and higher turnover. Who's the typical renter profile here, and what's been the actual vacancy rate?
- The area grade is low — what's the realistic commute time and amenity access for the typical tenant pool here? Any planned neighborhood developments (good or bad) we should know about?
- What's the average days-on-market for RENTAL listings here right now (not sales)? A rising rental-DOM trend means longer vacancies and softer asking-rent achievability than the comps imply.
- What's the recent tenant-quality profile in this submarket — average credit score on applications, eviction rate, late-payment / NSF rate, and stable-employment percentage? A property-management company in the area should have these aggregated.
- How much new for-sale + rental construction is in the pipeline within 1–3 miles? Heavy new supply typically softens prices + rents 12–24 months out; constrained supply supports both.
Investment metrics
- 1% rule
- 0.72% ✗
- Cap rate
- 5.76%
- Cash-on-cash
- -1.91%
- DSCR
- 0.91
- GRM
- 11.6
CMA / ARV
- ARV (on-the-fly)
- $314,704
- Comps found
- 12
Show comp detail 12 sales within ~0.75 mi
| Address | Dist | Beds/Ba | Sqft | Sold | Price | $/sf | Match |
|---|---|---|---|---|---|---|---|
| 10510 Sweet Bay Dr | 0.10mi | 4/2.5 | 2,306 (-0%) | 6mo | $339,000 | $147 | 87 |
| 10260 Orchid Magnolia Dr | 0.21mi | 4/2.0 | 2,291 (-1%) | 5mo | $299,000 | $131 | 84 |
| 10522 Sweet Bay Dr | 0.08mi | 4/2.5 | 2,256 (-2%) | 9mo | $299,500 | $133 | 83 |
| 18255 Tulip Cv | 0.07mi | 4/2.5 | 2,355 (+2%) | 12mo | $339,900 | $144 | 82 |
| 10274 Orchid Magnolia Dr | 0.21mi | 4/2.0 | 2,406 (+4%) | 9mo | $315,000 | $131 | 76 |
| 18512 Elkwood Dr | 0.40mi | 4/2.5 | 2,338 (+1%) | 12mo | $307,000 | $131 | 68 |
| 10631 Sweet Bay Dr | 0.13mi | 5/2.5 (+1) | 2,626 (+14%) | 2mo | $319,900 | $122 | 63 |
| 10456 Willow Leaf Dr | 0.34mi | 4/2.0 | 2,054 (-11%) | 4mo | $300,000 | $146 | 62 |
| 10358 Sweet Bay Dr | 0.30mi | 3/2.0 (-1) | 1,990 (-14%) | 2mo | $250,000 | $126 | 56 |
| 18526 Elkwood Dr | 0.41mi | 4/2.0 | 2,054 (-11%) | 8mo | $279,000 | $136 | 55 |
| 18037 Big Leaf Dr | 0.48mi | 5/3.0 (+1) | 2,495 (+8%) | 7mo | $365,000 | $146 | 50 |
| 19018 Landon Rd | 0.74mi | 3/2.0 (-1) | 2,627 (+14%) | 12mo | $426,000 | $162 | 28 |
Match score weights: distance 35% · size 25% · config 20% · recency 20%. Top-matched comps best support the ARV.
Projected returns pro-forma
-3.0% appreciation · 6.99% rent growth · sell at horizon
- IRR
- -15.6%
- Equity multiple
- 0.43×
- Total profit
- $-53,366
- Equity at exit
- $49,502
- IRR
- -2.0%
- Equity multiple
- 0.84×
- Total profit
- $-14,603
- Equity at exit
- $28,705
Cash invested: $92,960 (down + closing). Projections, not guarantees.
Landlord ↔ Tenant lean methodology
- Overall (STATE)
- 90 Strongly Landlord-Friendly
- State Mississippi
- 90 Strongly Landlord-Friendly · R+11
- County
- — inherits STATE
- City
- — inherits STATE
ZIP-level market 39503
- Home prices YoY
- -21.5%
- Rents YoY
- 7.0%
- Active inventory
- 769
- Price-to-rent
- 11.6×
Monthly cashflow live
- Estimated rent
- $2,392 medium interval (Pro) →
- Mortgage (P&I)
- −$1,741
- Tax from tax record
- −$159 /mo · $1,905/yr
- Insurance
- −$138
- HOA
- −$0
- Vacancy / Maint / Mgmt
- −$502
- Net cashflow
- $-148
Break-even live
Sensitivity live
| Price | -10% $40 | -5% $-54 | +0% $-148 | +5% $-242 | +10% $-336 |
|---|---|---|---|---|---|
| Rent | -10% $-337 | -5% $-243 | +0% $-148 | +5% $-54 | +10% $41 |
| Rate | -1.0pp $19 | -0.5pp $-64 | base $-148 | +0.5pp $-234 | +1.0pp $-322 |
UW: 25.0% down · 7.5% · 30yr · 1.5% tax · 5.0% vac · 8.0% maint · 8.0% mgmt
Financing live
Cash to close
- Down payment
- $83,000
- Closing costs
- $9,960
- Reserves months
- —
- Total cash needed
- —
Loan-product check · same deal, 3 products live
Conventional
25% down · 7.5% · 30yr
- Down + closing
- —
- Monthly P&I
- —
- Monthly cashflow
- —
- DSCR
- —
- Eligible?
- —
Personal DTI + credit; lowest rate.
DSCR
20% down · 8.5% · 30yr
- Down + closing
- —
- Monthly P&I
- —
- Monthly cashflow
- —
- DSCR
- —
- Eligible?
- —
No personal income docs; deal must DSCR.
Hard money
10% down · 12.0% · 12mo
- Down + closing
- —
- Monthly P&I
- —
- Monthly cashflow
- —
- DSCR
- —
- Eligible?
- —
Short-term bridge; refi at stabilization.
Rent comps 2 comps
| Address | Beds | Baths | Sqft | Rent | $/sqft | DOM | Units | Dist |
|---|---|---|---|---|---|---|---|---|
| 10536 Sweet Bay Dr Gulfport, MS | 4.0 | 2.0 | 1961 | $2,349 | $1.20 | 14d | 1 | 0.02mi |
| 18186 Southern Magnolia Cv Gulfport, MS | 4.0 | 2.0 | 2054 | $2,300 | $1.12 | 14d | 1 | 0.27mi |
Listing history 12 events
-
2026-06-21days on market $332,000 Active 15 DOM
-
2026-06-18days on market $332,000 Active 12 DOM
-
2026-06-17days on market $332,000 Active 11 DOM
-
2026-06-16days on market $332,000 Active 10 DOM
-
2026-06-15days on market $332,000 Active 9 DOM
-
2026-06-14days on market $332,000 Active 7 DOM
-
2026-06-13days on market $332,000 Active 6 DOM
-
2026-06-10days on market $332,000 Active 4 DOM
-
2026-06-09days on market $332,000 Active 3 DOM
-
2026-06-08days on market $332,000 Active 2 DOM
-
2026-06-07remarks 642-char remark
-
2026-06-07$332,000 Active 1 DOM
ⓘ Source: listings_history table (triggers on properties + properties_extension) + one-shot
backfill from property_details.listing_events for pre-trigger history.
Tax reassessment forecast MS · Resets to sale price
- Current annual tax
- $1,905 · $159/mo
- Projected year-2 tax
- $2,623 · $219/mo
- Expected delta
- +$718/yr (+$60/mo · 37.7%)
ⓘ Screening estimate from a state-policy table — verify with the county assessor before closing.
Climate risk First Street
- Flood 1/10 Low FEMA zone X (unshaded) · 0% chance over 30 yrs
- Wildfire 7/10 Severe
- Heat 9/10 Extreme 7 d/yr ≥108°F today · 22 d/yr by 30 yrs out
- Wind 9/10 Extreme 99% chance of damaging wind over 30 yrs
- Air quality 1/10 Low 0 unhealthy d/yr today · 0 by 30 yrs out
Nearby sold comps map
Loading sold comps map…
Walkable amenities ~0.75 mi
Loading nearby amenities…
Taxation est. · year 1
- Rental income
- $28,709
- − Mortgage interest
- −$18,597
- − Property taxes
- −$1,905
- − Insurance
- −$1,660
- − Repairs & maintenance
- −$2,297
- − Management
- −$2,297
- − Depreciation
- −$9,658
- Taxable loss
- −$7,705
- Est. tax savings @ 24.0%
- +$1,849
- After-tax cash flow
- $71/yr
For passive investors: Depreciation is non-cash, so a rental often shows a tax loss while cash-flowing — sheltering income. Rental losses are passive: they offset passive income freely, and up to $25,000/yr can offset ordinary (W-2) income if you actively participate and your MAGI is under $100k (phasing out to $0 by $150k); unused losses carry forward. On sale, claimed depreciation is recaptured at up to 25%, and gains may owe capital-gains tax (a 1031 exchange can defer both). Figures are a year-1 estimate at your 24.0% rate — not tax advice; consult a CPA.
Schools (NCES district)
- District
- Harrison County School District
- NCES district ID
- 2801770
- Math proficiency
- 52% ▼ -4.00%
- Reading proficiency
- 46% ▼ -4.00%
- Median HH income
- $46,504
- Composite
- 41.66/100
- National rank
- #3419
- State rank
- #14 of 130 in MS
Livability — Gulfport
- Score
- 73/100
- State rank
- #15
- US rank
- #5010
Category grades
Schools grade is shown separately in the Schools card above.
Census & demographics
- County
- Harrison County · 178,171 people
- City population
- 96,188
- Metro
- Gulfport-Biloxi, MS
- Population (ZIP)
- 55,059
- Household income
- $62,641
- Rent vs Own
- Severe rent burden
- 1686.0
Population outlook (Harrison County) Hauer SSP2
- Today (2025)
- 228,444 people
- By 2030
- 241,942 · +5.9%
- By 2040
- 267,531 · +17.1%
- By 2050
- 291,062 · +27.4%
- By 2075
- 346,711 · +51.8%
- By 2100
- 378,165 · +65.5%
Race, ethnicity, and origin ACS 2023
- Neighborhood character
- Diverse neighborhood (Simpson 0.58)
- Race & ethnicity
- White 58% Black 27% Two or more races 9% Hispanic / Latino 6% Asian 2%
- Hispanic origin (detail)
- Mexican 2% Puerto Rican 1%
- Common ancestry
- Lithuanian 5% Slovak 1% Portuguese 1%
- Foreign-born
- 3% · Canada
- Languages at home
- 95% English-only · Spanish 3%
Political lean MEDSL · Harrison
- 2024 margin
- Strong R (+28.9) · D 35.0% · R 63.9% · Other 1.1%
- 2008→2024 swing
- -2.9pp toward R · 2008: -26.0pp · 2024: -28.9pp
- All cycles
- 2024: R+28.9 2020: R+25.2 2016: R+30.7 2012: R+26.6 2008: R+26.0
Not yet ingested
- Civics
- —
Market trends
- HPI YoY
- ▼ -51.39%
- Current HPI
- 187.285
- Rent YoY
- ▲ 6.99%
- Metro
- Gulfport-Biloxi, MS
- State GDP YoY
- —
- F500 in state
- 0
Price history
+51.0% since first listed8 events — show timeline
- 2026-06-06 Listed $332,000 MLSU
- 2021-11-03 Sold (Public Records) — Public Records
- 2021-10-18 Sold (Public Records) — Public Records
- 2021-09-30 Sold (MLS) — MLSU
- 2021-07-07 Listed $275,000 MLSU
- 2019-07-26 Sold (Public Records) $217,900 Public Records
- 2019-07-25 Sold (MLS) — MLSU
- 2019-03-29 Listed $219,900 MLSU
Property tax history
+38.2%/yrLatest (2025): $1,905 · +8.4% YoY. Source: county tax records.
Cash-flow waterfall
monthlySold comps — $/sqft
last 12 mo · ≤1 miLoading sold comps…