488 Prairie · Cathedral City, CA
Flood risk 1/10 · Minimal
- FEMA flood zone
- X
- Chance of flooding over 30 yrs
- 0.0%
- Est. flood insurance / yr
- $507 – $1,088
Fire risk 4/10 · Minor
- Est. fire insurance / yr
- $659 – $1,223
Heat risk 9/10 · Severe
- Hot days now (above 113°F)
- 7 days/yr
- Hot days in 30 yrs
- 20 days/yr
Wind risk 1/10 · Minimal
- Chance of severe wind over 30 yrs
- —
Air-quality risk 5/10 · Moderate
- Unhealthy air days now
- 6 days/yr
- Unhealthy air days in 30 yrs
- 8 days/yr
Risk factors via First Street. Map © Google.
Why this score? — see what drove the B- grade
The composite is a weighted blend of 9 inputs, each scored 0–100. Each bar is that input's sub-score; the figure is the points it added to the 100-point composite (weight × sub-score).
- Cash flow +30.0/30.0
- 1% rule +10.0/10.0
- DSCR +10.0/10.0
- ARV discount +7.5/15.0
- Rent growth +3.3/5.0
- Livability +3.3/5.0
- Schools +2.7/10.0
- Condition / age +2.5/5.0
- Appreciation +0.0/10.0
$139,900
🖨 Deal sheet 📄 Offer letter ✓ Due diligence
Listing remarks
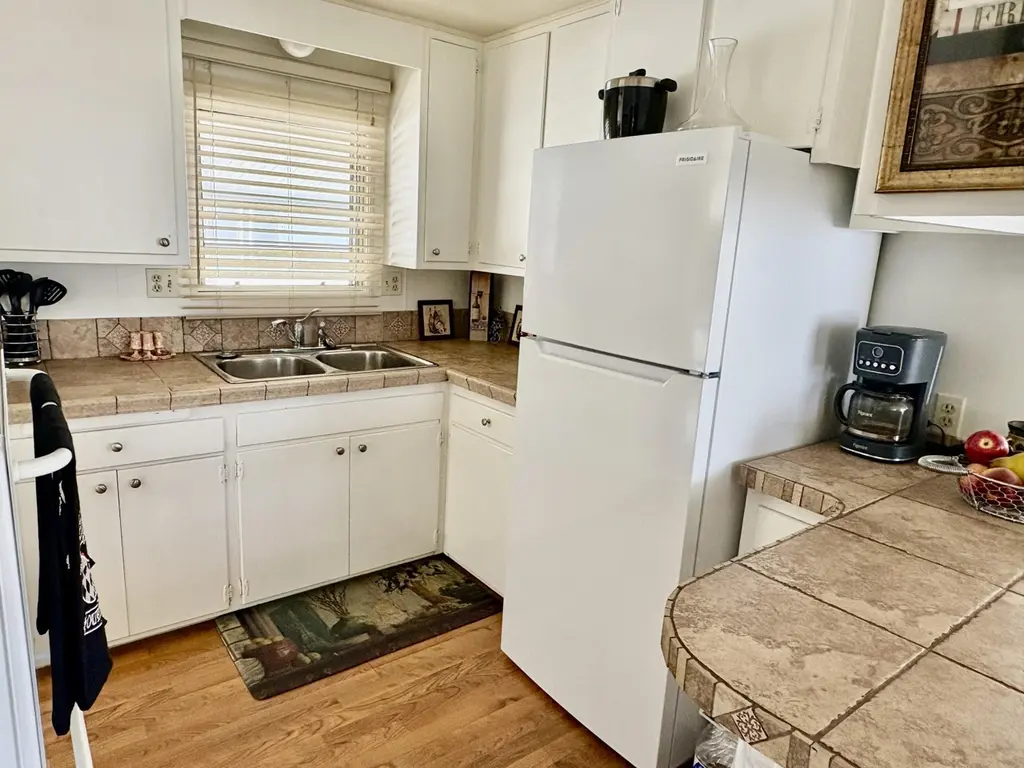
Welcome to Royal Palms--where comfort, convenience, and easy desert living come together in this 55+ gated community. This fully furnished, turnkey home sits on a spacious oversized lot and features a large deck perfect for relaxing and enjoying beautiful mountain views. RV parking is also available for added flexibility. Inside, you'll find thoughtful upgrades throughout, including a remodeled kitchen with updated countertops and refreshed bathrooms. The home is equipped for year-round comfort with a new central air conditioner, an Eco air unit in the living room, and a Sam's Club evaporative cooler for added efficiency. Additional highlights include a new refrigerator, front-load washer a
Key facts
- Gated community
- Large deck
- Rv parking
Tags
Property features AI
Finance
- Other: Park manager approval required; Park manager contact available
- Financial info: Land is lease; annual land lease amount listed; Rental restrictions apply; Listing terms: Cash or cash to new loan
- HOA & community: No monthly association fee; Senior community; Community features include dog park and pickleball courts; Gated community
Exterior
- Parking: Attached carport; 2 total parking spaces; 2 carport spaces
- Security: Gated community with card/code access
- Utilities: Mutual water source; Septic tank
- Home design: Single-level (one story); Double-wide mobile home; Entry facing other
- Construction: Built in 1965 (manufacture date); Mobile/manufactured construction; Double wide (20 ft x 50 ft)
- Exterior features: Detached property; Mountain view; Community pool (in-ground); Community spa (in-ground); Gated community; Card/Code access; Community access; Senior park (Royal Palms)
Interior
- Kitchen: Wall oven; Gas cooktop; Refrigerator; Microwave oven; Ceramic counters
- Flooring: Ceramic tile; Mixed flooring
- Bathrooms: 2 full bathrooms
- Heating & cooling: Forced air heating; Central air; Evaporative cooling; Ceiling fans
- Interior features: Furnished; Dining room; Living room; Covered patio
- Laundry & utility: Washer; Dryer; Laundry area
Neighborhood map
What this means for you Summary
Snapshot
- This is a 2-bed/2.0-bath manufactured listed at $140k.
Deal economics
- At list price, monthly cash flow is $1k ($12k/yr) — positive.
- The deal already cash-flows at list — no discount required.
- Meets the 1% rule at list price ($3k rent vs $140k).
- Recommended offer: $136k (3.0% below list) — sets the bar for market timing.
- Cap rate 15.1% vs local median 5.1% in Cathedral City — top-decile yield for the area; either an underpriced asset or a hidden risk that comps aren't pricing in. Stress-test before assuming the spread holds.
Location & tenants
- Location reads 66/100 on livability (#344 in CA) — a middle-class / working-renter tenant base. Strengths: commute A+, housing B+; Watch: employment D+, schools F, amenities D-.
- Palm Springs Unified (suburban): math 21% / reading 42% proficiency, ranked #328 of 517 in CA (top 63%) — families likely to look elsewhere, expect single-tenant / working-renter base with shorter leases; 73% free/reduced lunch — lower-income household profile, screen leases tightly.
- Market conditions: Rents rising (+3.2%/yr); 525 active listings in the ZIP; 40 comparable units currently listed for rent nearby; rentals at typical pace (median 25d on market — plan ~3-4 weeks tenant-placement turnaround); 45% of comp listings sitting > 30 days — soft ceiling on asking rent; 9,195 units permitted in Riverside County in 2024 (1,512 in 5+ unit buildings).
- This rent runs 41% of the median local income ($74k/yr) — at the standard rent-burdened threshold; future hikes will face affordability resistance.
Forward outlook
- Local home prices are declining (-3.0%/yr); year-one equity from $967 of loan paydown is wiped out by about $4k of value loss. Plan a longer hold.
- Riverside County population projected at +22% by 2050 — long-run rental-demand tailwind backs the buy-and-hold thesis.
- At projected returns (-3.0% appreciation + 3.2% rent growth), your $39k cash investment doubles in ~4 years — after that, you're playing with house money.
Negotiation context
- It's been on market 47 days — a 3% lower offer ($136k) is reasonable based on typical stale-listing flexibility.
Risks & watch-outs
- Climate carrying-cost: extreme-heat days projected 7→20/yr by 2055 (HVAC capex compounding) — expect insurance premiums to compound above CPI over the hold.
Questions for the listing agent
- It's been on market 47 days. Have you received any prior offers? Is the seller open to a 3% concession, seller financing, or rate buy-down credit?
- Built in 1965 — when were the roof, HVAC, electrical panel, plumbing, and water heater last replaced?
- Is there a deadline driving the sale (1031 exchange, divorce, estate, relocation)? That informs how much negotiation room exists.
- Schools are F-rated, which usually means shorter tenancies and higher turnover. Who's the typical renter profile here, and what's been the actual vacancy rate?
- What's the average days-on-market for RENTAL listings here right now (not sales)? A rising rental-DOM trend means longer vacancies and softer asking-rent achievability than the comps imply.
- What's the recent tenant-quality profile in this submarket — average credit score on applications, eviction rate, late-payment / NSF rate, and stable-employment percentage? A property-management company in the area should have these aggregated.
- How much new for-sale + rental construction is in the pipeline within 1–3 miles? Heavy new supply typically softens prices + rents 12–24 months out; constrained supply supports both.
Investment metrics
- 1% rule
- 1.80% ✓
- Cap rate
- 15.09%
- Cash-on-cash
- 31.41%
- DSCR
- 2.40
- GRM
- 4.6
CMA / ARV
- ARV (median comp)
- $75,962
- List price
- $139,900
- Delta
- 84.17%
- Verdict
- OVERPRICED
- Comps
- 20 within 1.0 mi
Show comp detail 12 sales within ~0.75 mi
| Address | Dist | Beds/Ba | Sqft | Sold | Price | $/sf | Match |
|---|---|---|---|---|---|---|---|
| 438 Butterfield | 0.04mi | 2/2.0 | 1,000 (0%) | 1mo | $56,000 | $56 | 97 |
| 454 Little Deer | 0.09mi | 2/1.0 | 960 (-4%) | 2mo | $56,000 | $58 | 84 |
| 34 Coble Dr | 0.10mi | 2/2.0 | 1,056 (+6%) | 8mo | $119,000 | $113 | 79 |
| 94 Armenia Dr | 0.17mi | 2/2.0 | 1,056 (+6%) | 10mo | $79,000 | $75 | 74 |
| 162 Coyote | 0.19mi | 2/1.5 | 960 (-4%) | 11mo | $41,000 | $43 | 73 |
| 3 Sand Crk | 0.26mi | 1/1.0 (-1) | 1,040 (+4%) | 5mo | $73,000 | $70 | 68 |
| 13 Oasis Dr N | 0.34mi | 2/2.0 | 1,056 (+6%) | 12mo | $159,900 | $151 | 64 |
| 174 Coyote | 0.24mi | 2/2.0 | 880 (-12%) | 6mo | $70,000 | $80 | 64 |
| 7 Sand Crk | 0.15mi | 2/2.0 | 1,135 (+14%) | 8mo | $115,000 | $101 | 64 |
| 110 Coyote | 0.20mi | 2/2.0 | 880 (-12%) | 10mo | $85,000 | $97 | 62 |
| 318 Little Deer | 0.27mi | 2/2.0 | 1,100 (+10%) | 10mo | $66,000 | $60 | 62 |
| 213 Settles Dr | 0.36mi | 2/2.0 | 1,140 (+14%) | 7mo | $145,000 | $127 | 54 |
Match score weights: distance 35% · size 25% · config 20% · recency 20%. Top-matched comps best support the ARV.
Projected returns pro-forma
-3.0% appreciation · 3.22% rent growth · sell at horizon
- IRR
- 26.5%
- Equity multiple
- 2.10×
- Total profit
- $43,238
- Equity at exit
- $20,860
- IRR
- 34.3%
- Equity multiple
- 4.17×
- Total profit
- $124,209
- Equity at exit
- $12,096
Cash invested: $39,172 (down + closing). Projections, not guarantees.
Landlord ↔ Tenant lean methodology
- Overall (STATE)
- 18 Strongly Tenant-Friendly
- State California
- 18 Strongly Tenant-Friendly · D+13
- County
- — inherits STATE
- City
- — inherits STATE
ZIP-level market 92234
- Home prices YoY
- -27.7%
- Rents YoY
- 3.2%
- Active inventory
- 525
- Price-to-rent
- 4.6×
Monthly cashflow live
- Estimated rent
- $2,522 high interval (Pro) →
- Mortgage (P&I)
- −$734
- Tax est. 1.5%
- −$175 /mo · $2,098/yr
- Insurance
- −$58
- HOA
- −$0
- Vacancy / Maint / Mgmt
- −$530
- Net cashflow
- $1,025
Break-even live
UW: 25.0% down · 7.5% · 30yr · 1.5% tax · 5.0% vac · 8.0% maint · 8.0% mgmt
Financing live
Cash to close
- Down payment
- $34,975
- Closing costs
- $4,197
- Reserves months
- —
- Total cash needed
- —
Loan-product check · same deal, 3 products live
Conventional
25% down · 7.5% · 30yr
- Down + closing
- —
- Monthly P&I
- —
- Monthly cashflow
- —
- DSCR
- —
- Eligible?
- —
Personal DTI + credit; lowest rate.
DSCR
20% down · 8.5% · 30yr
- Down + closing
- —
- Monthly P&I
- —
- Monthly cashflow
- —
- DSCR
- —
- Eligible?
- —
No personal income docs; deal must DSCR.
Hard money
10% down · 12.0% · 12mo
- Down + closing
- —
- Monthly P&I
- —
- Monthly cashflow
- —
- DSCR
- —
- Eligible?
- —
Short-term bridge; refi at stabilization.
Rent comps 40 comps
| Address | Beds | Baths | Sqft | Rent | $/sqft | DOM | Units | Dist |
|---|---|---|---|---|---|---|---|---|
| 68615 Paseo Soria Cathedral City, CA | 2.0 | 2.0 | 1462 | $3,500 | $2.39 | 8d | 1 | 0.27mi |
| 69180 Victoria Dr #8 Cathedral City, CA | 3.0 | 2.0 | 1230 | $1,995 | $1.62 | 3d | 1 | 0.29mi |
| 69155 Dinah Shore Dr Apt 20 Cathedral City, CA | 2.0 | 2.0 | 1200 | $2,050 | $1.71 | 44d | 1 | 0.33mi |
| 69155 Dinah Shore Dr Cathedral City, CA | 2.0 | 2.0 | 1100 | $1,795 | $1.63 | 44d | 1 | 0.34mi |
| 34750 Marcia Rd Unit 02 Cathedral City, CA | 3.0 | 2.0 | 1325 | $2,000 | $1.51 | 18d | 1 | 0.35mi |
| 34197 Calle Mora Cathedral City, CA | 2.0 | 2.0 | 1171 | $2,300 | $1.96 | 22d | 1 | 0.42mi |
| 34197 Calle Mora Cathedral City, CA | 2.0 | 2.0 | 1171 | $2,300 | $1.96 | 13d | 1 | 0.42mi |
| 34197 Calle Mora Cathedral City, CA | 2.0 | 2.0 | 1171 | $2,300 | $1.96 | 10d | 1 | 0.42mi |
| 68859 Paseo Real Cathedral City, CA | 2.0 | 2.0 | 1406 | $3,960 | $2.82 | 15d | 1 | 0.43mi |
| 68859 Paseo Real Cathedral City, CA | 2.0 | 2.0 | 1406 | $3,960 | $2.82 | 44d | 1 | 0.43mi |
| 69200 Nilda Dr Cathedral City, CA | 3.0 | 2.0 | 1330 | $2,495 | $1.88 | 22d | 1 | 0.47mi |
| 68153 Lakeland Dr Cathedral City, CA | 2.0 | 2.0 | 1255 | $2,500 | $1.99 | 24d | 1 | 0.50mi |
| 35200 Cathedral Canyon Dr Unit H64 Cathedral City, CA | 2.0 | 2.0 | 1375 | $2,500 | $1.82 | 44d | 1 | 0.52mi |
| 68368 Calle Leon Cathedral City, CA | 2.0 | 2.0 | 1406 | $3,790 | $2.70 | 15d | 1 | 0.53mi |
| 68368 Calle Leon Cathedral City, CA | 2.0 | 2.0 | 1406 | $3,790 | $2.70 | 44d | 1 | 0.53mi |
| 35200 Cathedral Canyon Dr Unit B10 Cathedral City, CA | 2.0 | 2.0 | 1384 | $2,600 | $1.88 | 44d | 1 | 0.53mi |
| 33255 Date Palm Dr Cathedral City, CA | 2.0 | 2.0 | 1050 | $1,795 | $1.71 | 44d | 1 | 0.56mi |
| 35615 Paseo Circulo E Cathedral City, CA | 1.0 | 2.0 | 1029 | $2,250 | $2.19 | 44d | 1 | 0.61mi |
| 33892 Sky Blue Water Trl Cathedral City, CA | 3.0 | 2.0 | 1352 | $2,800 | $2.07 | 4d | 1 | 0.63mi |
| 33495 Cathedral Canyon Dr Unit B Cathedral City, CA | 2.0 | 1.0 | 1100 | $2,100 | $1.91 | 44d | 1 | 0.64mi |
| 33495 Cathedral Canyon Dr Cathedral City, CA | 2.0 | 1.0 | 1100 | $2,200 | $2.00 | 44d | 1 | 0.64mi |
| 69603 Heather Way Rancho Mirage, CA | 3.0 | 2.0 | 1218 | $2,300 | $1.89 | 44d | 1 | 0.72mi |
| 34073 Emily Way Rancho Mirage, CA | 2.0 | 2.0 | 966 | $2,100 | $2.17 | 18d | 1 | 0.75mi |
| 34073 Emily Way Rancho Mirage, CA | 2.0 | 2.0 | 966 | $2,100 | $2.17 | 22d | 1 | 0.75mi |
| 69646 Antonia Way Rancho Mirage, CA | 2.0 | 2.0 | 966 | $2,450 | $2.54 | 18d | 1 | 0.76mi |
| 34361 Denise Way Rancho Mirage, CA | 3.0 | 2.0 | 1400 | $2,800 | $2.00 | 44d | 1 | 0.77mi |
| 34071 Denise Way Rancho Mirage, CA | 3.0 | 2.0 | 1218 | $2,599 | $2.13 | 24d | 1 | 0.79mi |
| 33387 Shifting Sands Trl Unit 2 Cathedral City, CA | 2.0 | 2.0 | 1300 | $1,999 | $1.54 | 24d | 1 | 0.91mi |
| 152 Estrada Way #152 Cathedral City, CA | 2.0 | 2.0 | 1500 | $2,200 | $1.47 | 44d | 1 | 0.94mi |
| 32585 Cielo Vista Rd Cathedral City, CA | 2.0 | 2.0 | 840 | $2,000 | $2.38 | 24d | 1 | 0.94mi |
| 36040 Avenida de las Montanas Unit E Cathedral City, CA | 2.0 | 2.0 | 1220 | $3,200 | $2.62 | 44d | 1 | 0.98mi |
| 33030 Shifting Sands Trl Apt 4 Cathedral City, CA | 2.0 | 1.0 | 821 | $1,599 | $1.95 | 24d | 1 | 1.00mi |
| 32425 Rancho Vista Dr Unit A Cathedral City, CA | 2.0 | 1.0 | 754 | $1,950 | $2.59 | 8d | 1 | 1.02mi |
| 32150 Aurora Vista Rd Cathedral City, CA | 2.0 | 1.0 | 1100 | $2,195 | $2.00 | 44d | 1 | 1.18mi |
| 32150 Aurora Vista Rd Unit C Cathedral City, CA | 2.0 | 1.0 | 1100 | $2,395 | $2.18 | 44d | 1 | 1.18mi |
| 32200 Cathedral Canyon Dr #31 Cathedral City, CA | 1.0 | 1.0 | 740 | $1,550 | $2.09 | 24d | 1 | 1.20mi |
| 2010 Lawrence Crossley Rd Unit 8 Palm Springs, CA | 2.0 | 1.5 | 993 | $1,895 | $1.91 | 14d | 1 | 1.22mi |
| 26 Pueblo Vista Dr Palm Springs, CA | 3.0 | 2.0 | 1487 | $3,200 | $2.15 | 44d | 1 | 1.25mi |
| 6071 Hazeltine Plz Palm Springs, CA | 2.0 | 2.0 | 1168 | $3,200 | $2.74 | 44d | 1 | 1.27mi |
| 36947 Melrose Dr Unit 4 Cathedral City, CA | 1.0 | 1.0 | 700 | $1,595 | $2.28 | 3d | 1 | 1.38mi |
Listing history 15 events
-
2026-06-18days on market $139,900 Active 47 DOM
-
2026-06-17days on market $139,900 Active 46 DOM
-
2026-06-16days on market $139,900 Active 45 DOM
-
2026-06-15days on market $139,900 Active 44 DOM
-
2026-06-13days on market $139,900 Active 42 DOM
-
2026-06-13days on market $139,900 Active 41 DOM
-
2026-06-09days on market $139,900 Active 38 DOM
-
2026-06-08days on market $139,900 Active 37 DOM
-
2026-06-07pricedays on market $139,900 Active 36 DOM
-
2026-06-04days on market $149,900 Active 33 DOM
-
2026-06-03days on market $149,900 Active 32 DOM
-
2026-06-02days on market $149,900 Active 31 DOM
-
2026-06-01days on market $149,900 Active 30 DOM
-
2026-05-31days on market $149,900 Active 29 DOM
-
2026-04-29$149,900 Active 962-char remark
ⓘ Source: listings_history table (triggers on properties + properties_extension) + one-shot
backfill from property_details.listing_events for pre-trigger history.
Climate risk First Street
- Flood 1/10 Low FEMA zone X · 0% chance over 30 yrs
- Wildfire 4/10 Moderate
- Heat 9/10 Extreme 7 d/yr ≥113°F today · 20 d/yr by 30 yrs out
- Wind 1/10 Low
- Air quality 5/10 Major 6 unhealthy d/yr today · 8 by 30 yrs out
Nearby sold comps map
Loading sold comps map…
Walkable amenities ~0.75 mi
Loading nearby amenities…
Taxation est. · year 1
- Rental income
- $30,262
- − Mortgage interest
- −$7,837
- − Property taxes
- −$2,098
- − Insurance
- −$700
- − Repairs & maintenance
- −$2,421
- − Management
- −$2,421
- − Depreciation
- −$4,070
- Taxable income
- $10,716
- Est. tax owed @ 24.0%
- −$2,572
- After-tax cash flow
- $9,733/yr
For passive investors: Depreciation is non-cash, so a rental often shows a tax loss while cash-flowing — sheltering income. Rental losses are passive: they offset passive income freely, and up to $25,000/yr can offset ordinary (W-2) income if you actively participate and your MAGI is under $100k (phasing out to $0 by $150k); unused losses carry forward. On sale, claimed depreciation is recaptured at up to 25%, and gains may owe capital-gains tax (a 1031 exchange can defer both). Figures are a year-1 estimate at your 24.0% rate — not tax advice; consult a CPA.
Schools (NCES district)
- District
- Palm Springs Unified
- NCES district ID
- 0629550
- Math proficiency
- 21% ▼ -7.00%
- Reading proficiency
- 42% ▬ 0.00%
- Median HH income
- $43,638
- Composite
- 26.76/100
- National rank
- #7131
- State rank
- #328 of 517 in CA
Livability — Cathedral City
- Score
- 66/100
- State rank
- #344
- US rank
- #11749
Category grades
Schools grade is shown separately in the Schools card above.
Census & demographics
- Census place
- Cathedral City, CA
- County
- Riverside County · 2,287,001 people
- City population
- 52,267
- Metro
- Riverside-San Bernardino-Ontario, CA
- Population (ZIP)
- 52,267
- Household income
- $73,572
- Rent vs Own
- Severe rent burden
- 1682.0
Population outlook (Riverside County) Hauer SSP2
- Today (2025)
- 2,664,475 people
- By 2030
- 2,802,692 · +5.2%
- By 2040
- 3,050,904 · +14.5%
- By 2050
- 3,256,783 · +22.2%
- By 2075
- 3,655,058 · +37.2%
- By 2100
- 3,766,594 · +41.4%
Race, ethnicity, and origin ACS 2023
- Neighborhood character
- Diverse neighborhood (Simpson 0.56)
- Race & ethnicity
- Hispanic / Latino 59% White 30% Two or more races 27% Asian 6% Native American 2% Black 2%
- Hispanic origin (detail)
- Mexican 51%
- Common ancestry
- Lithuanian 2% Romanian 1% Italian 1%
- Foreign-born
- 28% · Canada, Vietnam
- Languages at home
- 48% English-only · Spanish 46% Tagalog/Filipino 3% Other Asian/Pacific 1%
Political lean MEDSL · Riverside
- 2024 margin
- Toss-up / Even · D 48.0% · R 49.3% · Other 2.6%
- 2008→2024 swing
- -3.6pp toward R · 2008: 2.3pp · 2024: -1.3pp
- All cycles
- 2024: R+1.3 2020: D+8.0 2016: D+4.3 2012: R+0.4 2008: D+2.3
Not yet ingested
- Civics
- —
Market trends
- HPI YoY
- ▼ -136.57%
- Current HPI
- 356.9845
- Rent YoY
- ▲ 3.22%
- Metro
- Riverside-San Bernardino-Ontario, CA
- State GDP YoY
- ▲ 3.21%
- F500 in state
- 116
Industry mix (Fortune 500 HQ in CA)
| Industry | F500 HQs | Revenue |
|---|---|---|
| Technology | 27 | $1,492B |
|
||
| Financial Services | 3 | $174B |
|
||
| Retail | 3 | $44B |
|
||
| Insurance | 3 | $26B |
|
||
| Media / Entertainment | 2 | $115B |
|
||
| Pharmaceuticals / Biotech | 2 | $62B |
|
||
Price history
-6.7% since first listed2 events — show timeline
- 2026-06-05 Price Changed $139,900 GPSMLS
- 2026-04-29 Listed $149,900 GPSMLS
Property tax history
+1.0%/yrLatest (2025): $219 · -2.1% YoY. Source: county tax records.
Cash-flow waterfall
monthlySold comps — $/sqft
last 12 mo · ≤1 miLoading sold comps…