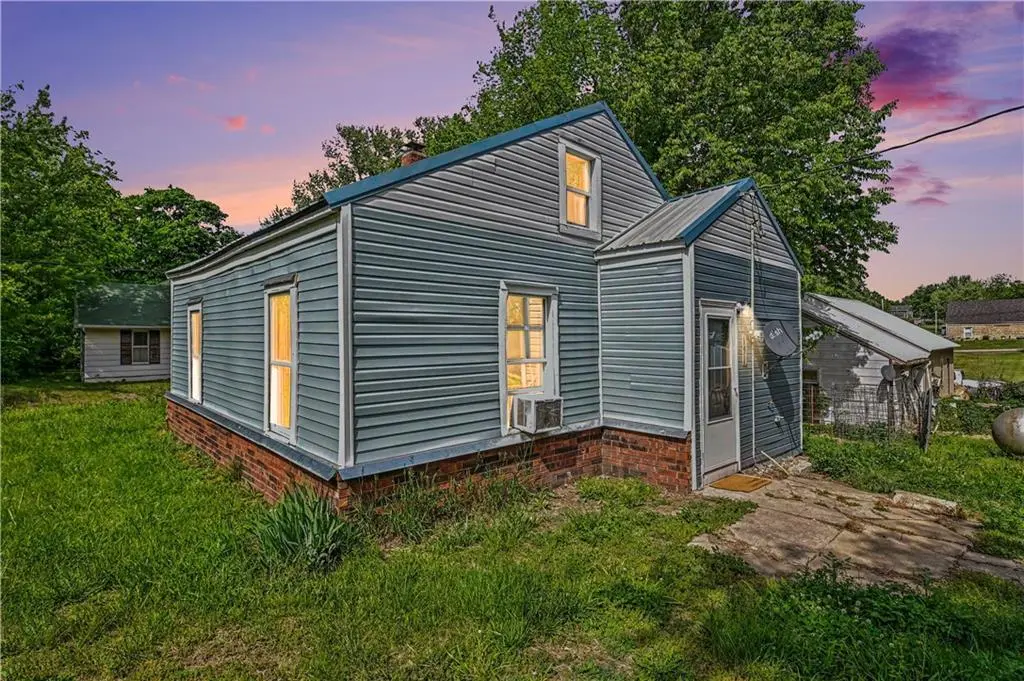
191 N Burns St · Fillmore, MO
Flood risk 1/10 · Minimal
- FEMA flood zone
- X (unshaded)
- Chance of flooding over 30 yrs
- 0.0%
- Est. flood insurance / yr
- $507 – $1,088
Fire risk 1/10 · Minimal
- Est. fire insurance / yr
- $1,054 – $1,958
Heat risk 3/10 · Minor
- Hot days now (above 107°F)
- 7 days/yr
- Hot days in 30 yrs
- 16 days/yr
Wind risk 2/10 · Minimal
- Chance of severe wind over 30 yrs
- —
Air-quality risk 1/10 · Minimal
- Unhealthy air days now
- 0 days/yr
- Unhealthy air days in 30 yrs
- 0 days/yr
Risk factors via First Street. Map © Google.
Why this score? — see what drove the B- grade
The composite is a weighted blend of 9 inputs, each scored 0–100. Each bar is that input's sub-score; the figure is the points it added to the 100-point composite (weight × sub-score).
- Cash flow +24.7/30.0
- Appreciation +8.6/10.0
- DSCR +8.0/10.0
- ARV discount +7.5/15.0
- 1% rule +5.1/10.0
- Schools +3.9/10.0
- Livability +2.7/5.0
- Rent growth +2.5/5.0
- Condition / age +2.5/5.0
$80,000
🖨 Deal sheet (PDF) 📄 Offer letter ✓ Due diligence
Listing remarks
Turnkey Investment or Starter Home – Fully Renovated & Move-In Ready Whether used as a rental property or primary residence, this fully renovated home offers a low-maintenance option with updated finishes throughout. Previously rented at approximately $800/month (if applicable and verifiable), the property offers potential for rental income or owner occupancy at an affordable price point. Key Features Fully renovated with updates throughout Bonus storage space in attic and outdoor shed Fenced outdoor area with dog pen Located in a residential community This property offers flexibility for both investors and owner-occupants. Contact us today to schedule a showing.
Key facts
- 8,712 sq ft lot
- Built 1942
- Listed 39 days
Property features AI
Finance
- Financial info: Tax annual amount: $246.80
Exterior
- Parking: Off-street parking
- Utilities: Public water; Public sewer
- Home design: Single family residence; Residential property; 620 above-grade living area (source: plans)
- Construction: Frame construction; Metal roof; Estimated age: 76-100 years
- Exterior features: Lot approximately 8,712 square feet; Flood plain status: unknown
Interior
- Bedrooms: 1 bedroom
- Bathrooms: 1 full bathroom
- Heating & cooling: Propane heating; Window air conditioning unit(s)
- Interior features: Kit/dining combo; Loft; Ranch floor plan
- Laundry & utility: Laundry on the main level
Neighborhood map
What this means for you Summary
Snapshot
- This is a 2-bed/1.0-bath single-family listed at $80k.
Deal economics
- At list price, monthly cash flow is $167 ($2k/yr) — positive.
- The deal already cash-flows at list — no discount required.
- Meets the 1% rule at list price ($811 rent vs $80k).
- Recommended offer: $78k (3.0% below list) — sets the bar for market timing.
Location & tenants
- Location reads 54/100 on livability (#805 in MO) — a working-class tenant base; expect higher turnover. Strengths: cost of living A+, housing A+; Watch: crime F, amenities F, commute F.
- North Andrew County R-VI (rural): math 35% / reading 50% proficiency, ranked #236 of 535 in MO (top 44%) — families likely to look elsewhere, expect single-tenant / working-renter base with shorter leases.
- Zoned schools: North Andrew Elem. (math 67% / reading 57%, grade B, #98 of 1,115 statewide, top 10%, 115 students, 29% FRL); North Andrew Middle (math 27% / reading 42%, grade F, #243 of 391 statewide, top 65%, 72 students, 29% FRL); North Andrew High (math 44% / reading 34%, grade F, #247 of 521 statewide, top 55%, 113 students, 24% FRL) — zoned schools at 27% FRL track the district average.
- Market conditions: 2 active listings in the ZIP; 4 units permitted in Andrew County in 2024 (0 in 5+ unit buildings).
Forward outlook
- In year one you build about $6k of equity ($553 loan paydown + $6k appreciation (7.3% local appreciation)).
- Andrew County population projected to shrink 6% by 2050 — rents likely to lag national; underwrite the cash flow, not the appreciation.
- At projected returns (7.3% appreciation + 3.0% rent growth), your $22k cash investment doubles in ~3 years — after that, you're playing with house money.
- By year 6, paydown + projected appreciation supports a ~$35k cash-out refi (75% LTV) — recoverable capital for the next deal without selling this one.
Negotiation context
- It's been on market 40 days — a 3% lower offer ($78k) is reasonable based on typical stale-listing flexibility.
Risks & watch-outs
- Watch-outs: built in 1942 — expect roof / HVAC / electrical / plumbing capex.
Questions for the listing agent
- It's been on market 40 days. Have you received any prior offers? Is the seller open to a 3% concession, seller financing, or rate buy-down credit?
- Built in 1942 — when were the roof, HVAC, electrical panel, plumbing, and water heater last replaced?
- Is there a deadline driving the sale (1031 exchange, divorce, estate, relocation)? That informs how much negotiation room exists.
- Schools are F-rated, which usually means shorter tenancies and higher turnover. Who's the typical renter profile here, and what's been the actual vacancy rate?
- Crime grade is F in this area — have there been break-ins, vandalism, or insurance claims at this property in the last 3 years? What carrier currently insures it and at what premium?
- What's the average days-on-market for RENTAL listings here right now (not sales)? A rising rental-DOM trend means longer vacancies and softer asking-rent achievability than the comps imply.
- What's the recent tenant-quality profile in this submarket — average credit score on applications, eviction rate, late-payment / NSF rate, and stable-employment percentage? A property-management company in the area should have these aggregated.
- How much new for-sale + rental construction is in the pipeline within 1–3 miles? Heavy new supply typically softens prices + rents 12–24 months out; constrained supply supports both.
Investment metrics
- 1% rule
- 1.01% ✓
- Cap rate
- 8.80%
- Cash-on-cash
- 8.96%
- DSCR
- 1.40
- GRM
- 8.2
CMA / ARV
No comps found within radius.
Projected returns pro-forma
7.26% appreciation · 3.0% rent growth · sell at horizon
- IRR
- 25.4%
- Equity multiple
- 2.78×
- Total profit
- $39,840
- Equity at exit
- $56,809
- IRR
- 23.2%
- Equity multiple
- 5.81×
- Total profit
- $107,647
- Equity at exit
- $109,178
Cash invested: $22,400 (down + closing). Projections, not guarantees.
Landlord ↔ Tenant lean methodology
- Overall (STATE)
- 81 Strongly Landlord-Friendly
- State Missouri
- 81 Strongly Landlord-Friendly · R+10
- County
- — inherits STATE
- City
- — inherits STATE
ZIP-level market 64449
- Home prices YoY
- 2.7%
- Active inventory
- 2
- Price-to-rent
- 8.2×
Monthly cashflow live
- Estimated rent
- $811 medium interval (Pro) →
- Mortgage (P&I)
- −$420
- Tax from tax record
- −$21 /mo · $247/yr
- Insurance
- −$33
- HOA
- −$0
- Vacancy / Maint / Mgmt
- −$170
- Net cashflow
- $167
Break-even live
Sensitivity live
| Price | -10% $213 | -5% $190 | +0% $167 | +5% $145 | +10% $122 |
|---|---|---|---|---|---|
| Rent | -10% $103 | -5% $135 | +0% $167 | +5% $199 | +10% $231 |
| Rate | -1.0pp $208 | -0.5pp $188 | base $167 | +0.5pp $147 | +1.0pp $125 |
UW: 25.0% down · 7.5% · 30yr · 1.5% tax · 5.0% vac · 8.0% maint · 8.0% mgmt
Financing live
Cash to close
- Down payment
- $20,000
- Closing costs
- $2,400
- Reserves months
- —
- Total cash needed
- —
Loan-product check · same deal, 3 products live
Conventional
25% down · 7.5% · 30yr
- Down + closing
- —
- Monthly P&I
- —
- Monthly cashflow
- —
- DSCR
- —
- Eligible?
- —
Personal DTI + credit; lowest rate.
DSCR
20% down · 8.5% · 30yr
- Down + closing
- —
- Monthly P&I
- —
- Monthly cashflow
- —
- DSCR
- —
- Eligible?
- —
No personal income docs; deal must DSCR.
Hard money
10% down · 12.0% · 12mo
- Down + closing
- —
- Monthly P&I
- —
- Monthly cashflow
- —
- DSCR
- —
- Eligible?
- —
Short-term bridge; refi at stabilization.
Listing history 19 events
-
2026-06-22days on market $80,000 Active 40 DOM
-
2026-06-21days on market $80,000 Active 39 DOM
-
2026-06-21days on market $80,000 Active 38 DOM
-
2026-06-18days on market $80,000 Active 36 DOM
-
2026-06-17days on market $80,000 Active 35 DOM
-
2026-06-16days on market $80,000 Active 34 DOM
-
2026-06-15days on market $80,000 Active 33 DOM
-
2026-06-13days on market $80,000 Active 31 DOM
-
2026-06-12days on market $80,000 Active 30 DOM
-
2026-06-09pricedays on market $80,000 Active 27 DOM
-
2026-06-08days on market $85,000 Active 26 DOM
-
2026-06-07days on market $85,000 Active 25 DOM
-
2026-06-05days on market $85,000 Active 23 DOM
-
2026-06-04days on market $85,000 Active 21 DOM
-
2026-06-02days on market $85,000 Active 20 DOM
-
2026-06-01days on market $85,000 Active 19 DOM
-
2026-05-31days on market $85,000 Active 18 DOM
-
2026-05-13$90,000 Active 321-char remark
-
2002-05-01soldstatus
ⓘ Source: listings_history table (triggers on properties + properties_extension) + one-shot
backfill from property_details.listing_events for pre-trigger history.
Tax reassessment forecast MO · Resets to sale price
- Current annual tax
- $247 · $21/mo
- Projected year-2 tax
- $776 · $65/mo
- Expected delta
- +$529/yr (+$44/mo · 214.4%)
ⓘ Screening estimate from a state-policy table — verify with the county assessor before closing.
Climate risk First Street
- Flood 1/10 Low FEMA zone X (unshaded) · 0% chance over 30 yrs
- Wildfire 1/10 Low
- Heat 3/10 Moderate 7 d/yr ≥107°F today · 16 d/yr by 30 yrs out
- Wind 2/10 Low
- Air quality 1/10 Low 0 unhealthy d/yr today · 0 by 30 yrs out
Nearby sold comps map
Loading sold comps map…
Walkable amenities ~0.75 mi
Loading nearby amenities…
Taxation est. · year 1
- Rental income
- $9,732
- − Mortgage interest
- −$4,481
- − Property taxes
- −$247
- − Insurance
- −$400
- − Repairs & maintenance
- −$779
- − Management
- −$779
- − Depreciation
- −$2,327
- Taxable income
- $719
- Est. tax owed @ 24.0%
- −$173
- After-tax cash flow
- $1,834/yr
For passive investors: Depreciation is non-cash, so a rental often shows a tax loss while cash-flowing — sheltering income. Rental losses are passive: they offset passive income freely, and up to $25,000/yr can offset ordinary (W-2) income if you actively participate and your MAGI is under $100k (phasing out to $0 by $150k); unused losses carry forward. On sale, claimed depreciation is recaptured at up to 25%, and gains may owe capital-gains tax (a 1031 exchange can defer both). Figures are a year-1 estimate at your 24.0% rate — not tax advice; consult a CPA.
Schools (NCES district)
- District
- North Andrew County R-VI
- NCES district ID
- 2922710
- Math proficiency
- 35% ▬ 0.00%
- Reading proficiency
- 50% ▲ 10.00%
- Median HH income
- $51,808
- Composite
- 39.03/100
- National rank
- #8279
- State rank
- #236 of 535 in MO
Livability — Fillmore
- Score
- 54/100
- State rank
- #805
- US rank
- #24184
Category grades
Schools grade is shown separately in the Schools card above.
Census & demographics
- Census place
- Fillmore, MO
- Population (ZIP)
- 515
Population outlook (Andrew County) Hauer SSP2
- Today (2025)
- 17,463 people
- By 2030
- 17,412 · -0.3%
- By 2040
- 17,051 · -2.4%
- By 2050
- 16,359 · -6.3%
- By 2075
- 14,483 · -17.1%
- By 2100
- 11,788 · -32.5%
Race, ethnicity, and origin ACS 2023
- Neighborhood character
- Predominantly White (100%)
- Race & ethnicity
- White 100%
- Common ancestry
- Slovak 4% Iranian 2% English 1%
- Foreign-born
- 0%
Political lean MEDSL · Andrew
- 2024 margin
- Solid R (+51.8) · D 23.5% · R 75.2% · Other 1.3%
- 2008→2024 swing
- -29.7pp toward R · 2008: -22.0pp · 2024: -51.8pp
- All cycles
- 2024: R+51.8 2020: R+50.3 2016: R+50.5 2012: R+33.8 2008: R+22.0
Not yet ingested
- Civics
- —
Market trends
- HPI YoY
- ▲ 7.26%
- Current HPI
- 277.7845
- Rent YoY
- —
- Metro
- —
- State GDP YoY
- ▲ 1.84%
- F500 in state
- 20
Industry mix (Fortune 500 HQ in MO)
| Industry | F500 HQs | Revenue |
|---|---|---|
| Healthcare | 1 | $163B |
|
||
| Insurance | 1 | $21B |
|
||
| Industrial Technology | 1 | $17B |
|
||
| Retail | 1 | $16B |
|
||
| Industrial Distribution | 1 | $10B |
|
||
| Utilities | 1 | $9B |
|
||
Price history
-11.1% since first listed4 events — show timeline
- 2026-06-09 Price Changed $80,000 Heartland MLS as Distributed by MLS Grid
- 2026-05-26 Price Changed $85,000 Heartland MLS as Distributed by MLS Grid
- 2026-05-13 Listed $90,000 Heartland MLS as Distributed by MLS Grid
- 2002-05-01 Sold (Public Records) — Public Records
Property tax history
+0.4%/yrLatest (2025): $247 · +7.8% YoY. Source: county tax records.
Cash-flow waterfall
monthlySold comps — $/sqft
last 12 mo · ≤1 miLoading sold comps…