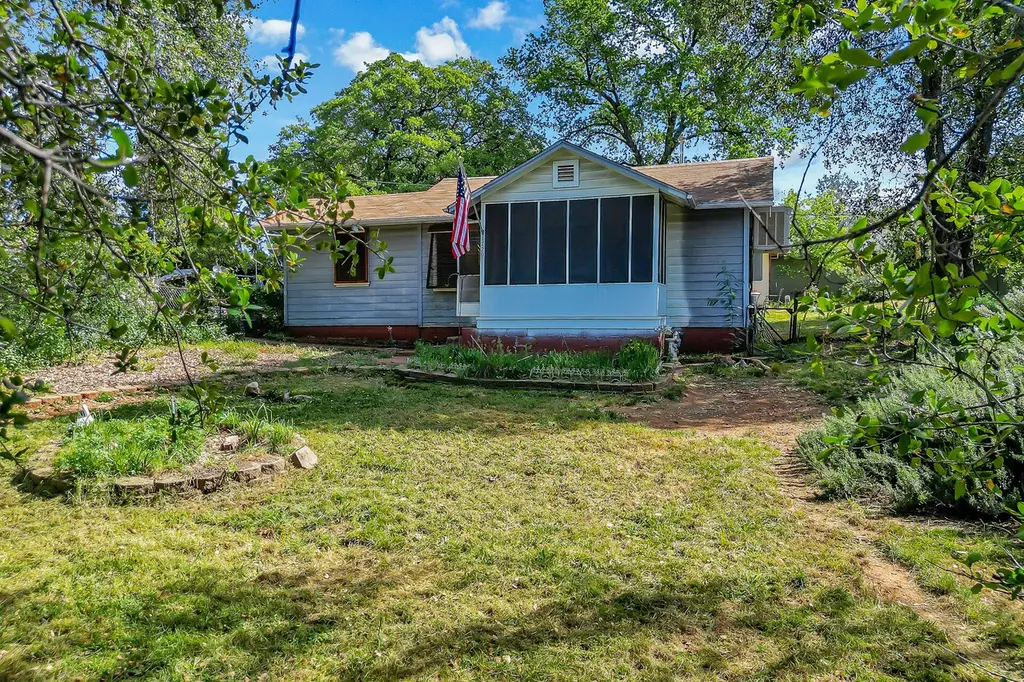
1729 Deer Creek Rd · Shasta Lake, CA
Flood risk 1/10 · Minimal
- FEMA flood zone
- X (unshaded)
- Chance of flooding over 30 yrs
- 0.0%
- Est. flood insurance / yr
- $507 – $1,088
Fire risk 7/10 · Major
- Est. fire insurance / yr
- $659 – $1,223
Heat risk 8/10 · Major
- Hot days now (above 105°F)
- 7 days/yr
- Hot days in 30 yrs
- 17 days/yr
Wind risk 1/10 · Minimal
- Chance of severe wind over 30 yrs
- —
Air-quality risk 10/10 · Severe
- Unhealthy air days now
- 44 days/yr
- Unhealthy air days in 30 yrs
- 46 days/yr
Risk factors via First Street. Map © Google.
Why this score? — see what drove the D grade
The composite is a weighted blend of 9 inputs, each scored 0–100. Each bar is that input's sub-score; the figure is the points it added to the 100-point composite (weight × sub-score).
- ARV discount +15.0/15.0
- Cash flow +10.5/30.0
- Livability +3.2/5.0
- DSCR +3.0/10.0
- Rent growth +2.5/5.0
- Schools +2.5/10.0
- Condition / age +2.5/5.0
- 1% rule +2.4/10.0
- Appreciation +0.0/10.0
$180,000
🖨 Deal sheet 📄 Offer letter ✓ Due diligence
Listing remarks
Opportunity awaits with this charming home with loads of potential! Situated on nearly 1/2 acre in the city! Featuring three legal lots, each approximately 50x100, this property offers exciting potential for expansion, investment, or future development. Inside, the home is ready for your personal touch and includes new plank flooring ready for installation. The spacious bathroom provides plenty of room for updating, while the galley-style kitchen comes equipped with a refrigerator and range. The home offers two bedrooms, including one with a generous walk-in closet, plus a large laundry room complete with washer and dryer. Additional features include a screened front porch, attached carport
Key facts
- Screened front porch
- Attached carport
- Galley-style kitchen
Tags
Property features AI
Exterior
- Parking: Carport (1 space); Off-street parking
- Utilities: Public water; Public sewer
- Home design: Single family residence; One level
- Construction: Wood siding exterior; Composition roof; Block foundation; Built with traditional wood-frame construction
- Exterior features: City lot, level; Asphalt road access; Outbuilding on the property; No pool
Interior
- Kitchen: Refrigerator
- Flooring: Vinyl flooring; Carpet flooring
- Bathrooms: One full bathroom
- Heating & cooling: Wall furnace heating; Evaporative cooling and window unit(s)
- Interior features: Washer and dryer included; Refrigerator included; Vinyl and carpet flooring; No fireplace
- Laundry & utility: Washer and dryer
Neighborhood map
What this means for you Summary
Snapshot
- This is a 2-bed/1.0-bath single-family listed at $180k.
Deal economics
- At list price, monthly cash flow is $-91 ($-1k/yr) — negative.
- To cash-flow at today's rent, offer at most $164k (9.0% below list).
- To meet the 1% rule (rent ≥ 1% of price), the offer needs to be $133k (26.2% below list).
- Recommended offer: $133k (26.2% below list) — sets the bar for 1% rule.
- Cap rate 5.7% vs local median 3.8% in Shasta Lake — top-decile yield for the area; either an underpriced asset or a hidden risk that comps aren't pricing in. Stress-test before assuming the spread holds.
Location & tenants
- Location reads 65/100 on livability (#399 in CA) — a middle-class / working-renter tenant base. Strengths: housing A+, health & safety A+, commute A; Watch: employment C-, schools D-, crime F.
- Gateway Unified (suburban): math 25% / reading 35% proficiency, ranked #355 of 517 in CA (top 69%) — families likely to look elsewhere, expect single-tenant / working-renter base with shorter leases.
- Market conditions: 93 active listings in the ZIP; 4 comparable units currently listed for rent nearby; rentals lingering (median 44d on market — plan ~5-8 weeks vacancy on turnover, expect pricing pressure); 50% of comp listings sitting > 30 days — soft ceiling on asking rent; 246 units permitted in Shasta County in 2024 (0 in 5+ unit buildings).
Forward outlook
- Local home prices are declining (-3.0%/yr); year-one equity from $1k of loan paydown is wiped out by about $5k of value loss. Plan a longer hold.
- Shasta County population projected to shrink 9% by 2050 — rents likely to lag national; underwrite the cash flow, not the appreciation.
Negotiation context
- It's been on market 32 days — a 3% lower offer ($175k) is reasonable based on typical stale-listing flexibility.
- 2 sale attempts with the ask held roughly flat each time — persistent listings suggest the price (not the market) is what's stuck; bring a comps-based counter.
- Current owner paid $85k; list at $180k implies a 112% gain — meaningful room to come down on a strong offer.
Risks & watch-outs
- Watch-outs: built in 1950 — expect roof / HVAC / electrical / plumbing capex.
- Climate carrying-cost: major wildfire risk; extreme-heat days projected 7→17/yr by 2055 (HVAC capex compounding) — expect insurance premiums to compound above CPI over the hold.
Questions for the listing agent
- What do current leases actually rent for vs. the listed asking? Can we see a recent rent roll and the last 12 months of T-12 income?
- It's been on market 32 days. Have you received any prior offers? Is the seller open to a 26% concession, seller financing, or rate buy-down credit?
- Built in 1950 — when were the roof, HVAC, electrical panel, plumbing, and water heater last replaced?
- Is there a deadline driving the sale (1031 exchange, divorce, estate, relocation)? That informs how much negotiation room exists.
- Schools are D-rated, which usually means shorter tenancies and higher turnover. Who's the typical renter profile here, and what's been the actual vacancy rate?
- Crime grade is F in this area — have there been break-ins, vandalism, or insurance claims at this property in the last 3 years? What carrier currently insures it and at what premium?
- The area grade is low — what's the realistic commute time and amenity access for the typical tenant pool here? Any planned neighborhood developments (good or bad) we should know about?
- What's the average days-on-market for RENTAL listings here right now (not sales)? A rising rental-DOM trend means longer vacancies and softer asking-rent achievability than the comps imply.
- What's the recent tenant-quality profile in this submarket — average credit score on applications, eviction rate, late-payment / NSF rate, and stable-employment percentage? A property-management company in the area should have these aggregated.
- How much new for-sale + rental construction is in the pipeline within 1–3 miles? Heavy new supply typically softens prices + rents 12–24 months out; constrained supply supports both.
Investment metrics
- 1% rule
- 0.74% ✗
- Cap rate
- 5.68%
- Cash-on-cash
- -2.17%
- DSCR
- 0.90
- GRM
- 11.3
CMA / ARV
- ARV (median comp)
- $256,497
- List price
- $180,000
- Delta
- -29.82%
- Verdict
- UNDERPRICED
- Comps
- 20 within 1.0 mi
Show comp detail 12 sales within ~0.75 mi
| Address | Dist | Beds/Ba | Sqft | Sold | Price | $/sf | Match |
|---|---|---|---|---|---|---|---|
| 5156 Fort Peck St | 0.36mi | 2/1.0 | 748 (-6%) | 1mo | $292,000 | $390 | 72 |
| 2048 Cabello St | 0.33mi | 2/1.0 | 813 (+2%) | 15mo | $255,000 | $314 | 69 |
| 1233 Hardenbrook Ave | 0.49mi | 2/1.0 | 800 (+0%) | 10mo | $185,000 | $231 | 68 |
| 5156 Main St | 0.43mi | 2/1.0 | 816 (+2%) | 11mo | $250,000 | $306 | 67 |
| 4141 Red Blf | 0.69mi | 2/1.0 | 792 (-0%) | 2mo | $284,500 | $359 | 65 |
| 5160 Fort Peck St | 0.36mi | 2/1.0 | 748 (-6%) | 10mo | $280,000 | $374 | 65 |
| 5209 Front St | 0.43mi | 2/1.0 | 768 (-4%) | 13mo | $105,000 | $137 | 64 |
| 2332 Washington Ave | 0.75mi | 2/1.0 | 792 (-0%) | 10mo | $299,000 | $378 | 56 |
| 1112 Mussel Shoals Ave | 0.49mi | 2/1.0 | 855 (+7%) | 17mo | $229,000 | $268 | 50 |
| 1413 Locust Ave | 0.49mi | 2/1.0 | 700 (-12%) | 14mo | $265,500 | $379 | 46 |
| 941 Mussel Shoals Ave | 0.59mi | 2/1.0 | 874 (+10%) | 16mo | $263,000 | $301 | 43 |
| 1865 Ashby Rd | 0.73mi | 2/2.0 | 884 (+11%) | 3mo | $268,500 | $304 | 41 |
Match score weights: distance 35% · size 25% · config 20% · recency 20%. Top-matched comps best support the ARV.
Projected returns pro-forma
-3.0% appreciation · 3.0% rent growth · sell at horizon
- IRR
- -19.9%
- Equity multiple
- 0.31×
- Total profit
- $-35,021
- Equity at exit
- $26,839
- IRR
- -12.9%
- Equity multiple
- 0.24×
- Total profit
- $-38,153
- Equity at exit
- $15,563
Cash invested: $50,400 (down + closing). Projections, not guarantees.
Landlord ↔ Tenant lean methodology
- Overall (STATE)
- 18 Strongly Tenant-Friendly
- State California
- 18 Strongly Tenant-Friendly · D+13
- County
- — inherits STATE
- City
- — inherits STATE
ZIP-level market 96019
- Active inventory
- 93
- Price-to-rent
- 11.3×
Monthly cashflow live
- Estimated rent
- $1,329 medium interval (Pro) →
- Mortgage (P&I)
- −$944
- Tax from tax record
- −$122 /mo · $1,464/yr
- Insurance
- −$75
- HOA
- −$0
- Vacancy / Maint / Mgmt
- −$279
- Net cashflow
- $-91
Break-even live
UW: 25.0% down · 7.5% · 30yr · 1.5% tax · 5.0% vac · 8.0% maint · 8.0% mgmt
Financing live
Cash to close
- Down payment
- $45,000
- Closing costs
- $5,400
- Reserves months
- —
- Total cash needed
- —
Loan-product check · same deal, 3 products live
Conventional
25% down · 7.5% · 30yr
- Down + closing
- —
- Monthly P&I
- —
- Monthly cashflow
- —
- DSCR
- —
- Eligible?
- —
Personal DTI + credit; lowest rate.
DSCR
20% down · 8.5% · 30yr
- Down + closing
- —
- Monthly P&I
- —
- Monthly cashflow
- —
- DSCR
- —
- Eligible?
- —
No personal income docs; deal must DSCR.
Hard money
10% down · 12.0% · 12mo
- Down + closing
- —
- Monthly P&I
- —
- Monthly cashflow
- —
- DSCR
- —
- Eligible?
- —
Short-term bridge; refi at stabilization.
Rent comps 4 comps
| Address | Beds | Baths | Sqft | Rent | $/sqft | DOM | Units | Dist |
|---|---|---|---|---|---|---|---|---|
| 4680 Meade St Shasta Lake, CA | 1.0 | 1.0 | 800 | $1,150 | $1.44 | 44d | 1 | 0.04mi |
| 1707 Grand Coulee Blvd Unit B Shasta Lake, CA | 2.0 | 1.0 | 800 | $1,459 | $1.82 | 13d | 1 | 0.17mi |
| 4325 Fort Peck St Shasta Lake, CA | 2.0 | 1.0 | 864 | $1,600 | $1.85 | 13d | 1 | 0.37mi |
| 4210 Main St Apt 6 Shasta Lake, CA | 1.0 | 1.0 | 600 | $1,050 | $1.75 | 44d | 1 | 0.53mi |
Listing history 18 events
-
2026-06-19statusdays on market $180,000 Active 32 DOM
-
2026-06-15status $180,000 Pending 31 DOM
-
2026-06-15days on market $180,000 Active 31 DOM
-
2026-06-14days on market $180,000 Active 29 DOM
-
2026-06-13days on market $180,000 Active 28 DOM
-
2026-06-10days on market $180,000 Active 26 DOM
-
2026-06-09days on market $180,000 Active 25 DOM
-
2026-06-08days on market $180,000 Active 24 DOM
-
2026-06-07days on market $180,000 Active 23 DOM
-
2026-06-03days on market $180,000 Active 19 DOM
-
2026-06-02days on market $180,000 Active 18 DOM
-
2026-06-01days on market $180,000 Active 17 DOM
-
2026-05-31days on market $180,000 Active 16 DOM
-
2026-05-30days on market $180,000 Active 15 DOM
-
2026-05-15$180,000 Active 995-char remark
-
2026-04-15price $189,000
-
2026-03-25$199,000 Active
-
2002-04-29soldstatus $85,000
ⓘ Source: listings_history table (triggers on properties + properties_extension) + one-shot
backfill from property_details.listing_events for pre-trigger history.
Tax reassessment forecast CA · Resets to sale price
- Current annual tax
- $1,464 · $122/mo
- Projected year-2 tax
- $1,464 · $122/mo
- Expected delta
- $0/yr ($0/mo · 0.0%)
ⓘ Screening estimate from a state-policy table — verify with the county assessor before closing.
Climate risk First Street
- Flood 1/10 Low FEMA zone X (unshaded) · 0% chance over 30 yrs
- Wildfire 7/10 Severe
- Heat 8/10 Severe 7 d/yr ≥105°F today · 17 d/yr by 30 yrs out
- Wind 1/10 Low
- Air quality 10/10 Extreme 44 unhealthy d/yr today · 46 by 30 yrs out
Nearby sold comps map
Loading sold comps map…
Walkable amenities ~0.75 mi
Loading nearby amenities…
Taxation est. · year 1
- Rental income
- $15,945
- − Mortgage interest
- −$10,083
- − Property taxes
- −$1,464
- − Insurance
- −$900
- − Repairs & maintenance
- −$1,276
- − Management
- −$1,276
- − Depreciation
- −$5,236
- Taxable loss
- −$4,289
- Est. tax savings @ 24.0%
- +$1,029
- After-tax cash flow
- $-65/yr
For passive investors: Depreciation is non-cash, so a rental often shows a tax loss while cash-flowing — sheltering income. Rental losses are passive: they offset passive income freely, and up to $25,000/yr can offset ordinary (W-2) income if you actively participate and your MAGI is under $100k (phasing out to $0 by $150k); unused losses carry forward. On sale, claimed depreciation is recaptured at up to 25%, and gains may owe capital-gains tax (a 1031 exchange can defer both). Figures are a year-1 estimate at your 24.0% rate — not tax advice; consult a CPA.
Schools (NCES district)
- District
- Gateway Unified
- NCES district ID
- 0614950
- Math proficiency
- 25% ▼ -5.00%
- Reading proficiency
- 35% ▲ 2.00%
- Median HH income
- $41,888
- Composite
- 25.39/100
- National rank
- #7465
- State rank
- #355 of 517 in CA
Livability — Shasta Lake
- Score
- 65/100
- State rank
- #399
- US rank
- #13546
Category grades
Schools grade is shown separately in the Schools card above.
Census & demographics
- Census place
- Shasta Lake, CA
- County
- Shasta County · 147,641 people
- City population
- 10,350
- Metro
- Redding, CA
- Population (ZIP)
- 10,350
- Household income
- $67,446
- Rent vs Own
- Severe rent burden
- 260.0
Population outlook (Shasta County) Hauer SSP2
- Today (2025)
- 179,231 people
- By 2030
- 176,953 · -1.3%
- By 2040
- 169,982 · -5.2%
- By 2050
- 162,547 · -9.3%
- By 2075
- 145,649 · -18.7%
- By 2100
- 123,025 · -31.4%
Race, ethnicity, and origin ACS 2023
- Neighborhood character
- Predominantly White (77%)
- Race & ethnicity
- White 77% Two or more races 12% Hispanic / Latino 9% Asian 4% Native American 2%
- Hispanic origin (detail)
- Mexican 8%
- Common ancestry
- Russian 4% Romanian 4% Italian 4%
- Foreign-born
- 2% · Canada
- Languages at home
- 94% English-only · Spanish 4% Other Asian/Pacific 1%
Political lean MEDSL · Shasta
- 2024 margin
- Solid R (+36.5) · D 30.5% · R 67.0% · Other 2.5%
- 2008→2024 swing
- -10.7pp toward R · 2008: -25.8pp · 2024: -36.5pp
- All cycles
- 2024: R+36.5 2020: R+33.1 2016: R+37.4 2012: R+30.3 2008: R+25.8
Not yet ingested
- Civics
- —
Market trends
- HPI YoY
- ▼ -194.66%
- Current HPI
- 170.6085
- Rent YoY
- —
- Metro
- Redding, CA
- State GDP YoY
- ▲ 3.21%
- F500 in state
- 116
Industry mix (Fortune 500 HQ in CA)
| Industry | F500 HQs | Revenue |
|---|---|---|
| Technology | 27 | $1,492B |
|
||
| Financial Services | 3 | $174B |
|
||
| Retail | 3 | $44B |
|
||
| Insurance | 3 | $26B |
|
||
| Media / Entertainment | 2 | $115B |
|
||
| Pharmaceuticals / Biotech | 2 | $62B |
|
||
Price history
+111.8% since first listed5 events — show timeline
- 2026-06-15 Pending — SAOR
- 2026-05-15 Listed $180,000 SAOR
- 2026-04-15 Price Changed $189,000 SAOR
- 2026-03-25 Listed $199,000 SAOR
- 2002-04-29 Sold (Public Records) $85,000 Public Records
Property tax history
+3.9%/yrLatest (2025): $1,464 · +5.3% YoY. Source: county tax records.
Cash-flow waterfall
monthlySold comps — $/sqft
last 12 mo · ≤1 miLoading sold comps…