339 Blossom Circle Cir · Toledo, OH
Flood risk No data
- FEMA flood zone
- —
- Chance of flooding over 30 yrs
- —
- Est. flood insurance / yr
- —
Fire risk No data
- Est. fire insurance / yr
- —
Heat risk No data
- Hot days now (above threshold)
- —
- Hot days in 30 yrs
- —
Wind risk No data
- Chance of severe wind over 30 yrs
- —
Air-quality risk No data
- Unhealthy air days now
- —
- Unhealthy air days in 30 yrs
- —
Risk factors via First Street. Map © Google.
Why this score? — see what drove the C- grade
The composite is a weighted blend of 9 inputs, each scored 0–100. Each bar is that input's sub-score; the figure is the points it added to the 100-point composite (weight × sub-score).
- Cash flow +23.4/30.0
- 1% rule +10.0/10.0
- DSCR +7.5/10.0
- Schools +3.8/10.0
- Livability +3.3/5.0
- Rent growth +2.5/5.0
- Condition / age +2.2/5.0
- ARV discount +1.3/15.0
- Appreciation +0.0/10.0
$71,900
🖨 Deal sheet 📄 Offer letter ✓ Due diligence
Listing remarks MLS
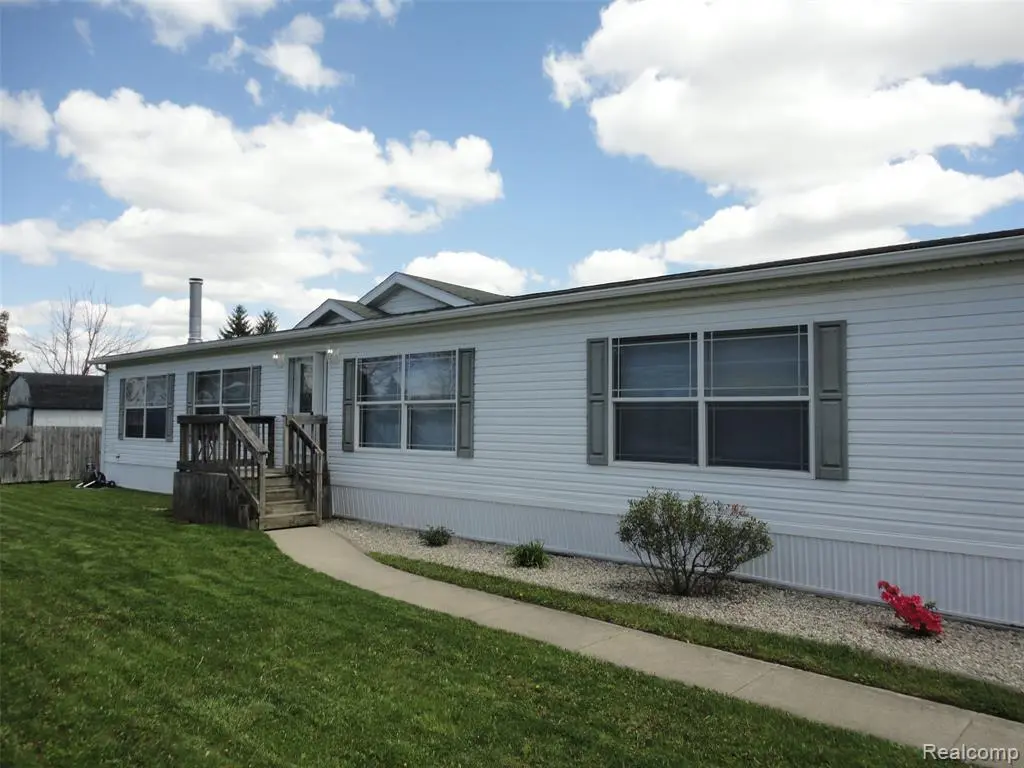
Super clean, 2,000 sq. ft. manufactured home with huge open floor plan, large living room, large family room with fireplace, kitchen, and dining area, plus 3 bedrooms and 2 full baths. This is a manufactured home on a rented lot in Northtowne Meadows mobile home park which has an in-ground swimming, playground, dog park and community room.
Key facts
- Dog park
- Open floor plan
- In-ground swimming
Tags
Property features AI
Finance
- HOA & community: Homeowners association with a monthly fee of $553; Community pool
Exterior
- Parking: No garage; assigned parking
- Utilities: Public water; Public sewer; Cable available; Underground utilities
- Home design: Single-family residence; One level; Ground-level entry with steps
- Construction: Vinyl siding; Asphalt roof; Block and pillar/post/pier foundation; Built as a residential single-family home
- Exterior features: In-ground community pool; Paved road access; 40 x 90 lot dimensions; Pets allowed with breed restrictions; cats and dogs OK
Interior
- Kitchen: Dishwasher; Free-standing gas range; Free-standing refrigerator
- Bathrooms: 2 full bathrooms
- Heating & cooling: Central air conditioning; Forced air heating (natural gas)
- Interior features: Fireplace in the family room; Total of 8 rooms
- Laundry & utility: Washer included
Neighborhood map
What this means for you Summary
Snapshot
- This is a 3-bed/2.0-bath single-family listed at $72k. Condition is rated fair.
Deal economics
- At list price, monthly cash flow is $133 ($2k/yr) — positive.
- The deal already cash-flows at list — no discount required.
- Meets the 1% rule at list price ($1k rent vs $72k).
- Recommended offer: $71k (1.5% below list) — sets the bar for market timing.
Location & tenants
- Location reads 66/100 on livability (#645 in OH) — a middle-class / working-renter tenant base. Strengths: cost of living A+, housing A+, health & safety A+; Watch: amenities C-, schools D-, crime F.
- Bedford Public Schools (suburban): math 33% / reading 53% proficiency, ranked #150 of 540 in MI (top 28%) — families likely to look elsewhere, expect single-tenant / working-renter base with shorter leases; only 18% free/reduced lunch — higher-income household profile.
- Market conditions: 264 units permitted in Monroe County in 2024 (40 in 5+ unit buildings).
Forward outlook
- Local home prices are declining (-3.0%/yr); year-one equity from $497 of loan paydown is wiped out by about $2k of value loss. Plan a longer hold.
- Monroe County population projected at -20% by 2050 — secular population decline; favor cash flow + early exit over multi-decade hold.
Negotiation context
- It's been on market 23 days — a 2% lower offer ($71k) is reasonable based on typical stale-listing flexibility.
- 2 sale attempts with the ask held roughly flat each time — persistent listings suggest the price (not the market) is what's stuck; bring a comps-based counter.
Risks & watch-outs
- Watch-outs: HOA is 37% of rent.
Questions for the listing agent
- Have any recent inspections been done? Can we get a copy of the seller's disclosures and any deferred-maintenance estimates?
- What does the HOA fee cover, when was the last increase, and are there any pending special assessments or reserve-fund shortfalls?
- Is there a deadline driving the sale (1031 exchange, divorce, estate, relocation)? That informs how much negotiation room exists.
- Schools are D-rated, which usually means shorter tenancies and higher turnover. Who's the typical renter profile here, and what's been the actual vacancy rate?
- Crime grade is F in this area — have there been break-ins, vandalism, or insurance claims at this property in the last 3 years? What carrier currently insures it and at what premium?
- What's the average days-on-market for RENTAL listings here right now (not sales)? A rising rental-DOM trend means longer vacancies and softer asking-rent achievability than the comps imply.
- What's the recent tenant-quality profile in this submarket — average credit score on applications, eviction rate, late-payment / NSF rate, and stable-employment percentage? A property-management company in the area should have these aggregated.
- How much new for-sale + rental construction is in the pipeline within 1–3 miles? Heavy new supply typically softens prices + rents 12–24 months out; constrained supply supports both.
Investment metrics
- 1% rule
- 2.08% ✓
- Cap rate
- 8.51%
- Cash-on-cash
- 7.91%
- DSCR
- 1.35
- GRM
- 4.0
CMA / ARV
- ARV (median comp)
- $63,219
- List price
- $71,900
- Delta
- 13.73%
- Verdict
- OVERPRICED
- Comps
- 20 within 1.0 mi
Show comp detail 12 sales within ~0.75 mi
| Address | Dist | Beds/Ba | Sqft | Sold | Price | $/sf | Match |
|---|---|---|---|---|---|---|---|
| 6255 Telegraph Rd, Lot 346 Rd | 0.02mi | 3/2.0 | 1,792 (-11%) | 15mo | $105,000 | $59 | 68 |
| 6115 Benalex Dr | 0.52mi | 4/2.0 (+1) | 1,970 (-2%) | 3mo | $259,900 | $132 | 64 |
| 6255 Telegraph Road, Lot #181 Rd | 0.15mi | 3/2.0 | 2,240 (+11%) | 13mo | $113,500 | $51 | 64 |
| 773 Hunting Creek Rd | 0.55mi | 3/2.5 | 1,980 (-2%) | 11mo | $325,000 | $164 | 60 |
| 285 Heather | 0.53mi | 3/2.0 | 1,885 (-6%) | 10mo | $83,712 | $44 | 56 |
| 473 Fife | 0.29mi | 2/2.0 (-1) | 1,736 (-14%) | 7mo | $47,000 | $27 | 52 |
| 6130 Holly Valley Dr | 0.50mi | 3/2.0 | 2,275 (+13%) | 10mo | $270,000 | $119 | 47 |
| 6032 W Benalex Dr | 0.61mi | 4/1.5 (+1) | 2,112 (+5%) | 11mo | $225,000 | $107 | 47 |
| 6938 Pheasant View Dr | 0.70mi | 4/2.5 (+1) | 1,924 (-5%) | 12mo | $374,900 | $195 | 43 |
| 6821 Clearview St | 0.54mi | 3/2.0 | 1,762 (-13%) | 17mo | $340,000 | $193 | 40 |
| 265 Wallingford Rd | 0.71mi | 4/2.0 (+1) | 1,764 (-12%) | 6mo | $230,000 | $130 | 36 |
| 216 E State Line Rd | 0.73mi | 3/3.0 | 1,737 (-14%) | 14mo | $317,400 | $183 | 27 |
Match score weights: distance 35% · size 25% · config 20% · recency 20%. Top-matched comps best support the ARV.
Projected returns pro-forma
-3.0% appreciation · 3.0% rent growth · sell at horizon
- IRR
- -3.7%
- Equity multiple
- 0.86×
- Total profit
- $-2,840
- Equity at exit
- $10,721
- IRR
- 6.4%
- Equity multiple
- 1.49×
- Total profit
- $9,877
- Equity at exit
- $6,217
Cash invested: $20,132 (down + closing). Projections, not guarantees.
Monthly cashflow live
- Estimated rent
- $1,497 medium interval (Pro) →
- Mortgage (P&I)
- −$377
- Tax est. 1.5%
- −$90 /mo · $1,078/yr
- Insurance
- −$30
- HOA
- −$553
- Vacancy / Maint / Mgmt
- −$314
- Net cashflow
- $133
Break-even live
UW: 25.0% down · 7.5% · 30yr · 1.5% tax · 5.0% vac · 8.0% maint · 8.0% mgmt
Financing live
Cash to close
- Down payment
- $17,975
- Closing costs
- $2,157
- Reserves months
- —
- Total cash needed
- —
Loan-product check · same deal, 3 products live
Conventional
25% down · 7.5% · 30yr
- Down + closing
- —
- Monthly P&I
- —
- Monthly cashflow
- —
- DSCR
- —
- Eligible?
- —
Personal DTI + credit; lowest rate.
DSCR
20% down · 8.5% · 30yr
- Down + closing
- —
- Monthly P&I
- —
- Monthly cashflow
- —
- DSCR
- —
- Eligible?
- —
No personal income docs; deal must DSCR.
Hard money
10% down · 12.0% · 12mo
- Down + closing
- —
- Monthly P&I
- —
- Monthly cashflow
- —
- DSCR
- —
- Eligible?
- —
Short-term bridge; refi at stabilization.
HOA detail
- Monthly dues
- $553 · $6,636/yr
Listing history 5 events
-
2026-06-01status $71,900 Pending 23 DOM
-
2026-05-31days on market $71,900 Active 23 DOM
Show marketing remark (341 chars)
Super clean, 2,000 sq. ft. manufactured home with huge open floor plan, large living room, large family room with fireplace, kitchen, and dining area, plus 3 bedrooms and 2 full baths. This is a manufactured home on a rented lot in Northtowne Meadows mobile home park which has an in-ground swimming, playground, dog park and community room.
-
2026-05-30days on market $71,900 Active 22 DOM
-
2026-05-07$71,900 Active 341-char remark
Show marketing remark (341 chars)
Super clean, 2,000 sq. ft. manufactured home with huge open floor plan, large living room, large family room with fireplace, kitchen, and dining area, plus 3 bedrooms and 2 full baths. This is a manufactured home on a rented lot in Northtowne Meadows mobile home park which has an in-ground swimming, playground, dog park and community room.
-
2026-05-07$71,900 Active 341-char remark
Show marketing remark (341 chars)
Super clean, 2,000 sq. ft. manufactured home with huge open floor plan, large living room, large family room with fireplace, kitchen, and dining area, plus 3 bedrooms and 2 full baths. This is a manufactured home on a rented lot in Northtowne Meadows mobile home park which has an in-ground swimming, playground, dog park and community room.
ⓘ Source: listings_history table (triggers on properties + properties_extension) + one-shot
backfill from property_details.listing_events for pre-trigger history.
Nearby sold comps map
Loading sold comps map…
Walkable amenities ~0.75 mi
Loading nearby amenities…
Taxation est. · year 1
- Rental income
- $17,962
- − Mortgage interest
- −$4,028
- − Property taxes
- −$1,078
- − Insurance
- −$360
- − Repairs & maintenance
- −$1,437
- − Management
- −$1,437
- − HOA
- −$6,636
- − Depreciation
- −$2,092
- Taxable income
- $895
- Est. tax owed @ 24.0%
- −$215
- After-tax cash flow
- $1,377/yr
For passive investors: Depreciation is non-cash, so a rental often shows a tax loss while cash-flowing — sheltering income. Rental losses are passive: they offset passive income freely, and up to $25,000/yr can offset ordinary (W-2) income if you actively participate and your MAGI is under $100k (phasing out to $0 by $150k); unused losses carry forward. On sale, claimed depreciation is recaptured at up to 25%, and gains may owe capital-gains tax (a 1031 exchange can defer both). Figures are a year-1 estimate at your 24.0% rate — not tax advice; consult a CPA.
Condition & rehab AI · 13 photos
The home is in fair condition with some cosmetic repairs and maintenance needed. Fresh paint and landscaping can significantly enhance its value for both resale and rental.
Repairs flagged
- Minor Paint — Some discoloration and wear on exterior and interior walls.
- Minor Landscaping — Some overgrown areas in the landscaping.
Value-add opportunities
- Both Paint exterior and interior walls — Fresh paint can improve the home's curb appeal and interior aesthetics, enhancing both resale and rental value.
- Both Landscaping — Well-maintained landscaping can significantly boost the home's curb appeal and attract potential buyers or renters.
Renovation cost estimate screening
| Repair item | Severity | Est. cost |
|---|---|---|
| Paint · Some discoloration and wear on exterior and interior walls. | Minor | $500–3,000 |
| Landscaping · Some overgrown areas in the landscaping. | Minor | $500–3,000 |
| Total estimated repair cost · 2 items | $1,000–6,000 |
Value-add ROI direction
- Both Paint exterior and interior walls — Fresh paint can improve the home's curb appeal and interior aesthetics, enhancing both resale and rental value. ↑
- Both Landscaping — Well-maintained landscaping can significantly boost the home's curb appeal and attract potential buyers or renters. ↑
ⓘ Cost ranges are severity-bucket heuristics (US national rule-of-thumb). Get contractor quotes + a written scope before underwriting a rehab budget.
Schools (NCES district)
- District
- Bedford Public Schools
- NCES district ID
- 2604470
- Math proficiency
- 33% ▼ -14.00%
- Reading proficiency
- 53% ▼ -3.00%
- Median HH income
- $63,784
- Composite
- 38.22/100
- National rank
- #4252
- State rank
- #150 of 540 in MI
Livability — Toledo
- Score
- 66/100
- State rank
- #645
- US rank
- #11442
Category grades
Schools grade is shown separately in the Schools card above.
Census & demographics
- County
- Monroe · 13,010 people
- City population
- 280,811
- Metro
- Monroe, MI
- Population (ZIP)
- 6,711
- Household income
- $65,867
- Rent vs Own
- Severe rent burden
- 33.5
Population outlook (Monroe County) Hauer SSP2
- Today (2025)
- 144,439 people
- By 2030
- 140,033 · -3.1%
- By 2040
- 128,408 · -11.1%
- By 2050
- 115,024 · -20.4%
- By 2075
- 87,273 · -39.6%
- By 2100
- 63,110 · -56.3%
Race, ethnicity, and origin ACS 2023
- Neighborhood character
- Predominantly White (89%)
- Race & ethnicity
- White 89% Hispanic / Latino 7% Two or more races 5%
- Hispanic origin (detail)
- Mexican 5%
- Common ancestry
- Lithuanian 11% Romanian 9% Slovak 2%
- Foreign-born
- 0%
Political lean MEDSL · Monroe
- 2024 margin
- Strong R (+27.1) · D 35.7% · R 62.9% · Other 1.4%
- 2008→2024 swing
- -31.5pp toward R · 2008: 4.3pp · 2024: -27.1pp
- All cycles
- 2024: R+27.1 2020: R+22.6 2016: R+22.1 2012: D+1.0 2008: D+4.3
Not yet ingested
- Civics
- —
Market trends
- HPI YoY
- ▼ -126.33%
- Current HPI
- 152.4502
- Rent YoY
- —
- Metro
- —
- State GDP YoY
- ▲ 1.98%
- F500 in state
- 48
Industry mix (Fortune 500 HQ in OH)
| Industry | F500 HQs | Revenue |
|---|---|---|
| Insurance | 3 | $145B |
|
||
| Industrial Machinery | 3 | $49B |
|
||
| Financial Services | 3 | $24B |
|
||
| Consumer Goods | 2 | $93B |
|
||
| Aerospace / Defense | 2 | $47B |
|
||
| Utilities | 2 | $33B |
|
||
Price history
+0.0% since first listed4 events — show timeline
- 2026-05-31 Pending — MiRealSource-MiMLS
- 2026-05-31 Pending — REALCOMP
- 2026-05-07 Listed $71,900 REALCOMP
- 2026-05-07 Listed $71,900 MiRealSource-MiMLS
Cash-flow waterfall
monthlySold comps — $/sqft
last 12 mo · ≤1 miLoading sold comps…