 Triplex
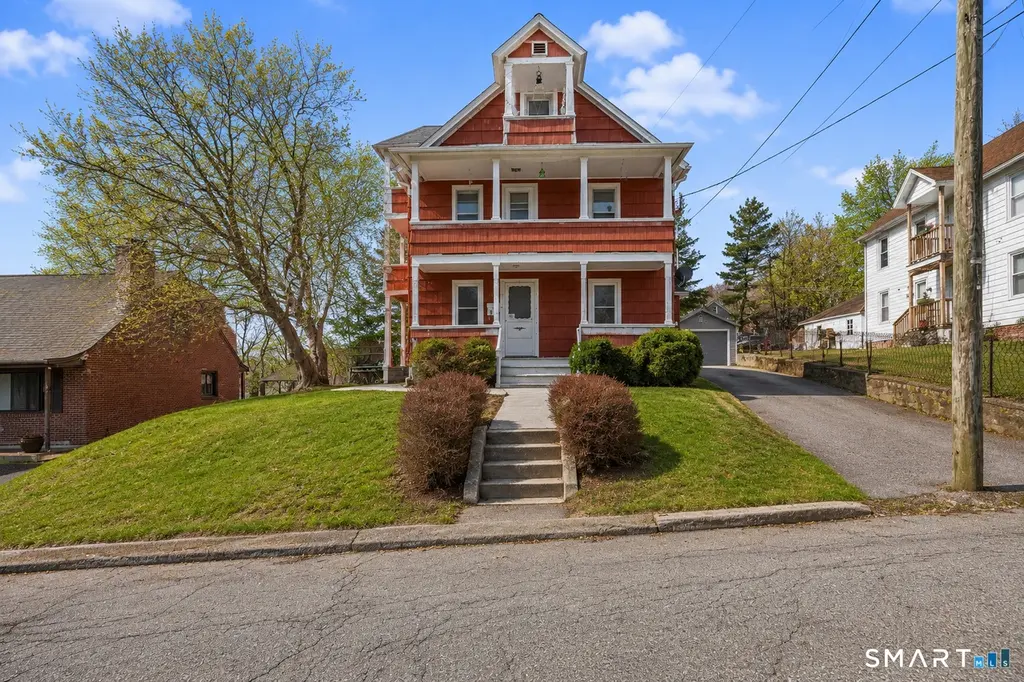
153 Funston Ave · Torrington, CT
Flood risk 1/10 · Minimal
- FEMA flood zone
- X
- Chance of flooding over 30 yrs
- 0.0%
- Est. flood insurance / yr
- $473 – $860
Fire risk 3/10 · Minor
- Est. fire insurance / yr
- $829 – $1,539
Heat risk 4/10 · Minor
- Hot days now (above 93°F)
- 8 days/yr
- Hot days in 30 yrs
- 18 days/yr
Wind risk 5/10 · Moderate
- Chance of severe wind over 30 yrs
- 26.0%
Air-quality risk 2/10 · Minimal
- Unhealthy air days now
- 1 days/yr
- Unhealthy air days in 30 yrs
- 1 days/yr
Risk factors via First Street. Map © Google.
Why this score? — see what drove the C grade
The composite is a weighted blend of 9 inputs, each scored 0–100. Each bar is that input's sub-score; the figure is the points it added to the 100-point composite (weight × sub-score).
- Cash flow +26.8/30.0
- DSCR +9.2/10.0
- 1% rule +6.9/10.0
- Rent growth +4.0/5.0
- Livability +3.8/5.0
- Schools +2.7/10.0
- Condition / age +2.5/5.0
- ARV discount +0.0/15.0
- Appreciation +0.0/10.0
$375,000
🖨 Deal sheet 📄 Offer letter ✓ Due diligence
Multi-family units
County records classify this as Multi-Family (2-4 Unit). Listing-text estimate: 3 units. confirmed
Listing remarks MLS
Well maintained 3 family home on a beautiful .25 Acre lot. 2 Car garage,deck, 2eggresses plenty of off street parking. 2 Furnaces .
Key facts
- Renovated kitchens
- Great curb appeal
- 1-car garage
Tags
Property features AI
Exterior
- Parking: Detached garage; Driveway parking; Total of 8 parking spaces; 1 garage
- Utilities: Public water connected; Public sewer connected; Domestic hot water
- Home design: Multi-family property (3-family); Multi-family for sale
- Construction: Built with frame construction; Brick and stone foundation; Shake siding; Asphalt shingle roof
- Exterior features: Lightly wooded, level lot; Private driveway; Paved areas
Interior
- Bedrooms: 5 bedrooms
- Bathrooms: 3 full bathrooms
- Heating & cooling: Hot water heating (electric); Ceiling fans for cooling
- Interior features: Ceiling fans; Full basement
Neighborhood map
What this means for you Summary
Snapshot
- This is a 2×2bd/1ba + 1×1bd/1ba units multifamily listed at $375k.
Deal economics
- At list price, monthly cash flow is $1k ($12k/yr) — positive. Per door: $341/mo.
- The deal already cash-flows at list — no discount required.
- Meets the 1% rule at list price ($4k rent vs $375k).
- Recommended offer: $369k (1.5% below list) — sets the bar for market timing.
- Cap rate 9.6% vs local median 3.9% in Torrington — top-decile yield for the area; either an underpriced asset or a hidden risk that comps aren't pricing in. Stress-test before assuming the spread holds.
Location & tenants
- Location reads 76/100 on livability (#53 in CT, #3,449 nationally) — a middle-class / working-renter tenant base. Strengths: crime A+, cost of living A+, housing A+; Watch: commute F.
- Torrington School District (town): math 22% / reading 39% proficiency, ranked #125 of 153 in CT (top 82%) — families likely to look elsewhere, expect single-tenant / working-renter base with shorter leases.
- Zoned schools: Torrington High School (math 22% / reading 47%, grade F, #121 of 194 statewide, top 64%, 1,010 students, 57% FRL) — zoned schools average 57% FRL vs 40% district-wide (17 pts higher); higher-poverty schools than district average — tighter screening recommended.
- Market conditions: Rents rising fast (+5.9%/yr); 188 active listings in the ZIP; 3 comparable units currently listed for rent nearby; rentals lingering (median 44d on market — plan ~5-8 weeks vacancy on turnover, expect pricing pressure); 100% of comp listings sitting > 30 days — soft ceiling on asking rent; 154 units permitted in Northwest Hills Planning Region in 2024 (6 in 5+ unit buildings).
- At $4,473/mo this rent would consume 76% of the median local household income ($71k/yr) (locally 1401% of renters already pay >50% of income on rent) — very limited rent-growth headroom before tenants either downsize or default.
Forward outlook
- Local home prices are declining (-3.0%/yr); year-one equity from $3k of loan paydown is wiped out by about $11k of value loss. Plan a longer hold.
- At projected returns (-3.0% appreciation + 5.9% rent growth), your $105k cash investment doubles in ~8 years — after that, you're playing with house money.
Negotiation context
- It's been on market 15 days — a 2% lower offer ($369k) is reasonable based on typical stale-listing flexibility.
- 3 sale attempts since 25y ago with the ask held roughly flat each time — persistent listings suggest the price (not the market) is what's stuck; bring a comps-based counter.
- Current owner paid $155k; list at $375k implies a 142% gain — meaningful room to come down on a strong offer.
Risks & watch-outs
- Watch-outs: built in 1900 — expect roof / HVAC / electrical / plumbing capex.
- Climate carrying-cost: moderate wind risk, 26% chance of damaging wind over 30y — expect insurance premiums to compound above CPI over the hold.
Questions for the listing agent
- Can we see the unit-by-unit rent roll, current vacancy, and any below-market leases? What's the average tenancy length?
- What capital expenditures (roof, boiler, parking lot, exteriors) have been made in the last 5 years, and what's planned in the next 2?
- Built in 1900 — when were the roof, HVAC, electrical panel, plumbing, and water heater last replaced?
- Is there a deadline driving the sale (1031 exchange, divorce, estate, relocation)? That informs how much negotiation room exists.
- Schools are D-rated, which usually means shorter tenancies and higher turnover. Who's the typical renter profile here, and what's been the actual vacancy rate?
- What's the average days-on-market for RENTAL listings here right now (not sales)? A rising rental-DOM trend means longer vacancies and softer asking-rent achievability than the comps imply.
- What's the recent tenant-quality profile in this submarket — average credit score on applications, eviction rate, late-payment / NSF rate, and stable-employment percentage? A property-management company in the area should have these aggregated.
- How much new apartment / multifamily construction is in the pipeline within 1–3 miles? Heavy new supply (>2% of stock underway) typically softens rents 12–24 months out; light construction supports rent growth.
Investment metrics
- 1% rule
- 1.19% ✓
- Cap rate
- 9.57%
- Cash-on-cash
- 11.70%
- DSCR
- 1.52
- GRM
- 7.0
CMA / ARV
- ARV (median comp)
- $311,622
- List price
- $375,000
- Delta
- 20.34%
- Verdict
- OVERPRICED
- Comps
- 20 within 1.0 mi
Show comp detail 12 sales within ~0.75 mi
| Address | Dist | Beds/Ba | Sqft | Sold | Price | $/sf | Match |
|---|---|---|---|---|---|---|---|
| 231 Beechwood Ave | 0.14mi | 6/2.5 (+1) | 2,072 (+1%) | 3mo | $233,000 | $112 | 83 |
| 64 Cooper St | 0.27mi | 4/2.0 (-1) | 2,100 (+2%) | 2mo | $365,000 | $174 | 73 |
| 100 Roosevelt Ave | 0.05mi | 5/2.0 | 1,862 (-10%) | 11mo | $280,000 | $150 | 69 |
| 24 Maple St | 0.19mi | 4/2.0 (-1) | 2,129 (+3%) | 10mo | $262,000 | $123 | 68 |
| 80 Washington Ave | 0.35mi | 4/2.0 (-1) | 1,918 (-7%) | 2mo | $335,000 | $175 | 62 |
| 370 High St | 0.22mi | 5/3.0 | 2,302 (+12%) | 17mo | $359,000 | $156 | 56 |
| 192 High St | 0.24mi | 4/2.0 (-1) | 1,854 (-10%) | 16mo | $280,000 | $151 | 50 |
| 78 Maplewood Ave | 0.36mi | 4/2.0 (-1) | 2,184 (+6%) | 18mo | $355,000 | $163 | 49 |
| 77 Lewis St | 0.58mi | 4/2.0 (-1) | 2,126 (+3%) | 14mo | $248,000 | $117 | 46 |
| 29 Berry St | 0.64mi | 6/2.0 (+1) | 1,910 (-7%) | 5mo | $355,000 | $186 | 45 |
| 23 Berry St | 0.62mi | 4/2.0 (-1) | 1,882 (-9%) | 5mo | $320,000 | $170 | 43 |
| 271 S Main St | 0.65mi | 4/3.0 (-1) | 2,338 (+14%) | 6mo | $290,000 | $124 | 37 |
Match score weights: distance 35% · size 25% · config 20% · recency 20%. Top-matched comps best support the ARV.
Projected returns pro-forma
-3.0% appreciation · 5.89% rent growth · sell at horizon
- IRR
- 4.3%
- Equity multiple
- 1.17×
- Total profit
- $17,819
- Equity at exit
- $55,914
- IRR
- 16.2%
- Equity multiple
- 2.50×
- Total profit
- $157,795
- Equity at exit
- $32,423
Cash invested: $105,000 (down + closing). Projections, not guarantees.
Landlord ↔ Tenant lean methodology
- Overall (STATE)
- 27 Tenant-Leaning
- State Connecticut
- 27 Tenant-Leaning · D+7
- County
- — inherits STATE
- City
- — inherits STATE
ZIP-level market 06790
- Rents YoY
- 5.9%
- Active inventory
- 188
- Price-to-rent
- 20.6×
Monthly cashflow live
- Estimated rent
- $4,473 high interval (Pro) →
- Mortgage (P&I)
- −$1,967
- Tax from tax record
- −$387 /mo · $4,649/yr
- Insurance
- −$156
- HOA
- −$0
- Vacancy / Maint / Mgmt
- −$939
- Net cashflow
- $1,023
Break-even live
3-unit breakdown (identical units grouped — click to expand)
| Units | Beds | Baths | Est. rent |
|---|---|---|---|
| 2× units | 2 | 1 | $3,040 |
| #1 | 2 | 1 | $1,520 |
| #2 | 2 | 1 | $1,520 |
| 1× unit | 1 | 1 | $1,434 |
| Total (3 units) | $4,473 | ||
UW: 25.0% down · 7.5% · 30yr · 1.5% tax · 5.0% vac · 8.0% maint · 8.0% mgmt
Financing live
Cash to close
- Down payment
- $93,750
- Closing costs
- $11,250
- Reserves months
- —
- Total cash needed
- —
Loan-product check · same deal, 3 products live
Conventional
25% down · 7.5% · 30yr
- Down + closing
- —
- Monthly P&I
- —
- Monthly cashflow
- —
- DSCR
- —
- Eligible?
- —
Personal DTI + credit; lowest rate.
DSCR
20% down · 8.5% · 30yr
- Down + closing
- —
- Monthly P&I
- —
- Monthly cashflow
- —
- DSCR
- —
- Eligible?
- —
No personal income docs; deal must DSCR.
Hard money
10% down · 12.0% · 12mo
- Down + closing
- —
- Monthly P&I
- —
- Monthly cashflow
- —
- DSCR
- —
- Eligible?
- —
Short-term bridge; refi at stabilization.
Rent comps 3 comps
| Address | Beds | Baths | Sqft | Rent | $/sqft | DOM | Units | Dist |
|---|---|---|---|---|---|---|---|---|
| 163 Beechwood Ave Torrington, CT | 4.0 | 2.0 | 1896 | $2,800 | $1.48 | 43d | 1 | 0.22mi |
| 14 Culvert St Unit 2 Torrington, CT | 4.0 | 1.0 | 1638 | $1,695 | $1.03 | 43d | 1 | 0.24mi |
| 58 E Pearl St Torrington, CT | 4.0 | 2.0 | 2588 | $2,300 | $0.89 | 43d | 1 | 0.85mi |
Listing history 8 events
-
2026-05-13$375,000 Active 1167-char remark
-
2022-11-02soldstatus $155,000
-
2003-12-10soldstatus $145,000 131-char remark
Show marketing remark (131 chars)
Well maintained 3 family home on a beautiful .25 Acre lot. 2 Car garage,deck, 2eggresses plenty of off street parking. 2 Furnaces .
-
2003-12-09soldstatus $145,000
-
2003-07-01$154,900 131-char remark
Show marketing remark (131 chars)
Well maintained 3 family home on a beautiful .25 Acre lot. 2 Car garage,deck, 2eggresses plenty of off street parking. 2 Furnaces .
-
2001-11-07soldstatus $108,500
-
2001-11-06soldstatus $108,500
Show marketing remark (153 chars)
All units rented with leases, 1/2 of garage used by 1st floor tenant,3rd floor tenant uses other 1/2. 1St floor tenant mows the lawn and removes the snow
-
2001-06-24$114,900
Show marketing remark (153 chars)
All units rented with leases, 1/2 of garage used by 1st floor tenant,3rd floor tenant uses other 1/2. 1St floor tenant mows the lawn and removes the snow
ⓘ Source: listings_history table (triggers on properties + properties_extension) + one-shot
backfill from property_details.listing_events for pre-trigger history.
Tax reassessment forecast CT · Partial reset (capped growth)
- Current annual tax
- $4,649 · $387/mo
- Projected year-2 tax
- $6,337 · $528/mo
- Expected delta
- +$1,688/yr (+$141/mo · 36.3%)
ⓘ Screening estimate from a state-policy table — verify with the county assessor before closing.
Climate risk First Street
- Flood 1/10 Low FEMA zone X · 0% chance over 30 yrs
- Wildfire 3/10 Moderate
- Heat 4/10 Moderate 8 d/yr ≥93°F today · 18 d/yr by 30 yrs out
- Wind 5/10 Major 26% chance of damaging wind over 30 yrs
- Air quality 2/10 Low 1 unhealthy d/yr today · 1 by 30 yrs out
Nearby sold comps map
Loading sold comps map…
Walkable amenities ~0.75 mi
Loading nearby amenities…
Taxation est. · year 1
- Rental income
- $53,676
- − Mortgage interest
- −$21,006
- − Property taxes
- −$4,649
- − Insurance
- −$1,875
- − Repairs & maintenance
- −$4,294
- − Management
- −$4,294
- − Depreciation
- −$10,909
- Taxable income
- $6,649
- Est. tax owed @ 24.0%
- −$1,596
- After-tax cash flow
- $10,686/yr
For passive investors: Depreciation is non-cash, so a rental often shows a tax loss while cash-flowing — sheltering income. Rental losses are passive: they offset passive income freely, and up to $25,000/yr can offset ordinary (W-2) income if you actively participate and your MAGI is under $100k (phasing out to $0 by $150k); unused losses carry forward. On sale, claimed depreciation is recaptured at up to 25%, and gains may owe capital-gains tax (a 1031 exchange can defer both). Figures are a year-1 estimate at your 24.0% rate — not tax advice; consult a CPA.
Schools (NCES district)
- District
- Torrington School District
- NCES district ID
- 0904590
- Math proficiency
- 22% ▼ -8.00%
- Reading proficiency
- 39% ▼ -6.00%
- Median HH income
- $53,647
- Composite
- 26.9/100
- National rank
- #7087
- State rank
- #125 of 153 in CT
Livability — Torrington
- Score
- 76/100
- State rank
- #53
- US rank
- #3449
Category grades
Schools grade is shown separately in the Schools card above.
Census & demographics
- Census place
- Torrington, CT
- County
- Litchfield County · 81,203 people
- City population
- 35,566
- Metro
- Torrington, CT
- Population (ZIP)
- 35,566
- Household income
- $70,912
- Rent vs Own
- Severe rent burden
- 1401.0
Population outlook (Northwest Hills County) Hauer SSP2
- By 2040
- 118,998
Race, ethnicity, and origin ACS 2023
- Neighborhood character
- Predominantly White (73%)
- Race & ethnicity
- White 73% Hispanic / Latino 14% Two or more races 8% Black 6% Asian 3%
- Hispanic origin (detail)
- Puerto Rican 5% Dominican 2%
- Common ancestry
- Romanian 8% Lithuanian 5% Slovak 2%
- Foreign-born
- 12% · Canada, South Korea, Jamaica
- Languages at home
- 86% English-only · Spanish 8% Other Indo-European 2% Russian/Polish/Slavic 1%
Political lean MEDSL · Northwest Hills
- 2024 margin
- Toss-up / Even · D 48.6% · R 49.9% · Other 1.6%
- All cycles
- 2024: R+1.3
Not yet ingested
- Civics
- —
Market trends
- HPI YoY
- ▼ -122.78%
- Current HPI
- 208.4818
- Rent YoY
- ▲ 5.89%
- Metro
- Torrington, CT
- State GDP YoY
- ▲ 1.06%
- F500 in state
- 38
Industry mix (Fortune 500 HQ in CT)
| Industry | F500 HQs | Revenue |
|---|---|---|
| Industrial Machinery | 4 | $38B |
|
||
| Insurance | 3 | $71B |
|
||
| Financial Services | 2 | $25B |
|
||
| Transportation / Logistics | 2 | $18B |
|
||
| Healthcare | 1 | $247B |
|
||
| Telecommunications | 1 | $55B |
|
||
Price history
+226.4% since first listed9 events — show timeline
- 2026-05-28 Pending — Smart MLS
- 2026-05-13 Listed $375,000 Smart MLS
- 2022-11-02 Sold (Public Records) $155,000 Public Records
- 2003-12-10 Sold (MLS) $145,000 Smart MLS
- 2003-12-09 Sold (Public Records) $145,000 Public Records
- 2003-07-01 Listed $154,900 Smart MLS
- 2001-11-07 Sold (Public Records) $108,500 Public Records
- 2001-11-06 Sold (MLS) $108,500 Smart MLS
- 2001-06-24 Listed $114,900 Smart MLS
Property tax history
+1.1%/yrLatest (2023): $4,649 · +1.8% YoY. Source: county tax records.
Cash-flow waterfall
monthlySold comps — $/sqft
last 12 mo · ≤1 miLoading sold comps…