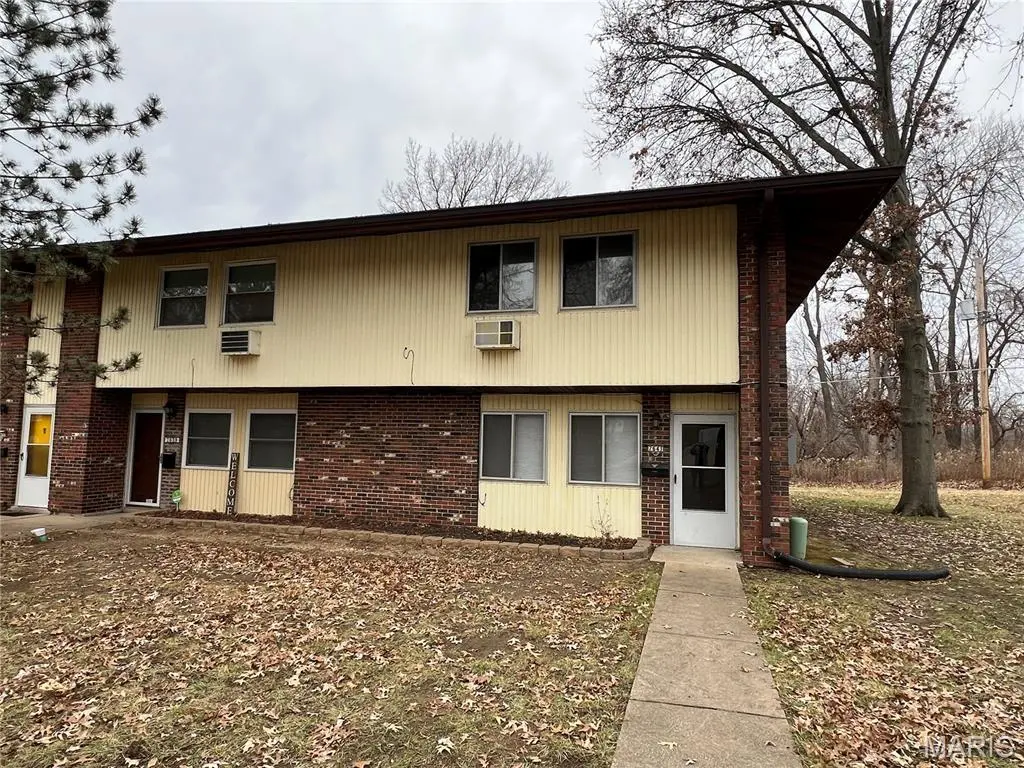
7641 Hazelcrest Dr · Hazelwood, MO
Flood risk 4/10 · Minor
- FEMA flood zone
- X (unshaded)
- Chance of flooding over 30 yrs
- 0.2%
- Est. flood insurance / yr
- $507 – $1,088
Fire risk 1/10 · Minimal
- Est. fire insurance / yr
- $1,054 – $1,958
Heat risk 5/10 · Moderate
- Hot days now (above 105°F)
- 7 days/yr
- Hot days in 30 yrs
- 22 days/yr
Wind risk 2/10 · Minimal
- Chance of severe wind over 30 yrs
- 1.0%
Air-quality risk 3/10 · Minor
- Unhealthy air days now
- 3 days/yr
- Unhealthy air days in 30 yrs
- 5 days/yr
Risk factors via First Street. Map © Google.
Why this score? — see what drove the C+ grade
The composite is a weighted blend of 9 inputs, each scored 0–100. Each bar is that input's sub-score; the figure is the points it added to the 100-point composite (weight × sub-score).
- Cash flow +25.8/30.0
- 1% rule +10.0/10.0
- DSCR +8.7/10.0
- ARV discount +6.3/15.0
- Rent growth +3.6/5.0
- Livability +3.1/5.0
- Condition / age +2.5/5.0
- Schools +1.2/10.0
- Appreciation +0.0/10.0
$79,000
🖨 Deal sheet 📄 Offer letter ✓ Due diligence
Listing remarks MLS
Great Investment Opportunity on the 2 Bed 1.5 Hazelcrest Townhome. Same square footage as 3 or 4 bedroom Hazelcrest Townhomes, but with Oversized 2 Bedroom Layout instead - perfect for 2 Roommates. Fantastic Layout with Living, Kitchen/Dining, and 1.5 Bath/Laundry Area on 1st Floor, and 2 bedrooms and Full Bath on 2nd Floor. Property is Tenant Occupied and on lease until Feb 2027.
Key facts
- $396 HOA
- Built 1965
- Listed 236 days
Neighborhood map
What this means for you Summary
Snapshot
- This is a 2-bed/1.5-bath condo listed at $79k.
Deal economics
- At list price, monthly cash flow is $193 ($2k/yr) — positive.
- The deal already cash-flows at list — no discount required.
- Meets the 1% rule at list price ($1k rent vs $79k).
- Recommended offer: $70k (12.0% below list) — sets the bar for market timing.
- Cap rate 9.2% vs local median 7.2% in Hazelwood — meaningfully above typical; check what's discounted (condition, days-on-market, listing class) to confirm the premium yield is real.
Location & tenants
- Location reads 62/100 on livability (#395 in MO) — a middle-class / working-renter tenant base. Strengths: cost of living A+, housing A+; Watch: schools D-, crime F, amenities F.
- Ferguson-Florissant R-II (suburban): math 7% / reading 20% proficiency, ranked #311 of 324 in MO (top 96%) — low school quality limits family demand, transient renter base, plan for 1-2y turnover; 70% free/reduced lunch — lower-income household profile, screen leases tightly.
- Market conditions: Rents rising fast (+4.5%/yr); 68 active listings in the ZIP; 32 comparable units currently listed for rent nearby; rentals at typical pace (median 20d on market — plan ~3-4 weeks tenant-placement turnaround); 920 units permitted in St. Louis County in 2024 (250 in 5+ unit buildings).
- This rent runs 34% of the median local income ($49k/yr) — at the standard rent-burdened threshold; future hikes will face affordability resistance.
Forward outlook
- Local home prices are declining (-3.0%/yr); year-one equity from $546 of loan paydown is wiped out by about $2k of value loss. Plan a longer hold.
- At projected returns (-3.0% appreciation + 4.5% rent growth), your $22k cash investment doubles in ~9 years — after that, you're playing with house money.
Negotiation context
- It's been on market 236 days — a 12% lower offer ($70k) is reasonable based on typical stale-listing flexibility.
- 2 sale attempts with the ask held roughly flat each time — persistent listings suggest the price (not the market) is what's stuck; bring a comps-based counter.
- Current owner paid $44k; list at $79k implies a 79% gain — meaningful room to come down on a strong offer.
Risks & watch-outs
- Watch-outs: HOA is 29% of rent.
- Climate carrying-cost: extreme-heat days projected 7→22/yr by 2055 (HVAC capex compounding) — expect insurance premiums to compound above CPI over the hold.
Questions for the listing agent
- It's been on market 236 days. Have you received any prior offers? Is the seller open to a 12% concession, seller financing, or rate buy-down credit?
- Built in 1965 — when were the roof, HVAC, electrical panel, plumbing, and water heater last replaced?
- What does the HOA fee cover, when was the last increase, and are there any pending special assessments or reserve-fund shortfalls?
- Any open or pending special assessments — roof, HVAC, plumbing, elevator, façade? What's the per-unit balance and payoff schedule, and is the seller paying it off at close or rolling it to the buyer?
- Why hasn't it sold? Are there any deal-killer items the seller is aware of (foundation, flood, title, zoning, code violations)?
- Is there a deadline driving the sale (1031 exchange, divorce, estate, relocation)? That informs how much negotiation room exists.
- Schools are D-rated, which usually means shorter tenancies and higher turnover. Who's the typical renter profile here, and what's been the actual vacancy rate?
- Crime grade is F in this area — have there been break-ins, vandalism, or insurance claims at this property in the last 3 years? What carrier currently insures it and at what premium?
- What's the average days-on-market for RENTAL listings here right now (not sales)? A rising rental-DOM trend means longer vacancies and softer asking-rent achievability than the comps imply.
- What's the recent tenant-quality profile in this submarket — average credit score on applications, eviction rate, late-payment / NSF rate, and stable-employment percentage? A property-management company in the area should have these aggregated.
- How much new apartment / multifamily construction is in the pipeline within 1–3 miles? Heavy new supply (>2% of stock underway) typically softens rents 12–24 months out; light construction supports rent growth.
Investment metrics
- 1% rule
- 1.75% ✓
- Cap rate
- 9.22%
- Cash-on-cash
- 10.46%
- DSCR
- 1.47
- GRM
- 4.8
CMA / ARV
- ARV (median comp)
- $76,972
- List price
- $79,000
- Delta
- 2.63%
- Verdict
- FAIR
- Comps
- 20 within 1.0 mi
Projected returns pro-forma
-3.0% appreciation · 4.45% rent growth · sell at horizon
- IRR
- 2.0%
- Equity multiple
- 1.08×
- Total profit
- $1,764
- Equity at exit
- $11,779
- IRR
- 13.8%
- Equity multiple
- 2.22×
- Total profit
- $26,980
- Equity at exit
- $6,830
Cash invested: $22,120 (down + closing). Projections, not guarantees.
Landlord ↔ Tenant lean methodology
- Overall (STATE)
- 81 Strongly Landlord-Friendly
- State Missouri
- 81 Strongly Landlord-Friendly · R+10
- County
- — inherits STATE
- City
- — inherits STATE
ZIP-level market 63042
- Rents YoY
- 4.5%
- Active inventory
- 68
- Price-to-rent
- 4.8×
Monthly cashflow live
- Estimated rent
- $1,385 high interval (Pro) →
- Mortgage (P&I)
- −$414
- Tax from tax record
- −$58 /mo · $699/yr
- Insurance
- −$33
- HOA
- −$396
- Vacancy / Maint / Mgmt
- −$291
- Net cashflow
- $193
Break-even live
UW: 25.0% down · 7.5% · 30yr · 1.5% tax · 5.0% vac · 8.0% maint · 8.0% mgmt
Financing live
Cash to close
- Down payment
- $19,750
- Closing costs
- $2,370
- Reserves months
- —
- Total cash needed
- —
Loan-product check · same deal, 3 products live
Conventional
25% down · 7.5% · 30yr
- Down + closing
- —
- Monthly P&I
- —
- Monthly cashflow
- —
- DSCR
- —
- Eligible?
- —
Personal DTI + credit; lowest rate.
DSCR
20% down · 8.5% · 30yr
- Down + closing
- —
- Monthly P&I
- —
- Monthly cashflow
- —
- DSCR
- —
- Eligible?
- —
No personal income docs; deal must DSCR.
Hard money
10% down · 12.0% · 12mo
- Down + closing
- —
- Monthly P&I
- —
- Monthly cashflow
- —
- DSCR
- —
- Eligible?
- —
Short-term bridge; refi at stabilization.
Rent comps 32 comps
| Address | Beds | Baths | Sqft | Rent | $/sqft | DOM | Units | Dist |
|---|---|---|---|---|---|---|---|---|
| 7437 Hazelcrest Dr Unit H Hazelwood, MO | 3.0 | 1.0 | 1000 | $1,000 | $1.00 | 7d | 1 | 0.18mi |
| 240 Chez Vant Ct Hazelwood, MO | 2.0 | 1.5 | 1440 | $1,350 | $0.94 | 43d | 1 | 0.22mi |
| 16 Mary Rose Ct Hazelwood, MO | 3.0 | 2.0 | 1506 | $1,706 | $1.13 | 14d | 1 | 0.40mi |
| 116 Graham Rd Florissant, MO | 3.0 | 2.0 | 1578 | $1,495 | $0.95 | 1d | 1 | 0.65mi |
| 14 Bruce Dr Unit Bruce 14-4 Florissant, MO | 2.0 | 1.0 | 880 | $975 | $1.11 | 43d | 1 | 0.78mi |
| 13 Bruce Dr Unit Bruce 13-2 Florissant, MO | 2.0 | 1.0 | 880 | $975 | $1.11 | 43d | 1 | 0.79mi |
| 13 Bruce Dr Florissant, MO | 2.0 | 1.0 | 880 | $975 | $1.11 | 23d | 1 | 0.79mi |
| 8507 Tally Ho Dr Hazelwood, MO | 2.0 | 1.5 | 1478 | $1,300 | $0.88 | 43d | 5 | 0.81mi |
| 446 Olian Dr Hazelwood, MO | 2.0 | 1.0 | 880 | $975 | $1.11 | 1d | 1 | 0.81mi |
| 785 Florland Dr Florissant, MO | 3.0 | 1.0 | 1100 | $1,700 | $1.55 | 17d | 1 | 0.86mi |
| 17 Valley Dr Florissant, MO | 2.0 | 2.0 | 1356 | $1,525 | $1.12 | 43d | 1 | 0.93mi |
| 858 Hazelvalley Dr Hazelwood, MO | 3.0 | 1.5 | 912 | $1,450 | $1.59 | 43d | 1 | 0.95mi |
| 532 Holiday Ave Hazelwood, MO | 3.0 | 1.0 | 912 | $1,350 | $1.48 | 43d | 1 | 1.16mi |
| 1180 S New Florissant Rd Florissant, MO | 3.0 | 1.0 | 925 | $1,225 | $1.32 | 23d | 1 | 1.17mi |
| 1280 Saint Catherine St Florissant, MO | 3.0 | 1.0 | 1274 | $1,600 | $1.26 | 14d | 1 | 1.18mi |
| 5 Santa Cruz Dr Florissant, MO | 2.0 | 1.0 | 1410 | $1,411 | $1.00 | 16d | 1 | 1.19mi |
| 537 Lynn Haven Ln Hazelwood, MO | 3.0 | 2.0 | 1242 | $1,675 | $1.35 | 23d | 1 | 1.20mi |
| 1250 S New Florissant Rd Florissant, MO | 2.0 | 1.0 | 1150 | $1,500 | $1.30 | 14d | 1 | 1.23mi |
| 508 Saratoga Ln Hazelwood, MO | 3.0 | 1.0 | 988 | $1,306 | $1.32 | 23d | 1 | 1.24mi |
| 1545 Washington St Florissant, MO | 3.0 | 1.5 | 1337 | $2,055 | $1.54 | 2d | 1 | 1.26mi |
| 1600 Washington St Florissant, MO | 3.0 | 1.5 | 1095 | $1,250 | $1.14 | 20d | 1 | 1.27mi |
| 17 Elwood Ct Florissant, MO | 3.0 | 2.0 | 1572 | $1,945 | $1.24 | 1d | 1 | 1.28mi |
| 7025 Richwood Ln Hazelwood, MO | 3.0 | 1.0 | 936 | $1,375 | $1.47 | 17d | 1 | 1.30mi |
| 221 Barto Dr Saint Louis, MO | 3.0 | 2.0 | 958 | $1,295 | $1.35 | 20d | 1 | 1.30mi |
| 623 Holiday Ave Hazelwood, MO | 3.0 | 2.0 | 1176 | $1,591 | $1.35 | 12d | 1 | 1.40mi |
| 1465 W Duchesne Dr Florissant, MO | 3.0 | 1.0 | 896 | $1,500 | $1.67 | 43d | 1 | 1.40mi |
| 1725 Saint Catherine St Florissant, MO | 3.0 | 1.0 | 1107 | $1,800 | $1.63 | 14d | 1 | 1.41mi |
| 263 Sadonia Ave Saint Louis, MO | 3.0 | 2.0 | 888 | $1,350 | $1.52 | 43d | 1 | 1.42mi |
| 297 Saint Eugene Ln Florissant, MO | 2.0 | 1.0 | 1100 | $1,100 | $1.00 | 43d | 1 | 1.43mi |
| 20 Saint Benedict Ln Florissant, MO | 3.0 | 1.5 | 1092 | $1,525 | $1.40 | 20d | 1 | 1.44mi |
| 4 Sharon Ct Florissant, MO | 3.0 | 2.0 | 1108 | $1,800 | $1.62 | 2d | 1 | 1.44mi |
| 260 Sadonia Ave Saint Louis, MO | 3.0 | 2.0 | 1088 | $1,623 | $1.49 | 20d | 1 | 1.45mi |
HOA detail condo
- Monthly dues
- $396 · $4,752/yr
- Assessments
- None detected in remarks — confirm with the listing agent.
Listing history 24 events
-
2026-06-18days on market $79,000 Active 236 DOM
-
2026-06-17days on market $79,000 Active 235 DOM
-
2026-06-16days on market $79,000 Active 234 DOM
-
2026-06-15days on market $79,000 Active 233 DOM
-
2026-06-13days on market $79,000 Active 231 DOM
-
2026-06-13days on market $79,000 Active 230 DOM
-
2026-06-09days on market $79,000 Active 227 DOM
-
2026-06-08days on market $79,000 Active 226 DOM
-
2026-06-07days on market $79,000 Active 225 DOM
-
2026-06-05days on market $79,000 Active 222 DOM
-
2026-06-03days on market $79,000 Active 221 DOM
-
2026-06-02days on market $79,000 Active 220 DOM
-
2026-06-01days on market $79,000 Active 219 DOM
-
2026-05-31days on market $79,000 Active 218 DOM
-
2026-02-16status Active 386-char remark
Show marketing remark (386 chars)
Great Investment Opportunity on the 2 Bed 1.5 Hazelcrest Townhome. Same square footage as 3 or 4 bedroom Hazelcrest Townhomes, but with Oversized 2 Bedroom Layout instead - perfect for 2 Roommates. Fantastic Layout with Living, Kitchen/Dining, and 1.5 Bath/Laundry Area on 1st Floor, and 2 bedrooms and Full Bath on 2nd Floor. Property is Tenant Occupied and on lease until Feb 2027.
-
2026-02-16price $79,000 386-char remark
Show marketing remark (386 chars)
Great Investment Opportunity on the 2 Bed 1.5 Hazelcrest Townhome. Same square footage as 3 or 4 bedroom Hazelcrest Townhomes, but with Oversized 2 Bedroom Layout instead - perfect for 2 Roommates. Fantastic Layout with Living, Kitchen/Dining, and 1.5 Bath/Laundry Area on 1st Floor, and 2 bedrooms and Full Bath on 2nd Floor. Property is Tenant Occupied and on lease until Feb 2027.
-
2025-10-09$80,000 Active 386-char remark
Show marketing remark (386 chars)
Great Investment Opportunity on the 2 Bed 1.5 Hazelcrest Townhome. Same square footage as 3 or 4 bedroom Hazelcrest Townhomes, but with Oversized 2 Bedroom Layout instead - perfect for 2 Roommates. Fantastic Layout with Living, Kitchen/Dining, and 1.5 Bath/Laundry Area on 1st Floor, and 2 bedrooms and Full Bath on 2nd Floor. Property is Tenant Occupied and on lease until Feb 2027.
-
2025-10-03historical $80,000 386-char remark
Show marketing remark (386 chars)
Great Investment Opportunity on the 2 Bed 1.5 Hazelcrest Townhome. Same square footage as 3 or 4 bedroom Hazelcrest Townhomes, but with Oversized 2 Bedroom Layout instead - perfect for 2 Roommates. Fantastic Layout with Living, Kitchen/Dining, and 1.5 Bath/Laundry Area on 1st Floor, and 2 bedrooms and Full Bath on 2nd Floor. Property is Tenant Occupied and on lease until Feb 2027.
-
2021-04-06soldstatus $44,130
-
2002-05-22soldstatus $53,000
-
2000-11-01soldstatus $47,500
-
1997-11-13soldstatus $43,900
-
1992-05-22soldstatus $37,000
-
1989-04-01soldstatus
ⓘ Source: listings_history table (triggers on properties + properties_extension) + one-shot
backfill from property_details.listing_events for pre-trigger history.
Tax reassessment forecast MO · Resets to sale price
- Current annual tax
- $699 · $58/mo
- Projected year-2 tax
- $766 · $64/mo
- Expected delta
- +$67/yr (+$6/mo · 9.6%)
ⓘ Screening estimate from a state-policy table — verify with the county assessor before closing.
Climate risk First Street
- Flood 4/10 Moderate FEMA zone X (unshaded) · 20% chance over 30 yrs
- Wildfire 1/10 Low
- Heat 5/10 Major 7 d/yr ≥105°F today · 22 d/yr by 30 yrs out
- Wind 2/10 Low 100% chance of damaging wind over 30 yrs
- Air quality 3/10 Moderate 3 unhealthy d/yr today · 5 by 30 yrs out
Nearby sold comps map
Loading sold comps map…
Walkable amenities ~0.75 mi
Loading nearby amenities…
Taxation est. · year 1
- Rental income
- $16,621
- − Mortgage interest
- −$4,425
- − Property taxes
- −$699
- − Insurance
- −$395
- − Repairs & maintenance
- −$1,330
- − Management
- −$1,330
- − HOA
- −$4,752
- − Depreciation
- −$2,298
- Taxable income
- $1,392
- Est. tax owed @ 24.0%
- −$334
- After-tax cash flow
- $1,979/yr
For passive investors: Depreciation is non-cash, so a rental often shows a tax loss while cash-flowing — sheltering income. Rental losses are passive: they offset passive income freely, and up to $25,000/yr can offset ordinary (W-2) income if you actively participate and your MAGI is under $100k (phasing out to $0 by $150k); unused losses carry forward. On sale, claimed depreciation is recaptured at up to 25%, and gains may owe capital-gains tax (a 1031 exchange can defer both). Figures are a year-1 estimate at your 24.0% rate — not tax advice; consult a CPA.
Schools (NCES district)
- District
- Ferguson-Florissant R-II
- NCES district ID
- 2912010
- Math proficiency
- 7% ▼ -9.00%
- Reading proficiency
- 20% ▼ -6.00%
- Median HH income
- $44,610
- Composite
- 11.96/100
- National rank
- #9666
- State rank
- #311 of 324 in MO
Livability — Hazelwood
- Score
- 62/100
- State rank
- #395
- US rank
- #16956
Category grades
Schools grade is shown separately in the Schools card above.
Census & demographics
- Census place
- Hazelwood, MO
- County
- Saint Louis County · 888,823 people
- City population
- 17,813
- Metro
- St. Louis, MO-IL
- Population (ZIP)
- 17,813
- Household income
- $49,453
- Rent vs Own
- Severe rent burden
- 766.0
Population outlook (St. Louis County) Hauer SSP2
- Today (2025)
- 1,025,227 people
- By 2030
- 1,028,023 · +0.3%
- By 2040
- 1,020,940 · -0.4%
- By 2050
- 1,007,280 · -1.8%
- By 2075
- 987,277 · -3.7%
- By 2100
- 921,984 · -10.1%
Race, ethnicity, and origin ACS 2023
- Neighborhood character
- Diverse neighborhood (Simpson 0.64)
- Race & ethnicity
- White 46% Black 38% Two or more races 10% Hispanic / Latino 4% Asian 2%
- Common ancestry
- Lithuanian 3% Romanian 1% Italian 1%
- Foreign-born
- 5% · Canada, Vietnam
- Languages at home
- 94% English-only · Spanish 3% Vietnamese 1% Tagalog/Filipino 1%
Political lean MEDSL · St. Louis
- 2024 margin
- Strong D (+23.4) · D 60.8% · R 37.4% · Other 1.7%
- 2008→2024 swing
- +3.5pp toward D · 2008: 19.9pp · 2024: 23.4pp
- All cycles
- 2024: D+23.4 2020: D+24.0 2016: D+16.2 2012: D+13.7 2008: D+19.9
Not yet ingested
- Civics
- —
Market trends
- HPI YoY
- ▼ -204.48%
- Current HPI
- 234.7353
- Rent YoY
- ▲ 4.45%
- Metro
- St. Louis, MO-IL
- State GDP YoY
- ▲ 1.84%
- F500 in state
- 20
Industry mix (Fortune 500 HQ in MO)
| Industry | F500 HQs | Revenue |
|---|---|---|
| Healthcare | 1 | $163B |
|
||
| Insurance | 1 | $21B |
|
||
| Industrial Technology | 1 | $17B |
|
||
| Retail | 1 | $16B |
|
||
| Industrial Distribution | 1 | $10B |
|
||
| Utilities | 1 | $9B |
|
||
Price history
+113.5% since first listed10 events — show timeline
- 2026-02-16 Relisted — MARIS as Distributed by MLS Grid
- 2026-02-16 Price Changed $79,000 MARIS as Distributed by MLS Grid
- 2025-10-09 Listed $80,000 MARIS as Distributed by MLS Grid
- 2025-10-03 Coming Soon $80,000 MARIS as Distributed by MLS Grid
- 2021-04-06 Sold (Public Records) $44,130 Public Records
- 2002-05-22 Sold (Public Records) $53,000 Public Records
- 2000-11-01 Sold (Public Records) $47,500 Public Records
- 1997-11-13 Sold (Public Records) $43,900 Public Records
- 1992-05-22 Sold (Public Records) $37,000 Public Records
- 1989-04-01 Sold (Public Records) — Public Records
Property tax history
-2.7%/yrLatest (2022): $699 · +0.6% YoY. Source: county tax records.
Cash-flow waterfall
monthlySold comps — $/sqft
last 12 mo · ≤1 miLoading sold comps…