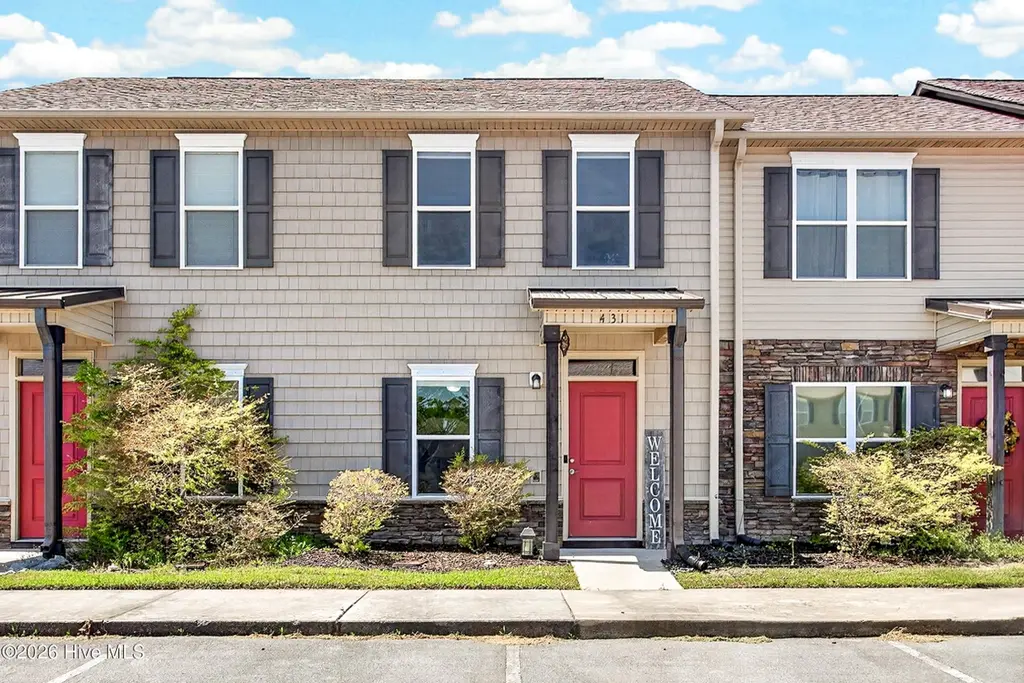
431 Sullivan Loop Rd · Piney Green, NC
Flood risk 1/10 · Minimal
- FEMA flood zone
- X (unshaded)
- Chance of flooding over 30 yrs
- 0.0%
- Est. flood insurance / yr
- $507 – $1,088
Fire risk 5/10 · Moderate
- Est. fire insurance / yr
- $906 – $1,684
Heat risk 8/10 · Major
- Hot days now (above 106°F)
- 7 days/yr
- Hot days in 30 yrs
- 19 days/yr
Wind risk 8/10 · Major
- Chance of severe wind over 30 yrs
- 99.0%
Air-quality risk 2/10 · Minimal
- Unhealthy air days now
- 1 days/yr
- Unhealthy air days in 30 yrs
- 3 days/yr
Risk factors via First Street. Map © Google.
Why this score? — see what drove the D grade
The composite is a weighted blend of 9 inputs, each scored 0–100. Each bar is that input's sub-score; the figure is the points it added to the 100-point composite (weight × sub-score).
- Appreciation +9.1/10.0
- ARV discount +9.0/15.0
- Cash flow +8.1/30.0
- Schools +3.9/10.0
- Livability +3.0/5.0
- Rent growth +2.9/5.0
- Condition / age +2.5/5.0
- DSCR +2.1/10.0
- 1% rule +1.8/10.0
$180,000
🖨 Deal sheet (PDF) 📄 Offer letter ✓ Due diligence
Listing remarks MLS
Brand new 2 bedroom 1.5 bath townhouse featuring the Spirit Floor Plan. Home features include LVP flooring on the entire first floor, upgraded egg shell paint, ceiling fans in living room and Master bedroom. Kitchen comes equipped with appliances to include the refrigerator. Laundry is upstairs and exterior has stone accents and vinyl fencing in backyard.
Key facts
- Patio pavers
- Fenced yard
- $54 HOA
Tags
Property features AI
Finance
- Other: Subdivision: Boyington Place; Directions: Highway 24 toward Hubert, 3rd U-turn after Piney Green, Boyington Place will be on your right.
- HOA & community: Homeowners association with management; HOA fee $650 annually (approx. $54.17/month)
Exterior
- Parking: Assigned parking; Paved parking
- Utilities: Public water; Sewer connected; Water connected
- Home design: Residential townhouse; Two levels; Entry level: 1; R-8M zoning
- Construction: Vinyl siding; Stone veneer; Frame construction; Slab foundation; Built with shingle roof
- Exterior features: Patio; Back yard fencing; Vinyl fencing; Shingle roof; Has a view; Paved road access
Interior
- Kitchen: Refrigerator; Dishwasher; Electric range; Microwave; Electric water heater
- Bedrooms: 4 total rooms
- Bathrooms: 1 full bathroom; 1 half bathroom
- Heating & cooling: Heat pump heating; Electric heating; Central air conditioning
- Interior features: Ceiling fan(s); Unfurnished
- Laundry & utility: Washer hookup; Laundry closet
Neighborhood map
What this means for you Summary
Snapshot
- This is a 2-bed/1.5-bath townhouse listed at $180k.
Deal economics
- At list price, monthly cash flow is $-178 ($-2k/yr) — negative.
- To cash-flow at today's rent, offer at most $149k (17.4% below list).
- To meet the 1% rule (rent ≥ 1% of price), the offer needs to be $123k (31.9% below list).
- Recommended offer: $123k (31.9% below list) — sets the bar for 1% rule.
- Cap rate 5.1% vs local median 3.6% in Piney Green — top-decile yield for the area; either an underpriced asset or a hidden risk that comps aren't pricing in. Stress-test before assuming the spread holds.
Location & tenants
- Location reads 60/100 on livability (#524 in NC) — a middle-class / working-renter tenant base. Strengths: cost of living A+, housing A+; Watch: crime D+, employment D+, amenities F.
- Onslow County Schools (other): math 42% / reading 49% proficiency, ranked #84 of 178 in NC (top 47%) — families likely to look elsewhere, expect single-tenant / working-renter base with shorter leases.
- Zoned schools: Queens Creek Elementary (math 46% / reading 59%, grade C-, #349 of 1,410 statewide, top 25%, 751 students, 52% FRL); Swansboro Middle (math 52% / reading 55%, grade C+, #87 of 475 statewide, top 19%, 967 students, 43% FRL); Swansboro High (math 77% / reading 68%, grade B+, #104 of 535 statewide, top 19%, 1,115 students, 38% FRL).
- Zoned-school proficiency averages 60% at this address vs 46% district-wide (+14 pts) — the actual schools serving this property are materially stronger than the Onslow County Schools average implies; a family-tenant draw the district grade alone would hide.
- Market conditions: Rents rising (+1.4%/yr); 31 active listings in the ZIP; 2 comparable units currently listed for rent nearby; 1,246 units permitted in Onslow County in 2024 (0 in 5+ unit buildings).
Forward outlook
- In year one you build about $16k of equity ($1k loan paydown + $15k appreciation (8.2% local appreciation)).
- By year 3, paydown + projected appreciation supports a ~$40k cash-out refi (75% LTV) — recoverable capital for the next deal without selling this one.
Negotiation context
- It's been on market 59 days — a 3% lower offer ($175k) is reasonable based on typical stale-listing flexibility.
- 2 sale attempts since 7y ago with the ask held roughly flat each time — persistent listings suggest the price (not the market) is what's stuck; bring a comps-based counter.
- Current owner paid $119k; list at $180k implies a 51% gain — meaningful room to come down on a strong offer.
Risks & watch-outs
- Climate carrying-cost: severe wind risk, 99% chance of damaging wind over 30y; moderate wildfire risk; extreme-heat days projected 7→19/yr by 2055 (HVAC capex compounding) — expect insurance premiums to compound above CPI over the hold.
Questions for the listing agent
- What do current leases actually rent for vs. the listed asking? Can we see a recent rent roll and the last 12 months of T-12 income?
- It's been on market 59 days. Have you received any prior offers? Is the seller open to a 32% concession, seller financing, or rate buy-down credit?
- What does the HOA fee cover, when was the last increase, and are there any pending special assessments or reserve-fund shortfalls?
- Is there a deadline driving the sale (1031 exchange, divorce, estate, relocation)? That informs how much negotiation room exists.
- Schools are F-rated, which usually means shorter tenancies and higher turnover. Who's the typical renter profile here, and what's been the actual vacancy rate?
- Crime grade is D in this area — have there been break-ins, vandalism, or insurance claims at this property in the last 3 years? What carrier currently insures it and at what premium?
- The area grade is low — what's the realistic commute time and amenity access for the typical tenant pool here? Any planned neighborhood developments (good or bad) we should know about?
- What's the average days-on-market for RENTAL listings here right now (not sales)? A rising rental-DOM trend means longer vacancies and softer asking-rent achievability than the comps imply.
- What's the recent tenant-quality profile in this submarket — average credit score on applications, eviction rate, late-payment / NSF rate, and stable-employment percentage? A property-management company in the area should have these aggregated.
- How much new for-sale + rental construction is in the pipeline within 1–3 miles? Heavy new supply typically softens prices + rents 12–24 months out; constrained supply supports both.
Investment metrics
- 1% rule
- 0.68% ✗
- Cap rate
- 5.11%
- Cash-on-cash
- -4.23%
- DSCR
- 0.81
- GRM
- 12.2
CMA / ARV
- ARV (on-the-fly)
- $186,368
- Comps found
- 5
Show comp detail 5 sales within ~0.75 mi
| Address | Dist | Beds/Ba | Sqft | Sold | Price | $/sf | Match |
|---|---|---|---|---|---|---|---|
| 408 Sullivan Loop Rd | 0.04mi | 2/1.5 | 985 (-4%) | 10mo | $173,000 | $176 | 83 |
| 409 Sullivan Loop Rd | 0.04mi | 2/1.5 | 960 (-6%) | 10mo | $175,000 | $182 | 79 |
| 427 Sullivan Loop Rd | 0.01mi | 2/1.5 | 960 (-6%) | 17mo | $180,000 | $188 | 75 |
| 421 Sullivan Loop Rd | 0.02mi | 2/1.5 | 960 (-6%) | 19mo | $173,000 | $180 | 73 |
| 475 Sullivan Loop Rd | 0.09mi | 2/2.5 | 1,064 (+4%) | 15mo | $198,000 | $186 | 72 |
Match score weights: distance 35% · size 25% · config 20% · recency 20%. Top-matched comps best support the ARV.
Projected returns pro-forma
8.15% appreciation · 1.43% rent growth · sell at horizon
- IRR
- 16.7%
- Equity multiple
- 2.24×
- Total profit
- $62,571
- Equity at exit
- $138,547
- IRR
- 15.7%
- Equity multiple
- 4.70×
- Total profit
- $186,232
- Equity at exit
- $276,744
Cash invested: $50,400 (down + closing). Projections, not guarantees.
Landlord ↔ Tenant lean methodology
- Overall (STATE)
- 85 Strongly Landlord-Friendly
- State North Carolina
- 85 Strongly Landlord-Friendly · R+3
- County
- — inherits STATE
- City
- — inherits STATE
ZIP-level market 28544
- Home prices YoY
- 4.2%
- Rents YoY
- 1.4%
- Active inventory
- 31
- Price-to-rent
- 12.2×
Monthly cashflow live
- Estimated rent
- $1,227 medium interval (Pro) →
- Mortgage (P&I)
- −$944
- Tax from tax record
- −$74 /mo · $885/yr
- Insurance
- −$75
- HOA
- −$54
- Vacancy / Maint / Mgmt
- −$258
- Net cashflow
- $-178
Break-even live
Sensitivity live
| Price | -10% $-76 | -5% $-127 | +0% $-178 | +5% $-229 | +10% $-280 |
|---|---|---|---|---|---|
| Rent | -10% $-275 | -5% $-226 | +0% $-178 | +5% $-129 | +10% $-81 |
| Rate | -1.0pp $-87 | -0.5pp $-132 | base $-178 | +0.5pp $-224 | +1.0pp $-272 |
UW: 25.0% down · 7.5% · 30yr · 1.5% tax · 5.0% vac · 8.0% maint · 8.0% mgmt
Financing live
Cash to close
- Down payment
- $45,000
- Closing costs
- $5,400
- Reserves months
- —
- Total cash needed
- —
Loan-product check · same deal, 3 products live
Conventional
25% down · 7.5% · 30yr
- Down + closing
- —
- Monthly P&I
- —
- Monthly cashflow
- —
- DSCR
- —
- Eligible?
- —
Personal DTI + credit; lowest rate.
DSCR
20% down · 8.5% · 30yr
- Down + closing
- —
- Monthly P&I
- —
- Monthly cashflow
- —
- DSCR
- —
- Eligible?
- —
No personal income docs; deal must DSCR.
Hard money
10% down · 12.0% · 12mo
- Down + closing
- —
- Monthly P&I
- —
- Monthly cashflow
- —
- DSCR
- —
- Eligible?
- —
Short-term bridge; refi at stabilization.
Rent comps 2 comps
| Address | Beds | Baths | Sqft | Rent | $/sqft | DOM | Units | Dist |
|---|---|---|---|---|---|---|---|---|
| 134 Littleton St Midway Park, NC | 2.0 | 1.0 | 840 | $950 | $1.13 | 15d | 1 | 0.74mi |
| 1000 Yorktown Ln Jacksonville, NC | 1.0 | 1.0 | 936 | $1,300 | $1.39 | 23d | 1 | 1.13mi |
HOA detail
- Monthly dues
- $54 · $648/yr
Listing history 21 events
-
2026-06-21days on market $180,000 Active 59 DOM
-
2026-06-19days on market $180,000 Active 57 DOM
-
2026-06-18days on market $180,000 Active 56 DOM
-
2026-06-17days on market $180,000 Active 55 DOM
-
2026-06-16days on market $180,000 Active 54 DOM
-
2026-06-15days on market $180,000 Active 53 DOM
-
2026-06-14days on market $180,000 Active 51 DOM
-
2026-06-13pricedays on market $180,000 Active 50 DOM
-
2026-06-10days on market $184,000 Active 48 DOM
-
2026-06-09days on market $184,000 Active 47 DOM
-
2026-06-09days on market $184,000 Active 46 DOM
-
2026-06-07days on market $184,000 Active 45 DOM
-
2026-06-03days on market $184,000 Active 41 DOM
-
2026-06-02days on market $184,000 Active 40 DOM
-
2026-06-01days on market $184,000 Active 39 DOM
-
2026-05-31days on market $184,000 Active 38 DOM
-
2026-05-30days on market $184,000 Active 37 DOM
-
2026-05-21price $184,000
-
2026-04-23$185,000 Active
-
2019-08-21soldstatus $118,900 357-char remark
Show marketing remark (357 chars)
Brand new 2 bedroom 1.5 bath townhouse featuring the Spirit Floor Plan. Home features include LVP flooring on the entire first floor, upgraded egg shell paint, ceiling fans in living room and Master bedroom. Kitchen comes equipped with appliances to include the refrigerator. Laundry is upstairs and exterior has stone accents and vinyl fencing in backyard.
-
2019-07-29$118,900 357-char remark
Show marketing remark (357 chars)
Brand new 2 bedroom 1.5 bath townhouse featuring the Spirit Floor Plan. Home features include LVP flooring on the entire first floor, upgraded egg shell paint, ceiling fans in living room and Master bedroom. Kitchen comes equipped with appliances to include the refrigerator. Laundry is upstairs and exterior has stone accents and vinyl fencing in backyard.
ⓘ Source: listings_history table (triggers on properties + properties_extension) + one-shot
backfill from property_details.listing_events for pre-trigger history.
Tax reassessment forecast NC · Resets to sale price
- Current annual tax
- $885 · $74/mo
- Projected year-2 tax
- $1,476 · $123/mo
- Expected delta
- +$591/yr (+$49/mo · 66.7%)
ⓘ Screening estimate from a state-policy table — verify with the county assessor before closing.
Climate risk First Street
- Flood 1/10 Low FEMA zone X (unshaded) · 0% chance over 30 yrs
- Wildfire 5/10 Major
- Heat 8/10 Severe 7 d/yr ≥106°F today · 19 d/yr by 30 yrs out
- Wind 8/10 Severe 99% chance of damaging wind over 30 yrs
- Air quality 2/10 Low 1 unhealthy d/yr today · 3 by 30 yrs out
Nearby sold comps map
Loading sold comps map…
Walkable amenities ~0.75 mi
Loading nearby amenities…
Taxation est. · year 1
- Rental income
- $14,719
- − Mortgage interest
- −$10,083
- − Property taxes
- −$885
- − Insurance
- −$900
- − Repairs & maintenance
- −$1,178
- − Management
- −$1,178
- − HOA
- −$648
- − Depreciation
- −$5,236
- Taxable loss
- −$5,388
- Est. tax savings @ 24.0%
- +$1,293
- After-tax cash flow
- $-839/yr
For passive investors: Depreciation is non-cash, so a rental often shows a tax loss while cash-flowing — sheltering income. Rental losses are passive: they offset passive income freely, and up to $25,000/yr can offset ordinary (W-2) income if you actively participate and your MAGI is under $100k (phasing out to $0 by $150k); unused losses carry forward. On sale, claimed depreciation is recaptured at up to 25%, and gains may owe capital-gains tax (a 1031 exchange can defer both). Figures are a year-1 estimate at your 24.0% rate — not tax advice; consult a CPA.
Schools (NCES district)
- District
- Onslow County Schools
- NCES district ID
- 3703450
- Math proficiency
- 42% ▲ 6.00%
- Reading proficiency
- 49% ▲ 5.00%
- Median HH income
- $46,076
- Composite
- 38.66/100
- National rank
- #4148
- State rank
- #84 of 178 in NC
Livability — Piney Green
- Score
- 60/100
- State rank
- #524
- US rank
- #19401
Category grades
Schools grade is shown separately in the Schools card above.
Census & demographics
- County
- Onslow County · 164,453 people
- Metro
- Jacksonville, NC
- Population (ZIP)
- 4,386
- Household income
- $52,354
- Rent vs Own
- Severe rent burden
- 291.0
Population outlook (Onslow County) Hauer SSP2
- Today (2025)
- 189,789 people
- By 2030
- 194,463 · +2.5%
- By 2040
- 193,629 · +2.0%
- By 2050
- 193,248 · +1.8%
- By 2075
- 196,995 · +3.8%
- By 2100
- 201,513 · +6.2%
Race, ethnicity, and origin ACS 2023
- Neighborhood character
- Highly diverse neighborhood (Simpson 0.73)
- Race & ethnicity
- White 44% Two or more races 20% Black 20% Hispanic / Latino 20%
- Hispanic origin (detail)
- Mexican 8%
- Common ancestry
- Serbian 3% Romanian 3% Scandinavian 2%
- Foreign-born
- 5% · Canada, China
- Languages at home
- 87% English-only · Spanish 11% Other Asian/Pacific 1%
Political lean MEDSL · Onslow
- 2024 margin
- Solid R (+35.9) · D 31.5% · R 67.5% · Other 1.0%
- 2008→2024 swing
- -14.5pp toward R · 2008: -21.5pp · 2024: -35.9pp
- All cycles
- 2024: R+35.9 2020: R+30.2 2016: R+34.6 2012: R+27.0 2008: R+21.5
Not yet ingested
- Civics
- —
Market trends
- HPI YoY
- ▲ 8.15%
- Current HPI
- 203.4839
- Rent YoY
- ▲ 1.43%
- Metro
- Jacksonville, NC
- State GDP YoY
- ▲ 3.28%
- F500 in state
- 26
Industry mix (Fortune 500 HQ in NC)
| Industry | F500 HQs | Revenue |
|---|---|---|
| Financial Services | 2 | $213B |
|
||
| Retail | 2 | $95B |
|
||
| Industrial Conglomerate | 1 | $38B |
|
||
| Metals / Steel | 1 | $35B |
|
||
| Utilities | 1 | $30B |
|
||
| Industrial Machinery | 1 | $19B |
|
||
Price history
+54.8% since first listed4 events — show timeline
- 2026-05-21 Price Changed $184,000 Hive MLS
- 2026-04-23 Listed $185,000 Hive MLS
- 2019-08-21 Sold (MLS) $118,900 Hive MLS
- 2019-07-29 Listed $118,900 Hive MLS
Property tax history
+30.0%/yrLatest (2025): $885 · +0.0% YoY. Source: county tax records.
Cash-flow waterfall
monthlySold comps — $/sqft
last 12 mo · ≤1 miLoading sold comps…