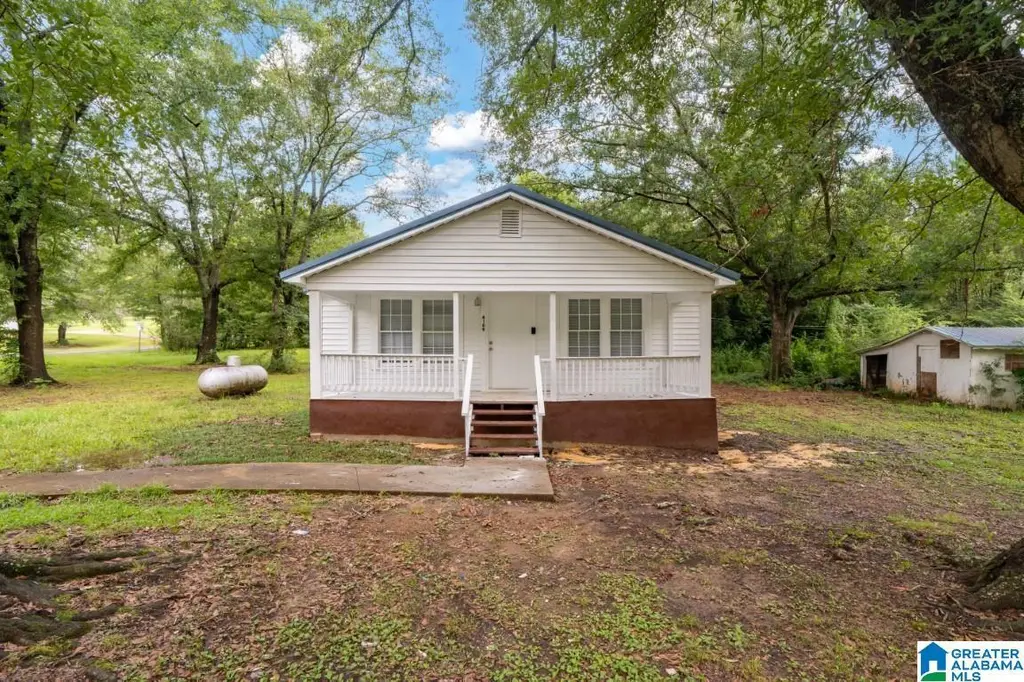
4109 Jim Tate Rd · Graysville, AL
Flood risk 1/10 · Minimal
- FEMA flood zone
- X (unshaded)
- Chance of flooding over 30 yrs
- 0.0%
- Est. flood insurance / yr
- $507 – $1,088
Fire risk 5/10 · Moderate
- Est. fire insurance / yr
- $916 – $1,700
Heat risk 6/10 · Moderate
- Hot days now (above 107°F)
- 7 days/yr
- Hot days in 30 yrs
- 19 days/yr
Wind risk 6/10 · Moderate
- Chance of severe wind over 30 yrs
- 27.0%
Air-quality risk 4/10 · Minor
- Unhealthy air days now
- 5 days/yr
- Unhealthy air days in 30 yrs
- 8 days/yr
Risk factors via First Street. Map © Google.
Why this score? — see what drove the C- grade
The composite is a weighted blend of 9 inputs, each scored 0–100. Each bar is that input's sub-score; the figure is the points it added to the 100-point composite (weight × sub-score).
- ARV discount +14.8/15.0
- Cash flow +12.0/30.0
- Appreciation +10.0/10.0
- DSCR +3.5/10.0
- Livability +3.0/5.0
- Rent growth +2.5/5.0
- Condition / age +2.5/5.0
- 1% rule +2.3/10.0
- Schools +1.8/10.0
$157,300
🖨 Deal sheet (PDF) 📄 Offer letter ✓ Due diligence
Listing remarks MLS
This cozy home has so much to offer; 3 bedrooms, 2 bathrooms and lots of space, inside and out! This house was renovated (2023) with granite counter-tops, luxury flooring, newly painted, hardwood floors and so much more! This one is a MUST see!
Key facts
- 2 acre lot
- Parking
- Built 1925
Neighborhood map
What this means for you Summary
Snapshot
- This is a 2-bed/1.0-bath single-family listed at $157k.
Deal economics
- At list price, monthly cash flow is $-38 ($-460/yr) — negative.
- To cash-flow at today's rent, offer at most $151k (4.3% below list).
- To meet the 1% rule (rent ≥ 1% of price), the offer needs to be $115k (27.2% below list).
- Recommended offer: $115k (27.2% below list) — sets the bar for 1% rule.
Location & tenants
- Location reads 59/100 on livability (#321 in AL) — a working-class tenant base; expect higher turnover. Strengths: crime A+, cost of living A+, housing A+; Watch: schools F, amenities F, commute F.
- Jefferson County (suburban): math 9% / reading 32% proficiency, ranked #104 of 129 in AL (top 81%) — low school quality limits family demand, transient renter base, plan for 1-2y turnover.
- Market conditions: 78 active listings in the ZIP; 2,114 units permitted in Jefferson County in 2024 (556 in 5+ unit buildings).
Forward outlook
- In year one you build about $17k of equity ($1k loan paydown + $16k appreciation (10.0% local appreciation)).
- Jefferson County population projected to shrink 4% by 2050 — rents likely to lag national; underwrite the cash flow, not the appreciation.
- At projected returns (10.0% appreciation + 3.0% rent growth), your $44k cash investment doubles in ~3 years — after that, you're playing with house money.
- By year 3, paydown + projected appreciation supports a ~$43k cash-out refi (75% LTV) — recoverable capital for the next deal without selling this one.
Negotiation context
- It's been on market 71 days — a 6% lower offer ($148k) is reasonable based on typical stale-listing flexibility.
- 4 sale attempts since 3y ago with the ask held roughly flat each time — persistent listings suggest the price (not the market) is what's stuck; bring a comps-based counter.
Risks & watch-outs
- Watch-outs: built in 1925 — expect roof / HVAC / electrical / plumbing capex.
- Climate carrying-cost: major wind risk, 27% chance of damaging wind over 30y; moderate wildfire risk; extreme-heat days projected 7→19/yr by 2055 (HVAC capex compounding) — expect insurance premiums to compound above CPI over the hold.
Questions for the listing agent
- What do current leases actually rent for vs. the listed asking? Can we see a recent rent roll and the last 12 months of T-12 income?
- It's been on market 71 days. Have you received any prior offers? Is the seller open to a 27% concession, seller financing, or rate buy-down credit?
- Built in 1925 — when were the roof, HVAC, electrical panel, plumbing, and water heater last replaced?
- Why hasn't it sold? Are there any deal-killer items the seller is aware of (foundation, flood, title, zoning, code violations)?
- Is there a deadline driving the sale (1031 exchange, divorce, estate, relocation)? That informs how much negotiation room exists.
- Schools are F-rated, which usually means shorter tenancies and higher turnover. Who's the typical renter profile here, and what's been the actual vacancy rate?
- What's the average days-on-market for RENTAL listings here right now (not sales)? A rising rental-DOM trend means longer vacancies and softer asking-rent achievability than the comps imply.
- What's the recent tenant-quality profile in this submarket — average credit score on applications, eviction rate, late-payment / NSF rate, and stable-employment percentage? A property-management company in the area should have these aggregated.
- How much new for-sale + rental construction is in the pipeline within 1–3 miles? Heavy new supply typically softens prices + rents 12–24 months out; constrained supply supports both.
Investment metrics
- 1% rule
- 0.73% ✗
- Cap rate
- 6.00%
- Cash-on-cash
- -1.04%
- DSCR
- 0.95
- GRM
- 11.4
CMA / ARV
- ARV (median comp)
- $187,516
- List price
- $157,300
- Delta
- -16.11%
- Verdict
- UNDERPRICED
- Comps
- 8 within 1.0 mi
Projected returns pro-forma
10.0% appreciation · 3.0% rent growth · sell at horizon
- IRR
- 23.5%
- Equity multiple
- 2.89×
- Total profit
- $83,159
- Equity at exit
- $141,708
- IRR
- 20.9%
- Equity multiple
- 6.60×
- Total profit
- $246,666
- Equity at exit
- $305,599
Cash invested: $44,044 (down + closing). Projections, not guarantees.
Landlord ↔ Tenant lean methodology
- Overall (STATE)
- 90 Strongly Landlord-Friendly
- State Alabama
- 90 Strongly Landlord-Friendly · R+15
- County
- — inherits STATE
- City
- — inherits STATE
ZIP-level market 35062
- Home prices YoY
- 9.7%
- Active inventory
- 78
- Price-to-rent
- 11.4×
Monthly cashflow live
- Estimated rent
- $1,146 medium interval (Pro) →
- Mortgage (P&I)
- −$825
- Tax from tax record
- −$53 /mo · $634/yr
- Insurance
- −$66
- HOA
- −$0
- Vacancy / Maint / Mgmt
- −$241
- Net cashflow
- $-38
Break-even live
Sensitivity live
| Price | -10% $51 | -5% $6 | +0% $-38 | +5% $-83 | +10% $-127 |
|---|---|---|---|---|---|
| Rent | -10% $-129 | -5% $-84 | +0% $-38 | +5% $7 | +10% $52 |
| Rate | -1.0pp $41 | -0.5pp $2 | base $-38 | +0.5pp $-79 | +1.0pp $-121 |
UW: 25.0% down · 7.5% · 30yr · 1.5% tax · 5.0% vac · 8.0% maint · 8.0% mgmt
Financing live
Cash to close
- Down payment
- $39,325
- Closing costs
- $4,719
- Reserves months
- —
- Total cash needed
- —
Loan-product check · same deal, 3 products live
Conventional
25% down · 7.5% · 30yr
- Down + closing
- —
- Monthly P&I
- —
- Monthly cashflow
- —
- DSCR
- —
- Eligible?
- —
Personal DTI + credit; lowest rate.
DSCR
20% down · 8.5% · 30yr
- Down + closing
- —
- Monthly P&I
- —
- Monthly cashflow
- —
- DSCR
- —
- Eligible?
- —
No personal income docs; deal must DSCR.
Hard money
10% down · 12.0% · 12mo
- Down + closing
- —
- Monthly P&I
- —
- Monthly cashflow
- —
- DSCR
- —
- Eligible?
- —
Short-term bridge; refi at stabilization.
Listing history 28 events
-
2026-06-18days on market $157,300 Active 71 DOM
-
2026-06-17days on market $157,300 Active 70 DOM
-
2026-06-16days on market $157,300 Active 69 DOM
-
2026-06-15days on market $157,300 Active 68 DOM
-
2026-06-13days on market $157,300 Active 66 DOM
-
2026-06-10days on market $157,300 Active 63 DOM
-
2026-06-09days on market $157,300 Active 62 DOM
-
2026-06-08days on market $157,300 Active 61 DOM
-
2026-06-07days on market $157,300 Active 60 DOM
-
2026-06-03days on market $157,300 Active 56 DOM
-
2026-06-02days on market $157,300 Active 55 DOM
-
2026-06-01days on market $157,300 Active 54 DOM
-
2026-05-31days on market $157,300 Active 53 DOM
-
2026-04-07$157,300 Active 244-char remark
Show marketing remark (244 chars)
This cozy home has so much to offer; 3 bedrooms, 2 bathrooms and lots of space, inside and out! This house was renovated (2023) with granite counter-tops, luxury flooring, newly painted, hardwood floors and so much more! This one is a MUST see!
-
2026-03-20historical $1,175
-
2026-03-05price $1,175
-
2026-02-13price $1,190
-
2026-01-24price $1,215
-
2026-01-05price $1,240
-
2025-12-16$1,265
-
2023-12-08soldstatus $146,000
-
2023-06-16soldstatus $70,000 Sold 327-char remark
Show marketing remark (327 chars)
This 2 bedroom and 1 bath fixer upper is being sold as-is. It is located in the Bagley/Corner school district. Brand new HVAC just installed. A large covered front porch with a swing. Outside is a 2 car carport and a shed. Move in the house and build your dream house on the extra level lot. Close to school, shopping and I-22.
-
2023-05-17Contingent 327-char remark
Show marketing remark (327 chars)
This 2 bedroom and 1 bath fixer upper is being sold as-is. It is located in the Bagley/Corner school district. Brand new HVAC just installed. A large covered front porch with a swing. Outside is a 2 car carport and a shed. Move in the house and build your dream house on the extra level lot. Close to school, shopping and I-22.
-
2023-04-18$72,000 327-char remark
Show marketing remark (327 chars)
This 2 bedroom and 1 bath fixer upper is being sold as-is. It is located in the Bagley/Corner school district. Brand new HVAC just installed. A large covered front porch with a swing. Outside is a 2 car carport and a shed. Move in the house and build your dream house on the extra level lot. Close to school, shopping and I-22.
-
2022-05-11price $85,000
-
2022-05-03price $99,900
-
2009-12-18soldstatus $90,000
-
2000-07-13soldstatus $39,900
ⓘ Source: listings_history table (triggers on properties + properties_extension) + one-shot
backfill from property_details.listing_events for pre-trigger history.
Tax reassessment forecast AL · Resets to sale price
- Current annual tax
- $634 · $53/mo
- Projected year-2 tax
- $645 · $54/mo
- Expected delta
- +$11/yr (+$1/mo · 1.7%)
ⓘ Screening estimate from a state-policy table — verify with the county assessor before closing.
Climate risk First Street
- Flood 1/10 Low FEMA zone X (unshaded) · 0% chance over 30 yrs
- Wildfire 5/10 Major
- Heat 6/10 Major 7 d/yr ≥107°F today · 19 d/yr by 30 yrs out
- Wind 6/10 Major 27% chance of damaging wind over 30 yrs
- Air quality 4/10 Moderate 5 unhealthy d/yr today · 8 by 30 yrs out
Nearby sold comps map
Loading sold comps map…
Walkable amenities ~0.75 mi
Loading nearby amenities…
Taxation est. · year 1
- Rental income
- $13,747
- − Mortgage interest
- −$8,811
- − Property taxes
- −$634
- − Insurance
- −$786
- − Repairs & maintenance
- −$1,100
- − Management
- −$1,100
- − Depreciation
- −$4,576
- Taxable loss
- −$3,261
- Est. tax savings @ 24.0%
- +$783
- After-tax cash flow
- $323/yr
For passive investors: Depreciation is non-cash, so a rental often shows a tax loss while cash-flowing — sheltering income. Rental losses are passive: they offset passive income freely, and up to $25,000/yr can offset ordinary (W-2) income if you actively participate and your MAGI is under $100k (phasing out to $0 by $150k); unused losses carry forward. On sale, claimed depreciation is recaptured at up to 25%, and gains may owe capital-gains tax (a 1031 exchange can defer both). Figures are a year-1 estimate at your 24.0% rate — not tax advice; consult a CPA.
Schools (NCES district)
- District
- Jefferson County
- NCES district ID
- 0101920
- Math proficiency
- 9% ▼ -24.00%
- Reading proficiency
- 32% ▼ -5.00%
- Median HH income
- $51,712
- Composite
- 18.4/100
- National rank
- #8937
- State rank
- #104 of 129 in AL
Livability — Graysville
- Score
- 59/100
- State rank
- #321
- US rank
- #19807
Category grades
Schools grade is shown separately in the Schools card above.
Census & demographics
- Population (ZIP)
- 8,674
Population outlook (Jefferson County) Hauer SSP2
- Today (2025)
- 669,185 people
- By 2030
- 669,694 · +0.1%
- By 2040
- 661,388 · -1.2%
- By 2050
- 643,086 · -3.9%
- By 2075
- 577,267 · -13.7%
- By 2100
- 474,758 · -29.1%
Race, ethnicity, and origin ACS 2023
- Neighborhood character
- Predominantly White (90%)
- Race & ethnicity
- White 90% Black 6% Two or more races 2% Asian 2%
- Common ancestry
- Serbian 3% Slovak 3% Iranian 2%
- Foreign-born
- 1% · China, Canada
- Languages at home
- 94% English-only · German/W. Germanic 3% Spanish 1% Chinese 1%
Political lean MEDSL · Jefferson
- 2024 margin
- D (+10.4) · D 54.6% · R 44.2% · Other 1.2%
- 2008→2024 swing
- +5.4pp toward D · 2008: 5.1pp · 2024: 10.4pp
- All cycles
- 2024: D+10.4 2020: D+13.2 2016: D+7.2 2012: D+6.0 2008: D+5.1
Not yet ingested
- Civics
- —
Market trends
- HPI YoY
- ▲ 22.99%
- Current HPI
- 260.41
- Rent YoY
- —
- Metro
- —
- State GDP YoY
- ▲ 2.94%
- F500 in state
- 4
Industry mix (Fortune 500 HQ in AL)
| Industry | F500 HQs | Revenue |
|---|---|---|
| Financial Services | 1 | $8B |
|
||
| Healthcare | 1 | $5B |
|
||
Price history
+294.2% since first listed15 events — show timeline
- 2026-04-07 Listed $157,300 Greater Alabama MLS
- 2026-03-20 Rental Removed $1,175 SHOWMOJO
- 2026-03-05 Price Changed $1,175 SHOWMOJO
- 2026-02-13 Price Changed $1,190 SHOWMOJO
- 2026-01-24 Price Changed $1,215 SHOWMOJO
- 2026-01-05 Price Changed $1,240 SHOWMOJO
- 2025-12-16 Listed for Rent $1,265 SHOWMOJO
- 2023-12-08 Sold (Public Records) $146,000 Public Records
- 2023-06-16 Sold (MLS) $70,000 Greater Alabama MLS
- 2023-05-17 Listed — Greater Alabama MLS
- 2023-04-18 Listed $72,000 Greater Alabama MLS
- 2022-05-11 Price Changed $85,000 Greater Alabama MLS
- 2022-05-03 Price Changed $99,900 Greater Alabama MLS
- 2009-12-18 Sold (Public Records) $90,000 Public Records
- 2000-07-13 Sold (Public Records) $39,900 Public Records
Property tax history
+10.7%/yrLatest (2025): $634 · +139.7% YoY. Source: county tax records.
Cash-flow waterfall
monthlySold comps — $/sqft
last 12 mo · ≤1 miLoading sold comps…