 🏗️ New Construction
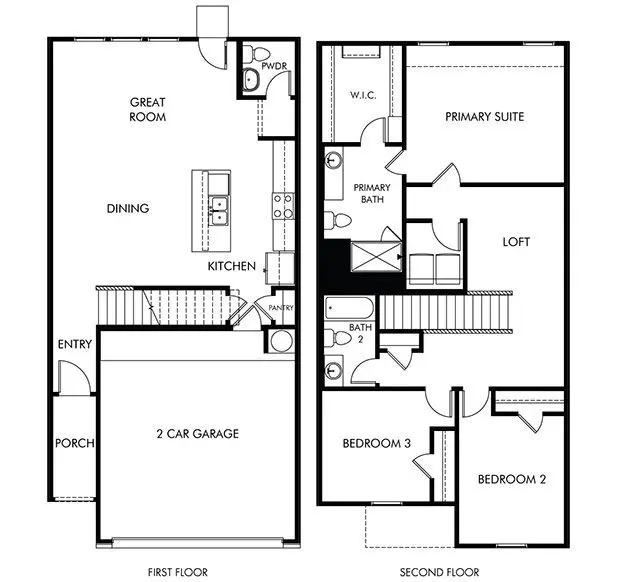
The Waterloo (175E) Plan · Kyle, TX
Flood risk No data
- FEMA flood zone
- —
- Chance of flooding over 30 yrs
- —
- Est. flood insurance / yr
- —
Fire risk No data
- Est. fire insurance / yr
- —
Heat risk No data
- Hot days now (above threshold)
- —
- Hot days in 30 yrs
- —
Wind risk No data
- Chance of severe wind over 30 yrs
- —
Air-quality risk No data
- Unhealthy air days now
- —
- Unhealthy air days in 30 yrs
- —
Risk factors via First Street. Map © Google.
Why this score? — see what drove the F grade
The composite is a weighted blend of 9 inputs, each scored 0–100. Each bar is that input's sub-score; the figure is the points it added to the 100-point composite (weight × sub-score).
- ARV discount +7.5/15.0
- Cash flow +5.9/30.0
- Livability +3.8/5.0
- Schools +3.5/10.0
- Rent growth +2.4/5.0
- Condition / age +2.0/5.0
- 1% rule +1.3/10.0
- DSCR +0.3/10.0
- Appreciation +0.0/10.0
$254,990
🖨 Deal sheet (PDF) 📄 Offer letter ✓ Due diligence
Listing remarks MLS
An open concept first floor makes this home perfect for conversation and entertainment. Upstairs, the versatile loft is perfect for reading, gaming, or a home office setup.
Key facts
- Versatile loft
- 2 parking spots
- Listed 142 days
Tags
Neighborhood map
What this means for you Summary
Snapshot
- This is a 3-bed/2.5-bath single-family listed at $255k. Condition is rated fair.
Deal economics
- At list price, monthly cash flow is $-620 ($-7k/yr) — negative.
- To cash-flow at today's rent, offer at most $228k (10.6% below list).
- To meet the 1% rule (rent ≥ 1% of price), the offer needs to be $199k (21.8% below list).
- Recommended offer: $199k (21.8% below list) — sets the bar for 1% rule.
Location & tenants
- Location reads 75/100 on livability (#138 in TX, #3,993 nationally) — a middle-class / working-renter tenant base. Strengths: housing A+, health & safety A+, employment A; Watch: amenities F, commute F.
- Hays CISD (rural): math 35% / reading 41% proficiency, ranked #390 of 826 in TX (top 47%) — families likely to look elsewhere, expect single-tenant / working-renter base with shorter leases.
- Zoned schools: Blanco Vista El (math 33% / reading 42%, grade F, #1,744 of 4,322 statewide, top 41%, 731 students, 58% FRL); Laura B Wallace Middle (math 31% / reading 34%, grade F, #947 of 1,662 statewide, top 58%, 789 students, 53% FRL); Lehman H S (math 20% / reading 32%, grade F, #1,234 of 1,632 statewide, top 76%, 2,120 students, 59% FRL).
- Market conditions: Rents soft (-0.3%/yr); 1820 active listings in the ZIP; 40 comparable units currently listed for rent nearby; rentals at typical pace (median 20d on market — plan ~3-4 weeks tenant-placement turnaround); solid renter incomes; 5,270 units permitted in Hays County in 2024 (1,464 in 5+ unit buildings).
Forward outlook
- Local home prices are declining (-3.0%/yr); year-one equity from $2k of loan paydown is wiped out by about $10k of value loss. Plan a longer hold.
- Hays County population projected at +93% by 2050 — long-run rental-demand tailwind backs the buy-and-hold thesis.
Negotiation context
- It's been on market 142 days — a 12% lower offer ($224k) is reasonable based on typical stale-listing flexibility.
Questions for the listing agent
- What do current leases actually rent for vs. the listed asking? Can we see a recent rent roll and the last 12 months of T-12 income?
- It's been on market 142 days. Have you received any prior offers? Is the seller open to a 22% concession, seller financing, or rate buy-down credit?
- Have any recent inspections been done? Can we get a copy of the seller's disclosures and any deferred-maintenance estimates?
- Why hasn't it sold? Are there any deal-killer items the seller is aware of (foundation, flood, title, zoning, code violations)?
- Is there a deadline driving the sale (1031 exchange, divorce, estate, relocation)? That informs how much negotiation room exists.
- Schools are D-rated, which usually means shorter tenancies and higher turnover. Who's the typical renter profile here, and what's been the actual vacancy rate?
- The area grade is low — what's the realistic commute time and amenity access for the typical tenant pool here? Any planned neighborhood developments (good or bad) we should know about?
- What's the average days-on-market for RENTAL listings here right now (not sales)? A rising rental-DOM trend means longer vacancies and softer asking-rent achievability than the comps imply.
- What's the recent tenant-quality profile in this submarket — average credit score on applications, eviction rate, late-payment / NSF rate, and stable-employment percentage? A property-management company in the area should have these aggregated.
- How much new for-sale + rental construction is in the pipeline within 1–3 miles? Heavy new supply typically softens prices + rents 12–24 months out; constrained supply supports both.
Investment metrics
- 1% rule
- 0.63% ✗
- Cap rate
- 3.95%
- Cash-on-cash
- -8.36%
- DSCR
- 0.63
- GRM
- 13.3
CMA / ARV
- ARV (median comp)
- $317,591
- List price
- $254,990
- Delta
- -19.71%
- Verdict
- UNDERPRICED
- Comps
- 20 within 1.0 mi
Show comp detail 12 sales within ~0.75 mi
| Address | Dist | Beds/Ba | Sqft | Sold | Price | $/sf | Match |
|---|---|---|---|---|---|---|---|
| 221 Alpha | 0.54mi | 3/2.0 | 1,664 (-5%) | 1mo | $260,000 | $156 | 64 |
| 145 Fossil | 0.16mi | 4/2.5 (+1) | 2,012 (+15%) | 2mo | $338,840 | $168 | 62 |
| 271 Texas Agate Dr | 0.22mi | 4/2.5 (+1) | 2,012 (+15%) | 0mo | $349,990 | $174 | 60 |
| 501 Sormonne Loop | 0.67mi | 3/2.0 | 1,645 (-6%) | 2mo | $267,990 | $163 | 54 |
| 507 Sormonne Loop | 0.66mi | 4/2.0 (+1) | 1,815 (+3%) | 3mo | $276,990 | $153 | 54 |
| 461 Sormonne Loop | 0.71mi | 4/2.0 (+1) | 1,815 (+3%) | 1mo | $287,990 | $159 | 54 |
| 491 Sormonne Loop | 0.68mi | 4/2.0 (+1) | 1,815 (+3%) | 3mo | $284,990 | $157 | 53 |
| 158 Meuse Ln | 0.70mi | 4/2.5 (+1) | 1,879 (+7%) | 1mo | $261,999 | $139 | 50 |
| 570 Sormonne Loop | 0.66mi | 4/2.5 (+1) | 1,879 (+7%) | 3mo | $253,490 | $135 | 50 |
| 317 Ames Cv | 0.67mi | 4/2.5 (+1) | 1,969 (+12%) | 2mo | $249,990 | $127 | 42 |
| 356 Discovery | 0.70mi | 4/2.0 (+1) | 1,934 (+10%) | 3mo | $279,000 | $144 | 41 |
| 483 Sormonne Loop | 0.69mi | 4/3.0 (+1) | 1,966 (+12%) | 1mo | $295,990 | $151 | 40 |
Match score weights: distance 35% · size 25% · config 20% · recency 20%. Top-matched comps best support the ARV.
Projected returns pro-forma
-3.0% appreciation · 0.0% rent growth · sell at horizon
- IRR
- -34.4%
- Equity multiple
- -0.09×
- Total profit
- $-96,750
- Equity at exit
- $47,354
- IRR
- -66.6%
- Equity multiple
- -0.77×
- Total profit
- $-157,535
- Equity at exit
- $27,459
Cash invested: $88,925 (down + closing). Projections, not guarantees.
Landlord ↔ Tenant lean methodology
- Overall (STATE)
- 87 Strongly Landlord-Friendly
- State Texas
- 87 Strongly Landlord-Friendly · R+5
- County
- — inherits STATE
- City
- — inherits STATE
ZIP-level market 78640
- Home prices YoY
- -33.8%
- Rents YoY
- -0.3%
- Active inventory
- 1820
- Price-to-rent
- 10.7×
Monthly cashflow live
- Estimated rent
- $1,994 high interval (Pro) →
- Mortgage (P&I)
- −$1,665
- Tax est. 1.5%
- −$397 /mo · $4,764/yr
- Insurance
- −$132
- HOA
- −$0
- Vacancy / Maint / Mgmt
- −$419
- Net cashflow
- $-620
Break-even live
Sensitivity live
| Price | -10% $-400 | -5% $-510 | +0% $-620 | +5% $-730 | +10% $-839 |
|---|---|---|---|---|---|
| Rent | -10% $-777 | -5% $-699 | +0% $-620 | +5% $-541 | +10% $-462 |
| Rate | -1.0pp $-460 | -0.5pp $-539 | base $-620 | +0.5pp $-702 | +1.0pp $-786 |
UW: 25.0% down · 7.5% · 30yr · 1.5% tax · 5.0% vac · 8.0% maint · 8.0% mgmt
Financing live
Cash to close
- Down payment
- $79,398
- Closing costs
- $9,528
- Reserves months
- —
- Total cash needed
- —
Loan-product check · same deal, 3 products live
Conventional
25% down · 7.5% · 30yr
- Down + closing
- —
- Monthly P&I
- —
- Monthly cashflow
- —
- DSCR
- —
- Eligible?
- —
Personal DTI + credit; lowest rate.
DSCR
20% down · 8.5% · 30yr
- Down + closing
- —
- Monthly P&I
- —
- Monthly cashflow
- —
- DSCR
- —
- Eligible?
- —
No personal income docs; deal must DSCR.
Hard money
10% down · 12.0% · 12mo
- Down + closing
- —
- Monthly P&I
- —
- Monthly cashflow
- —
- DSCR
- —
- Eligible?
- —
Short-term bridge; refi at stabilization.
Rent comps 40 comps
| Address | Beds | Baths | Sqft | Rent | $/sqft | DOM | Units | Dist |
|---|---|---|---|---|---|---|---|---|
| 310 Fossil Dr Kyle, TX | 3.0 | 2.0 | 1602 | $2,000 | $1.25 | 6d | 1 | 0.26mi |
| 185 Voss Kyle, TX | 3.0 | 2.0 | 1371 | $1,800 | $1.31 | 13d | 1 | 0.45mi |
| 232 Voss Kyle, TX | 3.0 | 2.0 | 1467 | $1,895 | $1.29 | 6d | 1 | 0.49mi |
| 384 Discovery Kyle, TX | 4.0 | 2.5 | 2080 | $1,995 | $0.96 | 45d | 1 | 0.65mi |
| 141 Opal Ln Kyle, TX | 3.0 | 1.0–2.0 | 886 | $2,000 | $2.26 | 0d | 92 | 0.66mi |
| 376 Musgrav Kyle, TX | 3.0 | 2.0 | 1476 | $1,988 | $1.35 | 18d | 1 | 0.70mi |
| 376 Musgrav Kyle, TX | 3.0 | 2.0 | 1476 | $1,890 | $1.28 | 0d | 1 | 0.70mi |
| 349 Zarya Kyle, TX | 4.0 | 2.5 | 2089 | $6,200 | $2.97 | 19d | 1 | 0.71mi |
| 265 Garner Dr Kyle, TX | 3.0 | 2.0 | 1551 | $2,250 | $1.45 | 45d | 1 | 0.76mi |
| 190 Sormonne Loop Kyle, TX | 3.0 | 2.0 | 1450 | $1,650 | $1.14 | 25d | 1 | 0.76mi |
| 265 Vortex Pass Kyle, TX | 4.0 | 2.0 | 2467 | $2,595 | $1.05 | 19d | 1 | 0.80mi |
| 208 Discovery Kyle, TX | 3.0 | 2.0 | 1893 | $2,025 | $1.07 | 45d | 1 | 0.80mi |
| 208 Discovery Kyle, TX | 3.0 | 2.0 | 1893 | $1,895 | $1.00 | 0d | 1 | 0.80mi |
| 184 Unity Kyle, TX | 4.0 | 2.5 | 1704 | $2,000 | $1.17 | 45d | 1 | 0.82mi |
| 125 Voyager Cv Kyle, TX | 3.0 | 2.0 | 1476 | $1,800 | $1.22 | 45d | 1 | 0.84mi |
| 147 Otter Rd Kyle, TX | 3.0 | 2.0 | 1622 | $1,850 | $1.14 | 14d | 1 | 0.85mi |
| 591 Avre Loop Kyle, TX | 4.0 | 2.0 | 1950 | $2,200 | $1.13 | 25d | 1 | 0.88mi |
| 149 River Rise Rd Kyle, TX | 4.0 | 2.0 | 1896 | $1,950 | $1.03 | 25d | 1 | 0.88mi |
| 157 Mammoth Dr Kyle, TX | 3.0 | 2.0 | 1607 | $1,895 | $1.18 | 25d | 1 | 0.88mi |
| 148 River Rise Rd Kyle, TX | 4.0 | 2.0 | 1622 | $1,800 | $1.11 | 45d | 1 | 0.89mi |
| 141 Everglades Dr Kyle, TX | 3.0 | 2.5 | 2179 | $2,000 | $0.92 | 45d | 1 | 0.93mi |
| 149 Biscayne Dr Kyle, TX | 4.0 | 2.0 | 1800 | $1,900 | $1.06 | 19d | 1 | 0.94mi |
| 366 Silver Springs Bnd Kyle, TX | 3.0 | 2.5 | 1909 | $2,145 | $1.12 | 5d | 1 | 0.97mi |
| 290 Silver Glen Dr Kyle, TX | 3.0 | 2.5 | 2085 | $2,350 | $1.13 | 19d | 1 | 1.02mi |
| 343 Silver Glen Dr Kyle, TX | 3.0 | 2.5 | 1913 | $1,895 | $0.99 | 45d | 1 | 1.02mi |
| 195 Salt Springs Rd Kyle, TX | 4.0 | 2.0 | 1818 | $2,100 | $1.16 | 19d | 1 | 1.03mi |
| 130 Yellowstone Dr Kyle, TX | 4.0 | 2.5 | 2507 | $2,900 | $1.16 | 6d | 1 | 1.04mi |
| 121 Yellowstone Dr Kyle, TX | 3.0 | 2.0 | 1723 | $2,200 | $1.28 | 25d | 1 | 1.05mi |
| 271 Alamito Ave Kyle, TX | 4.0 | 3.5 | 1923 | $2,100 | $1.09 | 16d | 1 | 1.05mi |
| 149 Red Sun Dr Kyle, TX | 3.0 | 2.0 | 1421 | $1,850 | $1.30 | 12d | 1 | 1.12mi |
| 106 Lakeview Ct Kyle, TX | 3.0 | 2.5 | 1765 | $1,795 | $1.02 | 19d | 1 | 1.12mi |
| 112 Lakeview Ct Kyle, TX | 3.0 | 2.5 | 1765 | $1,795 | $1.02 | 6d | 1 | 1.12mi |
| 185 Creekside Villa Dr Kyle, TX | 3.0 | 2.5 | 1463 | $1,700 | $1.16 | 16d | 1 | 1.17mi |
| 155 Creekside Villa Dr Kyle, TX | 3.0 | 2.0 | 1266 | $1,695 | $1.34 | 25d | 1 | 1.17mi |
| 155 Creekside Villa Dr Kyle, TX | 3.0 | 2.0 | 1266 | $1,695 | $1.34 | 6d | 1 | 1.17mi |
| 155 Creekside Villa Dr Kyle, TX | 3.0 | 2.0 | 1266 | $1,495 | $1.18 | 16d | 1 | 1.17mi |
| 149 Creekside Villa Dr Kyle, TX | 3.0 | 2.0 | 1266 | $1,495 | $1.18 | 16d | 1 | 1.17mi |
| 126 Avre Loop Kyle, TX | 3.0 | 2.0 | 1230 | $1,700 | $1.38 | 45d | 1 | 1.18mi |
| 134 Agua Azul Bnd Kyle, TX | 4.0 | 2.5 | 2500 | $2,499 | $1.00 | 45d | 1 | 1.20mi |
| 1689 Woodlands Dr Kyle, TX | 4.0 | 2.0 | 1515 | $1,850 | $1.22 | 45d | 1 | 1.21mi |
Listing history 20 events
-
2026-06-21days on market $254,990 Active 142 DOM
-
2026-06-18days on market $254,990 Active 139 DOM
-
2026-06-17days on market $254,990 Active 138 DOM
-
2026-06-16days on market $254,990 Active 137 DOM
-
2026-06-15days on market $254,990 Active 136 DOM
-
2026-06-13pricedays on market $254,990 Active 134 DOM
-
2026-06-09days on market $234,990 Active 130 DOM
-
2026-06-08days on market $234,990 Active 129 DOM
-
2026-06-07days on market $234,990 Active 128 DOM
-
2026-06-05days on market $234,990 Active 125 DOM
-
2026-06-03days on market $234,990 Active 124 DOM
-
2026-06-02days on market $234,990 Active 123 DOM
-
2026-06-01days on market $234,990 Active 122 DOM
-
2026-05-31days on market $234,990 Active 121 DOM
-
2026-04-22price $234,990 172-char remark
Show marketing remark (172 chars)
An open concept first floor makes this home perfect for conversation and entertainment. Upstairs, the versatile loft is perfect for reading, gaming, or a home office setup.
-
2026-03-26price $239,990 172-char remark
Show marketing remark (172 chars)
An open concept first floor makes this home perfect for conversation and entertainment. Upstairs, the versatile loft is perfect for reading, gaming, or a home office setup.
-
2026-03-12price $259,990 172-char remark
Show marketing remark (172 chars)
An open concept first floor makes this home perfect for conversation and entertainment. Upstairs, the versatile loft is perfect for reading, gaming, or a home office setup.
-
2026-03-05price $264,990 172-char remark
Show marketing remark (172 chars)
An open concept first floor makes this home perfect for conversation and entertainment. Upstairs, the versatile loft is perfect for reading, gaming, or a home office setup.
-
2026-02-12price $276,990 172-char remark
Show marketing remark (172 chars)
An open concept first floor makes this home perfect for conversation and entertainment. Upstairs, the versatile loft is perfect for reading, gaming, or a home office setup.
-
2026-01-30$244,990 Active 172-char remark
Show marketing remark (172 chars)
An open concept first floor makes this home perfect for conversation and entertainment. Upstairs, the versatile loft is perfect for reading, gaming, or a home office setup.
ⓘ Source: listings_history table (triggers on properties + properties_extension) + one-shot
backfill from property_details.listing_events for pre-trigger history.
Nearby sold comps map
Loading sold comps map…
Walkable amenities ~0.75 mi
Loading nearby amenities…
Taxation est. · year 1
- Rental income
- $23,924
- − Mortgage interest
- −$17,790
- − Property taxes
- −$4,764
- − Insurance
- −$1,588
- − Repairs & maintenance
- −$1,914
- − Management
- −$1,914
- − Depreciation
- −$9,239
- Taxable loss
- −$13,284
- Est. tax savings @ 24.0%
- +$3,188
- After-tax cash flow
- $-4,249/yr
For passive investors: Depreciation is non-cash, so a rental often shows a tax loss while cash-flowing — sheltering income. Rental losses are passive: they offset passive income freely, and up to $25,000/yr can offset ordinary (W-2) income if you actively participate and your MAGI is under $100k (phasing out to $0 by $150k); unused losses carry forward. On sale, claimed depreciation is recaptured at up to 25%, and gains may owe capital-gains tax (a 1031 exchange can defer both). Figures are a year-1 estimate at your 24.0% rate — not tax advice; consult a CPA.
Condition & rehab AI · 1 photo
The home requires significant repairs and updates across multiple systems, including major work on the kitchen, bathrooms, exterior, and interior. Immediate updates to paint, windows, and HVAC would significantly improve its value.
Repairs flagged
- Major Kitchen — No photos of the kitchen
- Major Bathrooms — No photos of the bathrooms
- Major Exterior — No photos of the exterior
- Major Flooring — No photos of the flooring
- Major Interior walls/paint — No photos of the interior walls/paint
- Major Windows — No photos of the windows
- Major Foundation/structure — No photos of the foundation/structure
- Major HVAC/mechanicals — No photos of the HVAC/mechanicals
- Major Landscaping/curb appeal — No photos of the landscaping/curb appeal
Value-add opportunities
- Both Paint interior walls — Fresh paint enhances curb appeal and interior aesthetics
- Both Clean windows — Clean windows improve natural light and curb appeal
- Both Inspect HVAC system — A functional HVAC system ensures comfort and energy efficiency
Renovation cost estimate screening
| Repair item | Severity | Est. cost |
|---|---|---|
| Kitchen · No photos of the kitchen | Major | $15,000–50,000 |
| Bathrooms · No photos of the bathrooms | Major | $15,000–50,000 |
| Exterior · No photos of the exterior | Major | $15,000–50,000 |
| Flooring · No photos of the flooring | Major | $15,000–50,000 |
| Interior walls/paint · No photos of the interior walls/paint | Major | $15,000–50,000 |
| Windows · No photos of the windows | Major | $15,000–50,000 |
| Foundation/structure · No photos of the foundation/structure | Major | $15,000–50,000 |
| HVAC/mechanicals · No photos of the HVAC/mechanicals | Major | $15,000–50,000 |
| Landscaping/curb appeal · No photos of the landscaping/curb appeal | Major | $15,000–50,000 |
| Total estimated repair cost · 9 items | $135,000–450,000 |
Value-add ROI direction
- Both Paint interior walls — Fresh paint enhances curb appeal and interior aesthetics ↑
- Both Clean windows — Clean windows improve natural light and curb appeal ↑
- Both Inspect HVAC system — A functional HVAC system ensures comfort and energy efficiency ↑
ⓘ Cost ranges are severity-bucket heuristics (US national rule-of-thumb). Get contractor quotes + a written scope before underwriting a rehab budget.
Schools (NCES district)
- District
- Hays CISD
- NCES district ID
- 4800010
- Math proficiency
- 35% ▼ -15.00%
- Reading proficiency
- 41% ▼ -5.00%
- Median HH income
- $70,570
- Composite
- 34.78/100
- National rank
- #5118
- State rank
- #390 of 826 in TX
Livability — Kyle
- Score
- 75/100
- State rank
- #138
- US rank
- #3993
Category grades
Schools grade is shown separately in the Schools card above.
Census & demographics
- Census place
- Kyle, TX
- County
- Hays County · 280,138 people
- City population
- 77,531
- Metro
- Austin-Round Rock-Georgetown, TX
- Population (ZIP)
- 77,531
- Household income
- $90,075
- Rent vs Own
- Severe rent burden
- 2552.0
Population outlook (Hays County) Hauer SSP2
- Today (2025)
- 286,948 people
- By 2030
- 336,923 · +17.4%
- By 2040
- 441,894 · +54.0%
- By 2050
- 553,462 · +92.9%
- By 2075
- 838,261 · +192.1%
- By 2100
- 1,063,658 · +270.7%
Race, ethnicity, and origin ACS 2023
- Neighborhood character
- Diverse neighborhood (Simpson 0.56)
- Race & ethnicity
- Hispanic / Latino 55% White 36% Two or more races 29% Black 5% Native American 1%
- Hispanic origin (detail)
- Mexican 47% Puerto Rican 1%
- Common ancestry
- Italian 2% Slovak 2% Lithuanian 1%
- Foreign-born
- 13% · Canada
- Languages at home
- 63% English-only · Spanish 35%
Political lean MEDSL · Hays
- 2024 margin
- Lean D (+5.7) · D 52.1% · R 46.5% · Other 1.4%
- 2008→2024 swing
- +7.7pp toward D · 2008: -2.0pp · 2024: 5.7pp
- All cycles
- 2024: D+5.7 2020: D+10.8 2016: R+0.9 2012: R+10.4 2008: R+2.0
Not yet ingested
- Civics
- —
Market trends
- HPI YoY
- ▼ -92.64%
- Current HPI
- 181.7969
- Rent YoY
- ▼ -0.34%
- Metro
- Austin-Round Rock-Georgetown, TX
- State GDP YoY
- ▲ 3.95%
- F500 in state
- 110
Industry mix (Fortune 500 HQ in TX)
| Industry | F500 HQs | Revenue |
|---|---|---|
| Energy | 16 | $1,198B |
|
||
| Technology | 5 | $198B |
|
||
| Engineering / Construction | 4 | $72B |
|
||
| Energy Services | 3 | $60B |
|
||
| Utilities | 3 | $41B |
|
||
| Healthcare | 2 | $330B |
|
||
Price history
-4.1% since first listed6 events — show timeline
- 2026-04-22 Price Changed $234,990 Zillow
- 2026-03-26 Price Changed $239,990 Zillow
- 2026-03-12 Price Changed $259,990 Zillow
- 2026-03-05 Price Changed $264,990 Zillow
- 2026-02-12 Price Changed $276,990 Zillow
- 2026-01-30 Listed $244,990 Zillow
Cash-flow waterfall
monthlySold comps — $/sqft
last 12 mo · ≤1 miLoading sold comps…