 🏗️ New Construction
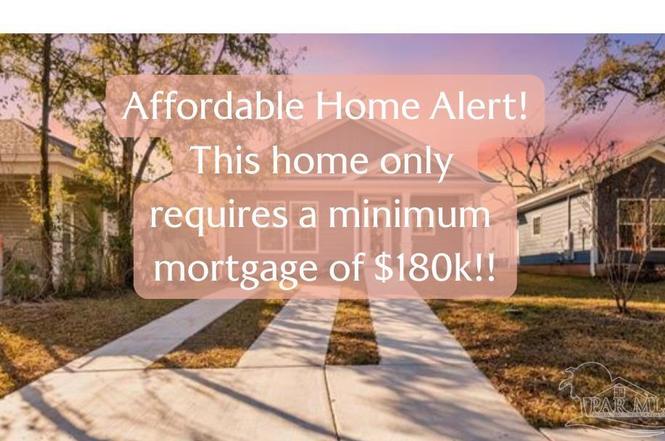
1105 W Gonzales St · Pensacola, FL
Flood risk 1/10 · Minimal
- FEMA flood zone
- X (unshaded)
- Chance of flooding over 30 yrs
- 0.0%
- Est. flood insurance / yr
- $507 – $1,088
Fire risk 1/10 · Minimal
- Est. fire insurance / yr
- $947 – $1,759
Heat risk 10/10 · Severe
- Hot days now (above 105°F)
- 7 days/yr
- Hot days in 30 yrs
- 22 days/yr
Wind risk 9/10 · Severe
- Chance of severe wind over 30 yrs
- 99.0%
Air-quality risk 2/10 · Minimal
- Unhealthy air days now
- 0 days/yr
- Unhealthy air days in 30 yrs
- 1 days/yr
Risk factors via First Street. Map © Google.
Why this score? — see what drove the D grade
The composite is a weighted blend of 9 inputs, each scored 0–100. Each bar is that input's sub-score; the figure is the points it added to the 100-point composite (weight × sub-score).
- Cash flow +12.2/30.0
- ARV discount +7.5/15.0
- Condition / age +4.8/5.0
- Livability +4.2/5.0
- Rent growth +3.9/5.0
- DSCR +3.6/10.0
- Schools +3.6/10.0
- 1% rule +3.5/10.0
- Appreciation +0.0/10.0
$180,000
🖨 Deal sheet (PDF) 📄 Offer letter ✓ Due diligence
Listing remarks
* * PAY ATTENTION TO THIS * * this home will cost you only $180k because of downpayment and subsidies through Habitat for Humanity! This 4-bedroom, 2-bath beauty has it all: all-wood-look flooring, HardieBoard exterior, a washer/dryer, and even a shed for all your extra stuff. Big bonus: This home is part of an Affordable Housing Program with a huge down payment subsidy, likely over $100K for the right buyer, making the mortgage incredibly affordable! That’s right… move in with WAY less out of pocket. Perfect for anyone ready to snag a home near downtown without the crazy price tag. But act fast- program requirements apply, and opportunities like this don’t stick aroun
Key facts
- Hardieboard exterior
- Shed
- Washer dryer
Tags
Property features AI
Finance
- HOA & community: No homeowners association
Exterior
- Parking: Driveway with open parking
- Utilities: Public water; Public sewer; Copper electrical wiring; Publicly maintained road
- Home design: One-story residence; New construction; Not attached to another property; Insulated walls
- Construction: Concrete construction; Slab foundation; Built as new construction
- Exterior features: Metal roof; Central access lot
Interior
- Kitchen: Refrigerator; Electric water heater
- Bedrooms: Two bedrooms on the first floor (each approximately 12' x 12')
- Flooring: Vinyl
- Bathrooms: Two full bathrooms
- Heating & cooling: Central heating; Central air; Ceiling fans
- Interior features: Vinyl flooring; Eat-in kitchen / living-dining combo
Neighborhood map
What this means for you Summary
Snapshot
- This is a 4-bed/2.0-bath single-family listed at $180k. Condition is rated excellent.
Deal economics
- At list price, monthly cash flow is $-49 ($-583/yr) — negative.
- The deal already cash-flows at list — no discount required.
- Meets the 1% rule at list price ($2k rent vs $180k).
- Recommended offer: $164k (9.0% below list) — sets the bar for market timing.
- Cap rate 6.1% vs local median 3.6% in Pensacola — top-decile yield for the area; either an underpriced asset or a hidden risk that comps aren't pricing in. Stress-test before assuming the spread holds.
Location & tenants
- Location reads 83/100 on livability (#53 in FL, #924 nationally) — a professional / high-income tenant draw. Strengths: commute A+, cost of living A+, housing A+.
- Escambia (suburban): math 40% / reading 45% proficiency, ranked #56 of 73 in FL (top 77%) — families likely to look elsewhere, expect single-tenant / working-renter base with shorter leases.
- Market conditions: Rents rising fast (+5.4%/yr); 129 active listings in the ZIP; 21 comparable units currently listed for rent nearby; rentals at typical pace (median 25d on market — plan ~3-4 weeks tenant-placement turnaround); lower-income renter base — watch delinquency; 1,479 units permitted in Escambia County in 2024 (0 in 5+ unit buildings).
- At $2,123/mo this rent would consume 58% of the median local household income ($44k/yr) (locally 816% of renters already pay >50% of income on rent) — very limited rent-growth headroom before tenants either downsize or default.
Forward outlook
- Local home prices are declining (-3.0%/yr); year-one equity from $2k of loan paydown is wiped out by about $7k of value loss. Plan a longer hold.
- Escambia County population projected at +13% by 2050 — modest demand growth; plan on rents tracking national, not racing it.
Negotiation context
- It's been on market 115 days — a 9% lower offer ($164k) is reasonable based on typical stale-listing flexibility.
Risks & watch-outs
- Climate carrying-cost: severe wind risk, 99% chance of damaging wind over 30y; extreme-heat days projected 7→22/yr by 2055 (HVAC capex compounding) — expect insurance premiums to compound above CPI over the hold.
Questions for the listing agent
- What do current leases actually rent for vs. the listed asking? Can we see a recent rent roll and the last 12 months of T-12 income?
- It's been on market 115 days. Have you received any prior offers? Is the seller open to a 9% concession, seller financing, or rate buy-down credit?
- Why hasn't it sold? Are there any deal-killer items the seller is aware of (foundation, flood, title, zoning, code violations)?
- Is there a deadline driving the sale (1031 exchange, divorce, estate, relocation)? That informs how much negotiation room exists.
- The area grade is low — what's the realistic commute time and amenity access for the typical tenant pool here? Any planned neighborhood developments (good or bad) we should know about?
- What's the average days-on-market for RENTAL listings here right now (not sales)? A rising rental-DOM trend means longer vacancies and softer asking-rent achievability than the comps imply.
- What's the recent tenant-quality profile in this submarket — average credit score on applications, eviction rate, late-payment / NSF rate, and stable-employment percentage? A property-management company in the area should have these aggregated.
- How much new for-sale + rental construction is in the pipeline within 1–3 miles? Heavy new supply typically softens prices + rents 12–24 months out; constrained supply supports both.
Investment metrics
- 1% rule
- 0.85% ✗
- Cap rate
- 6.06%
- Cash-on-cash
- -0.83%
- DSCR
- 0.96
- GRM
- 9.8
CMA / ARV
- ARV (on-the-fly)
- $249,742
- Comps found
- 12
Show comp detail 12 sales within ~0.75 mi
| Address | Dist | Beds/Ba | Sqft | Sold | Price | $/sf | Match |
|---|---|---|---|---|---|---|---|
| 1105 W Gonzales St | 0.00mi | 4/2.0 | 1,294 (0%) | 1mo | $180,000 | $139 | 100 |
| 919 & 917 W Lloyd St | 0.18mi | 3/3.0 (-1) | 1,214 (-6%) | 3mo | $399,000 | $329 | 70 |
| 921 W Lloyd St | 0.16mi | 3/3.0 (-1) | 1,214 (-6%) | 5mo | $395,000 | $325 | 69 |
| 812 N D St | 0.22mi | 3/1.0 (-1) | 1,160 (-10%) | 3mo | $75,000 | $65 | 61 |
| 1120 N L St | 0.38mi | 3/1.0 (-1) | 1,212 (-6%) | 6mo | $75,000 | $62 | 58 |
| 1018 W Gregory St | 0.61mi | 4/1.0 | 1,222 (-6%) | 2mo | $255,000 | $209 | 56 |
| 2116 W De Soto St | 0.63mi | 3/2.0 (-1) | 1,344 (+4%) | 7mo | $260,000 | $193 | 54 |
| 621 W Hernandez St | 0.70mi | 4/1.0 | 1,200 (-7%) | 2mo | $90,000 | $75 | 49 |
| 302 N F St | 0.51mi | 3/2.0 (-1) | 1,104 (-15%) | 1mo | $288,000 | $261 | 46 |
| 1100 Hayden Ct | 0.52mi | 3/2.0 (-1) | 1,113 (-14%) | 3mo | $245,000 | $220 | 45 |
| 620 W Hernandez | 0.72mi | 3/1.0 (-1) | 1,180 (-9%) | 3mo | $150,000 | $127 | 40 |
| 2002 W Gonzalez St | 0.53mi | 3/1.0 (-1) | 1,112 (-14%) | 6mo | $145,000 | $130 | 37 |
Match score weights: distance 35% · size 25% · config 20% · recency 20%. Top-matched comps best support the ARV.
Projected returns pro-forma
-3.0% appreciation · 5.4% rent growth · sell at horizon
- IRR
- -15.0%
- Equity multiple
- 0.45×
- Total profit
- $-38,284
- Equity at exit
- $37,237
- IRR
- -2.8%
- Equity multiple
- 0.79×
- Total profit
- $-14,567
- Equity at exit
- $21,593
Cash invested: $69,928 (down + closing). Projections, not guarantees.
Landlord ↔ Tenant lean methodology
- Overall (STATE)
- 87 Strongly Landlord-Friendly
- State Florida
- 87 Strongly Landlord-Friendly · R+3
- County
- — inherits STATE
- City
- — inherits STATE
ZIP-level market 32501
- Rents YoY
- 5.4%
- Active inventory
- 129
- Price-to-rent
- 7.1×
Monthly cashflow live
- Estimated rent
- $2,123 high interval (Pro) →
- Mortgage (P&I)
- −$1,310
- Tax est. 1.5%
- −$312 /mo · $3,746/yr
- Insurance
- −$104
- HOA
- −$0
- Vacancy / Maint / Mgmt
- −$446
- Net cashflow
- $-49
Break-even live
Sensitivity live
| Price | -10% $124 | -5% $38 | +0% $-49 | +5% $-135 | +10% $-221 |
|---|---|---|---|---|---|
| Rent | -10% $-216 | -5% $-132 | +0% $-49 | +5% $35 | +10% $119 |
| Rate | -1.0pp $77 | -0.5pp $15 | base $-49 | +0.5pp $-113 | +1.0pp $-179 |
UW: 25.0% down · 7.5% · 30yr · 1.5% tax · 5.0% vac · 8.0% maint · 8.0% mgmt
Financing live
Cash to close
- Down payment
- $62,436
- Closing costs
- $7,492
- Reserves months
- —
- Total cash needed
- —
Loan-product check · same deal, 3 products live
Conventional
25% down · 7.5% · 30yr
- Down + closing
- —
- Monthly P&I
- —
- Monthly cashflow
- —
- DSCR
- —
- Eligible?
- —
Personal DTI + credit; lowest rate.
DSCR
20% down · 8.5% · 30yr
- Down + closing
- —
- Monthly P&I
- —
- Monthly cashflow
- —
- DSCR
- —
- Eligible?
- —
No personal income docs; deal must DSCR.
Hard money
10% down · 12.0% · 12mo
- Down + closing
- —
- Monthly P&I
- —
- Monthly cashflow
- —
- DSCR
- —
- Eligible?
- —
Short-term bridge; refi at stabilization.
Rent comps 21 comps
| Address | Beds | Baths | Sqft | Rent | $/sqft | DOM | Units | Dist |
|---|---|---|---|---|---|---|---|---|
| 814 N E St Pensacola, FL | 3.0 | 2.0 | 1440 | $1,695 | $1.18 | 24d | 1 | 0.17mi |
| 1215 N C St Pensacola, FL | 3.0 | 1.0 | 1203 | $1,775 | $1.48 | 15d | 1 | 0.22mi |
| 615 N A St Pensacola, FL | 3.0 | 2.0 | 1122 | $1,900 | $1.69 | 15d | 1 | 0.43mi |
| 411 N D St Pensacola, FL | 4.0 | 2.0 | 1511 | $2,175 | $1.44 | 24d | 1 | 0.45mi |
| 418 N C St Pensacola, FL | 3.0 | 2.0 | 1017 | $2,775 | $2.73 | 15d | 1 | 0.47mi |
| 410 N C St Unit 1367374P Pensacola, FL | 3.0 | 2.0 | 1291 | $3,313 | $2.57 | 15d | 1 | 0.48mi |
| 1804 W Belmont St Unit A Pensacola, FL | 3.0 | 1.0 | 925 | $995 | $1.08 | 22d | 1 | 0.62mi |
| 239 N K St Pensacola, FL | 3.0 | 2.0 | 1392 | $1,950 | $1.40 | 24d | 1 | 0.67mi |
| 721 W Jordan St Pensacola, FL | 3.0 | 2.0 | 1030 | $1,895 | $1.84 | 24d | 1 | 0.74mi |
| 407 W Jordan St Unit NA Pensacola, FL | 3.0 | 2.0 | 1300 | $2,200 | $1.69 | 24d | 1 | 0.77mi |
| 504 N Spring St Unit B Pensacola, FL | 3.0 | 1.5 | 1485 | $1,995 | $1.34 | 24d | 1 | 0.77mi |
| 309 N Pace Blvd Unit B Pensacola, FL | 3.0 | 2.0 | 1342 | $1,650 | $1.23 | 24d | 1 | 0.79mi |
| 315 N Pace Blvd Unit A Pensacola, FL | 3.0 | 2.0 | 1342 | $1,850 | $1.38 | 24d | 1 | 0.81mi |
| 315 N Pace Blvd Unit b Pensacola, FL | 3.0 | 2.0 | 1342 | $1,650 | $1.23 | 24d | 1 | 0.81mi |
| 106 S G St Pensacola, FL | 3.0 | 2.0 | 1300 | $2,200 | $1.69 | 24d | 1 | 0.87mi |
| 2802 W Gonzalez St Pensacola, FL | 3.0 | 2.0 | 1824 | $1,600 | $0.88 | 24d | 1 | 1.09mi |
| 2108 W Bobe St Pensacola, FL | 4.0 | 2.0 | 1752 | $2,100 | $1.20 | 24d | 1 | 1.11mi |
| 511 E La Rua St Pensacola, FL | 3.0 | 1.0 | 1128 | $1,475 | $1.31 | 15d | 1 | 1.30mi |
| 101 E Romana St Pensacola, FL | 3.0 | 1.0–2.0 | 987 | $2,588 | $2.62 | 15d | 20 | 1.32mi |
| 801 E Gonzalez St Pensacola, FL | 3.0 | 2.0 | 1200 | $2,200 | $1.83 | 15d | 1 | 1.35mi |
| 2008 N 8th Ave Pensacola, FL | 3.0 | 2.0 | 1058 | $1,250 | $1.18 | 15d | 1 | 1.47mi |
Listing history 7 events
-
2026-06-02status $180,000 Pending 115 DOM
-
2026-06-01days on market $180,000 Contingent 115 DOM
-
2026-05-31days on market $180,000 Contingent 114 DOM
-
2026-05-31days on market $180,000 Contingent 113 DOM
-
2026-04-29historical Contingent
-
2026-03-24price $180,000
-
2026-02-06$293,000 Active
ⓘ Source: listings_history table (triggers on properties + properties_extension) + one-shot
backfill from property_details.listing_events for pre-trigger history.
Climate risk First Street
- Flood 1/10 Low FEMA zone X (unshaded) · 0% chance over 30 yrs
- Wildfire 1/10 Low
- Heat 10/10 Extreme 7 d/yr ≥105°F today · 22 d/yr by 30 yrs out
- Wind 9/10 Extreme 99% chance of damaging wind over 30 yrs
- Air quality 2/10 Low 0 unhealthy d/yr today · 1 by 30 yrs out
Nearby sold comps map
Loading sold comps map…
Walkable amenities ~0.75 mi
Loading nearby amenities…
Taxation est. · year 1
- Rental income
- $25,478
- − Mortgage interest
- −$13,989
- − Property taxes
- −$3,746
- − Insurance
- −$1,249
- − Repairs & maintenance
- −$2,038
- − Management
- −$2,038
- − Depreciation
- −$7,265
- Taxable loss
- −$4,848
- Est. tax savings @ 24.0%
- +$1,164
- After-tax cash flow
- $580/yr
For passive investors: Depreciation is non-cash, so a rental often shows a tax loss while cash-flowing — sheltering income. Rental losses are passive: they offset passive income freely, and up to $25,000/yr can offset ordinary (W-2) income if you actively participate and your MAGI is under $100k (phasing out to $0 by $150k); unused losses carry forward. On sale, claimed depreciation is recaptured at up to 25%, and gains may owe capital-gains tax (a 1031 exchange can defer both). Figures are a year-1 estimate at your 24.0% rate — not tax advice; consult a CPA.
Condition & rehab AI · 13 photos
This home is in excellent condition with no visible repairs needed. It's move-in ready and has the potential for further value increases through minor exterior updates.
Value-add opportunities
- Both Painting the exterior — Enhances curb appeal and value
- Both Landscaping the front yard — Improves curb appeal and rental value
- Both Adding a small front porch — Enhances curb appeal and rental value
Renovation cost estimate screening
Value-add ROI direction
- Both Painting the exterior — Enhances curb appeal and value ↑
- Both Landscaping the front yard — Improves curb appeal and rental value ↑
- Both Adding a small front porch — Enhances curb appeal and rental value ↑
ⓘ Cost ranges are severity-bucket heuristics (US national rule-of-thumb). Get contractor quotes + a written scope before underwriting a rehab budget.
Schools (NCES district)
- District
- Escambia
- NCES district ID
- 1200510
- Math proficiency
- 40% ▼ -9.00%
- Reading proficiency
- 45% ▼ -4.00%
- Median HH income
- $44,649
- Composite
- 36.04/100
- National rank
- #4773
- State rank
- #56 of 73 in FL
Livability — Pensacola
- Score
- 83/100
- State rank
- #53
- US rank
- #924
Category grades
Schools grade is shown separately in the Schools card above.
Census & demographics
- Census place
- Pensacola, FL
- County
- Escambia County · 301,722 people
- City population
- 237,636
- Metro
- Pensacola-Ferry Pass-Brent, FL
- Population (ZIP)
- 11,036
- Household income
- $44,139
- Rent vs Own
- Severe rent burden
- 816.0
Population outlook (Escambia County) Hauer SSP2
- Today (2025)
- 334,637 people
- By 2030
- 345,779 · +3.3%
- By 2040
- 364,828 · +9.0%
- By 2050
- 378,514 · +13.1%
- By 2075
- 403,220 · +20.5%
- By 2100
- 386,125 · +15.4%
Race, ethnicity, and origin ACS 2023
- Neighborhood character
- Diverse neighborhood (Simpson 0.62)
- Race & ethnicity
- Black 45% White 42% Two or more races 8% Hispanic / Latino 5%
- Common ancestry
- Subsaharan African 2% Italian 2% Slovak 2%
- Foreign-born
- 2% · Canada, Vietnam
- Languages at home
- 97% English-only · Spanish 2%
Political lean MEDSL · Escambia
- 2024 margin
- R (+19.5) · D 39.7% · R 59.2% · Other 1.1%
- 2008→2024 swing
- -0.2pp no change · 2008: -19.3pp · 2024: -19.5pp
- All cycles
- 2024: R+19.5 2020: R+15.1 2016: R+20.6 2012: R+20.6 2008: R+19.3
Not yet ingested
- Civics
- —
Market trends
- HPI YoY
- ▼ -210.53%
- Current HPI
- 273.0151
- Rent YoY
- ▲ 5.40%
- Metro
- Pensacola-Ferry Pass-Brent, FL
- State GDP YoY
- ▲ 3.28%
- F500 in state
- 36
Industry mix (Fortune 500 HQ in FL)
| Industry | F500 HQs | Revenue |
|---|---|---|
| Industrial Technology | 2 | $29B |
|
||
| Insurance | 2 | $17B |
|
||
| Retail | 1 | $60B |
|
||
| Technology Distribution | 1 | $58B |
|
||
| Homebuilding | 1 | $35B |
|
||
| Technology Manufacturing | 1 | $35B |
|
||
Price history
-38.6% since first listed3 events — show timeline
- 2026-04-29 Contingent — PARMLS
- 2026-03-24 Price Changed $180,000 PARMLS
- 2026-02-06 Listed $293,000 PARMLS
Cash-flow waterfall
monthlySold comps — $/sqft
last 12 mo · ≤1 miLoading sold comps…