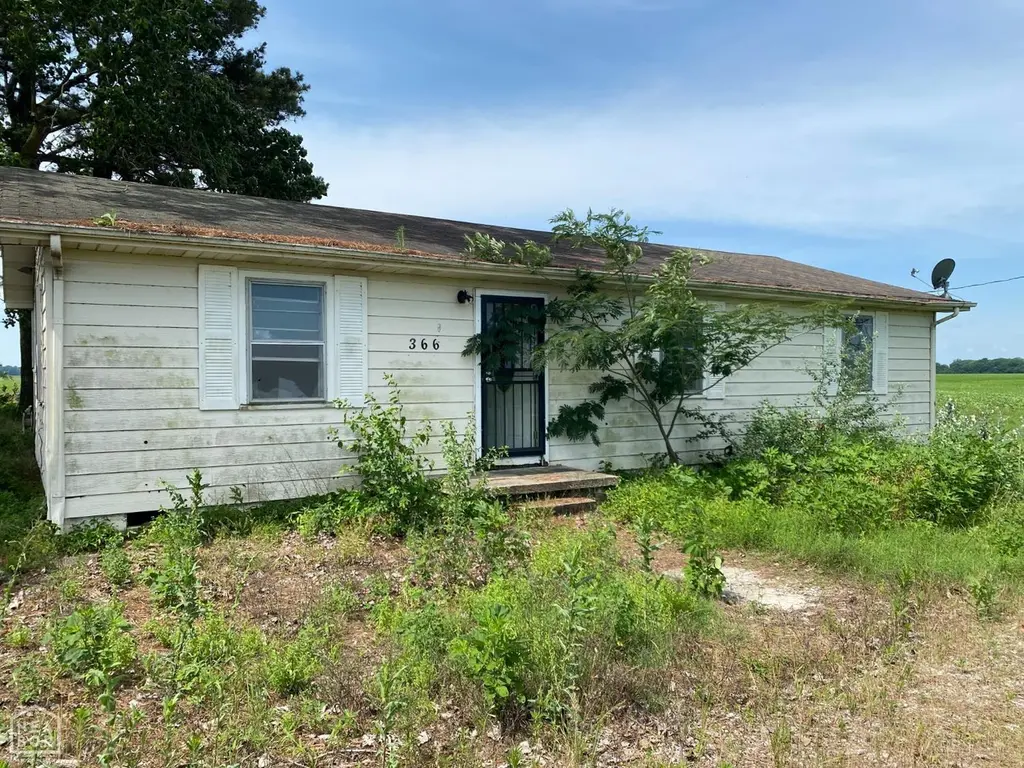
366 Law 532 · Minturn, AR
Flood risk 3/10 · Minor
- FEMA flood zone
- X (unshaded)
- Chance of flooding over 30 yrs
- 0.2%
- Est. flood insurance / yr
- $507 – $1,088
Fire risk 2/10 · Minimal
- Est. fire insurance / yr
- $1,499 – $2,785
Heat risk 5/10 · Moderate
- Hot days now (above 109°F)
- 7 days/yr
- Hot days in 30 yrs
- 20 days/yr
Wind risk 4/10 · Minor
- Chance of severe wind over 30 yrs
- 10.0%
Air-quality risk 1/10 · Minimal
- Unhealthy air days now
- 0 days/yr
- Unhealthy air days in 30 yrs
- 0 days/yr
Risk factors via First Street. Map © Google.
Why this score? — see what drove the D+ grade
The composite is a weighted blend of 9 inputs, each scored 0–100. Each bar is that input's sub-score; the figure is the points it added to the 100-point composite (weight × sub-score).
- Cash flow +15.0/30.0
- ARV discount +7.5/15.0
- Appreciation +5.5/10.0
- 1% rule +5.0/10.0
- DSCR +5.0/10.0
- Livability +2.8/5.0
- Rent growth +2.5/5.0
- Schools +2.5/10.0
- Condition / age +2.5/5.0
$20,000
🖨 Deal sheet 📄 Offer letter ✓ Due diligence
Key facts
- Listed 15 days
Property features AI
Exterior
- Home design: Single-family residence; Residential property
- Construction: Single family construction
- Exterior features: Level lot
Interior
- Bathrooms: 1 full bathroom
- Interior features: Level lot
Neighborhood map
What this means for you Summary
Snapshot
- This is a 2-bed/1.0-bath single-family listed at $20k.
Deal economics
- At list price, monthly cash flow is $771 ($9k/yr) — positive.
- The deal already cash-flows at list — no discount required.
- Meets the 1% rule at list price ($1k rent vs $20k).
- Recommended offer: $20k (1.5% below list) — sets the bar for market timing.
Location & tenants
- Location reads 55/100 on livability (#401 in AR) — a working-class tenant base; expect higher turnover. Strengths: cost of living A+, housing A+; Watch: employment C-, crime F, amenities F.
- Hoxie School District (town): math 30% / reading 30% proficiency, ranked #158 of 238 in AR (top 66%) — families likely to look elsewhere, expect single-tenant / working-renter base with shorter leases; 62% free/reduced lunch — lower-income household profile, screen leases tightly.
- Zoned schools: Hoxie Elementary School (math 44% / reading 28%, grade F, #248 of 454 statewide, top 55%, 502 students, 99% FRL); Hoxie High School (math 18% / reading 31%, grade F, #187 of 292 statewide, top 70%, 366 students, 100% FRL) — zoned schools average 100% FRL vs 62% district-wide (38 pts higher); higher-poverty schools than district average — tighter screening recommended.
- Market conditions: 10 active listings in the ZIP; 63 units permitted in Lawrence County in 2024 (15 in 5+ unit buildings).
Forward outlook
- In year one you build about $341 of equity ($138 loan paydown + $203 appreciation (1.0% local appreciation)).
- Lawrence County population projected at -23% by 2050 — secular population decline; favor cash flow + early exit over multi-decade hold.
- At projected returns (1.0% appreciation + 3.0% rent growth), your $6k cash investment doubles in ~1 year — after that, you're playing with house money.
Negotiation context
- It's been on market 16 days — a 2% lower offer ($20k) is reasonable based on typical stale-listing flexibility.
Risks & watch-outs
- Climate carrying-cost: extreme-heat days projected 7→20/yr by 2055 (HVAC capex compounding) — expect insurance premiums to compound above CPI over the hold.
Questions for the listing agent
- Is there a deadline driving the sale (1031 exchange, divorce, estate, relocation)? That informs how much negotiation room exists.
- Schools are F-rated, which usually means shorter tenancies and higher turnover. Who's the typical renter profile here, and what's been the actual vacancy rate?
- Crime grade is F in this area — have there been break-ins, vandalism, or insurance claims at this property in the last 3 years? What carrier currently insures it and at what premium?
- The area grade is low — what's the realistic commute time and amenity access for the typical tenant pool here? Any planned neighborhood developments (good or bad) we should know about?
- What's the average days-on-market for RENTAL listings here right now (not sales)? A rising rental-DOM trend means longer vacancies and softer asking-rent achievability than the comps imply.
- What's the recent tenant-quality profile in this submarket — average credit score on applications, eviction rate, late-payment / NSF rate, and stable-employment percentage? A property-management company in the area should have these aggregated.
- How much new for-sale + rental construction is in the pipeline within 1–3 miles? Heavy new supply typically softens prices + rents 12–24 months out; constrained supply supports both.
Investment metrics
- 1% rule
- 5.76% ✓
- Cap rate
- 52.56%
- Cash-on-cash
- 165.24%
- DSCR
- 8.35
- GRM
- 1.4
CMA / ARV
- ARV (on-the-fly)
- $94,848
- Comps found
- 1
Show comp detail 1 sale within ~0.75 mi
| Address | Dist | Beds/Ba | Sqft | Sold | Price | $/sf | Match |
|---|---|---|---|---|---|---|---|
| 300 Lawrence CR 511 | 0.16mi | 3/1.0 (+1) | 1,218 (-2%) | 7mo | $93,000 | $76 | 78 |
Match score weights: distance 35% · size 25% · config 20% · recency 20%. Top-matched comps best support the ARV.
Projected returns pro-forma
1.01% appreciation · 3.0% rent growth · sell at horizon
- IRR
- —
- Equity multiple
- 9.84×
- Total profit
- $49,518
- Equity at exit
- $6,841
- IRR
- —
- Equity multiple
- 20.68×
- Total profit
- $110,202
- Equity at exit
- $9,101
Cash invested: $5,600 (down + closing). Projections, not guarantees.
Landlord ↔ Tenant lean methodology
- Overall (STATE)
- 92 Strongly Landlord-Friendly
- State Arkansas
- 92 Strongly Landlord-Friendly · R+14
- County
- — inherits STATE
- City
- — inherits STATE
ZIP-level market 72433
- Home prices YoY
- 0.4%
- Active inventory
- 10
- Price-to-rent
- 1.4×
Monthly cashflow live
- Estimated rent
- $1,151 medium interval (Pro) →
- Mortgage (P&I)
- −$105
- Tax est. 1.5%
- −$25 /mo · $300/yr
- Insurance
- −$8
- HOA
- −$0
- Vacancy / Maint / Mgmt
- −$242
- Net cashflow
- $771
Break-even live
UW: 25.0% down · 7.5% · 30yr · 1.5% tax · 5.0% vac · 8.0% maint · 8.0% mgmt
Financing live
Cash to close
- Down payment
- $5,000
- Closing costs
- $600
- Reserves months
- —
- Total cash needed
- —
Loan-product check · same deal, 3 products live
Conventional
25% down · 7.5% · 30yr
- Down + closing
- —
- Monthly P&I
- —
- Monthly cashflow
- —
- DSCR
- —
- Eligible?
- —
Personal DTI + credit; lowest rate.
DSCR
20% down · 8.5% · 30yr
- Down + closing
- —
- Monthly P&I
- —
- Monthly cashflow
- —
- DSCR
- —
- Eligible?
- —
No personal income docs; deal must DSCR.
Hard money
10% down · 12.0% · 12mo
- Down + closing
- —
- Monthly P&I
- —
- Monthly cashflow
- —
- DSCR
- —
- Eligible?
- —
Short-term bridge; refi at stabilization.
Listing history 12 events
-
2026-06-19days on market $20,000 Active 16 DOM
-
2026-06-18days on market $20,000 Active 15 DOM
-
2026-06-17days on market $20,000 Active 14 DOM
-
2026-06-16days on market $20,000 Active 13 DOM
-
2026-06-15days on market $20,000 Active 12 DOM
-
2026-06-14days on market $20,000 Active 10 DOM
-
2026-06-12days on market $20,000 Active 9 DOM
-
2026-06-09days on market $20,000 Active 6 DOM
-
2026-06-08days on market $20,000 Active 5 DOM
-
2026-06-07days on market $20,000 Active 4 DOM
-
2026-06-05days on market $20,000 Active 2 DOM
-
2026-06-04$20,000 Active 1 DOM
ⓘ Source: listings_history table (triggers on properties + properties_extension) + one-shot
backfill from property_details.listing_events for pre-trigger history.
Climate risk First Street
- Flood 3/10 Moderate FEMA zone X (unshaded) · 20% chance over 30 yrs
- Wildfire 2/10 Low
- Heat 5/10 Major 7 d/yr ≥109°F today · 20 d/yr by 30 yrs out
- Wind 4/10 Moderate 10% chance of damaging wind over 30 yrs
- Air quality 1/10 Low 0 unhealthy d/yr today · 0 by 30 yrs out
Nearby sold comps map
Loading sold comps map…
Walkable amenities ~0.75 mi
Loading nearby amenities…
Taxation est. · year 1
- Rental income
- $13,813
- − Mortgage interest
- −$1,120
- − Property taxes
- −$300
- − Insurance
- −$100
- − Repairs & maintenance
- −$1,105
- − Management
- −$1,105
- − Depreciation
- −$582
- Taxable income
- $9,501
- Est. tax owed @ 24.0%
- −$2,280
- After-tax cash flow
- $6,973/yr
For passive investors: Depreciation is non-cash, so a rental often shows a tax loss while cash-flowing — sheltering income. Rental losses are passive: they offset passive income freely, and up to $25,000/yr can offset ordinary (W-2) income if you actively participate and your MAGI is under $100k (phasing out to $0 by $150k); unused losses carry forward. On sale, claimed depreciation is recaptured at up to 25%, and gains may owe capital-gains tax (a 1031 exchange can defer both). Figures are a year-1 estimate at your 24.0% rate — not tax advice; consult a CPA.
Schools (NCES district)
- District
- Hoxie School District
- NCES district ID
- 0507990
- Math proficiency
- 30% ▼ -10.00%
- Reading proficiency
- 30% ▼ -15.00%
- Median HH income
- $32,220
- Composite
- 24.51/100
- National rank
- #7648
- State rank
- #158 of 238 in AR
Livability — Minturn
- Score
- 55/100
- State rank
- #401
- US rank
- #23108
Category grades
Schools grade is shown separately in the Schools card above.
Census & demographics
- City population
- 61
- Population (ZIP)
- 2,648
Population outlook (Lawrence County) Hauer SSP2
- Today (2025)
- 15,453 people
- By 2030
- 14,697 · -4.9%
- By 2040
- 13,247 · -14.3%
- By 2050
- 11,937 · -22.8%
- By 2075
- 9,466 · -38.7%
- By 2100
- 7,441 · -51.8%
Race, ethnicity, and origin ACS 2023
- Neighborhood character
- Predominantly White (94%)
- Race & ethnicity
- White 94% Two or more races 3% Hispanic / Latino 2% Black 1%
- Common ancestry
- Slovak 3% Romanian 2% Iranian 2%
- Foreign-born
- 2% · Canada
- Languages at home
- 97% English-only · Spanish 2%
Political lean MEDSL · Lawrence
- 2024 margin
- Solid R (+64.0) · D 16.9% · R 81.0% · Other 2.1%
- 2008→2024 swing
- -43.1pp toward R · 2008: -20.9pp · 2024: -64.0pp
- All cycles
- 2024: R+64.0 2020: R+59.6 2016: R+49.8 2012: R+31.6 2008: R+20.9
Not yet ingested
- Civics
- —
Market trends
- HPI YoY
- ▲ 1.01%
- Current HPI
- 229.367
- Rent YoY
- —
- Metro
- —
- State GDP YoY
- ▲ 3.80%
- F500 in state
- 10
Industry mix (Fortune 500 HQ in AR)
| Industry | F500 HQs | Revenue |
|---|---|---|
| Retail | 1 | $681B |
|
||
| Food / Agriculture | 1 | $53B |
|
||
| Retail / Energy | 1 | $22B |
|
||
| Transportation / Logistics | 1 | $12B |
|
||
| Energy | 1 | $4B |
|
||
Price history
1 event — show timeline
- 2026-06-03 Listed $20,000 NEABOR MLS
Cash-flow waterfall
monthlySold comps — $/sqft
last 12 mo · ≤1 miLoading sold comps…