8962 S Hollybrook Blvd #205 · Pembroke Pines, FL
Flood risk 1/10 · Minimal
- FEMA flood zone
- X (shaded)
- Chance of flooding over 30 yrs
- 0.0%
- Est. flood insurance / yr
- $507 – $1,088
Fire risk 1/10 · Minimal
- Est. fire insurance / yr
- $947 – $1,759
Heat risk 9/10 · Severe
- Hot days now (above 105°F)
- 5 days/yr
- Hot days in 30 yrs
- 20 days/yr
Wind risk 10/10 · Severe
- Chance of severe wind over 30 yrs
- 99.0%
Air-quality risk 2/10 · Minimal
- Unhealthy air days now
- 2 days/yr
- Unhealthy air days in 30 yrs
- 2 days/yr
Risk factors via First Street. Map © Google.
Why this score? — see what drove the B grade
The composite is a weighted blend of 9 inputs, each scored 0–100. Each bar is that input's sub-score; the figure is the points it added to the 100-point composite (weight × sub-score).
- Cash flow +30.0/30.0
- 1% rule +10.0/10.0
- DSCR +10.0/10.0
- ARV discount +7.5/15.0
- Livability +4.2/5.0
- Schools +4.1/10.0
- Condition / age +2.5/5.0
- Rent growth +2.3/5.0
- Appreciation +0.0/10.0
$86,900
🖨 Deal sheet 📄 Offer letter ✓ Due diligence
Listing remarks MLS
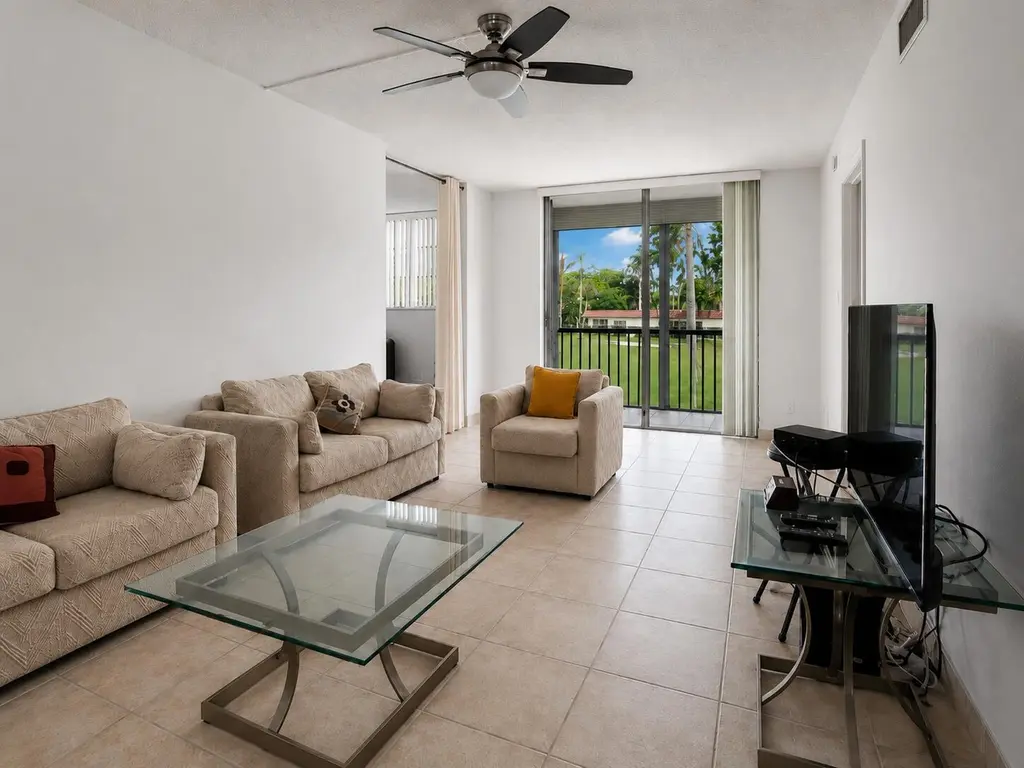
BEAUTIFUL 2 BEDROOM WITH 1.5 BATH CONDO PROPERTY FEATURES GRANITE COUNTERTOP KITCHEN WITH STAINLESS STEEL APPLIANCES, TILES WAS REPLACED 2 YEARS AGO. MASTER BEDROOM HAS A NICE SIZE WALK-IN CLOSET AND MASTER BATHROOM WALLS WAS ALSO RECENTLY REMODELED. ENJOY SOME FRESH BREEZE FROM YOUR SCREENED BALCONY OVER LOOKING THE COMMUNITY GOLF COURSE. SCHEDULE YOUR APPOINTMENT TODAY!! SELLER MOTIVATED!
Key facts
- Charming pond
- New hot water
- Water fountain
Tags
Property features AI
Finance
- Other: Pets allowed with limits; Community contains approximately 1,902 units; Senior community
- HOA & community: Part of Hollybrook Golf & Country Club Condo association; Quarterly HOA fee; Association amenities include: clubhouse, fitness center, golf course, heated pool, pool, sauna, tennis courts, pickleball courts, bocce ball, putting green, jogging path, sidewalks, street lights, gated community, security, courtesy bus, cafe/restaurant, library, billiard room, recreation facilities, storage, laundry, parking, shuffleboard, maintenance, and elevator(s); HOA fees cover: cable TV, grounds maintenance, structure maintenance, security, sewer, trash, water, common areas, elevator, golf, hot water, roof repairs, recreation facility, and pool service
Exterior
- Parking: Assigned parking; Guest parking; 1 open parking space (total 1)
- Security: Security guard; Security patrol; Security gate; Security fence; Smoke detectors
- Utilities: Public water; Public sewer; Cable available; Electricity connected; Sewer connected; Water available
- Home design: Condominium; One level; Faces north; Resale property
- Construction: CBS construction
- Exterior features: Waterfront location; Other roof type
Interior
- Kitchen: Electric range; Microwave; Dishwasher; Garbage disposal; Refrigerator; Electric water heater
- Bedrooms: 2 bedrooms on main level
- Flooring: Ceramic tile; Tile
- Bathrooms: 1 full bathroom; 1 half bathroom
- Heating & cooling: Central heating; Central air; Ceiling fans; Wall/window unit(s)
- Interior features: Entrance foyer; Walk-in closets; Dome kitchen; Partially furnished
- Laundry & utility: Laundry in common area
Neighborhood map
What this means for you Summary
Snapshot
- This is a 2-bed/2.0-bath condo listed at $87k.
Deal economics
- At list price, monthly cash flow is $445 ($5k/yr) — positive.
- The deal already cash-flows at list — no discount required.
- Meets the 1% rule at list price ($2k rent vs $87k).
- Cap rate 12.4% vs local median 4.0% in Pembroke Pines — top-decile yield for the area; either an underpriced asset or a hidden risk that comps aren't pricing in. Stress-test before assuming the spread holds.
Location & tenants
- Location reads 83/100 on livability (#54 in FL, #933 nationally) — a professional / high-income tenant draw. Strengths: housing A+, health & safety A+, crime A-; Watch: amenities D+, cost of living D+.
- Broward (suburban): math 42% / reading 53% proficiency, ranked #46 of 73 in FL (top 63%) — families likely to look elsewhere, expect single-tenant / working-renter base with shorter leases.
- Zoned schools: Palm Cove Elementary School (math 25% / reading 46%, grade F, #1,684 of 2,144 statewide, top 79%, 438 students, 64% FRL); Pines Middle School (math 20% / reading 37%, grade F, #482 of 571 statewide, top 85%, 597 students, 67% FRL); Charles W Flanagan High School (math 29% / reading 50%, grade F, #304 of 667 statewide, top 47%, 2,475 students, 57% FRL).
- Zoned-school proficiency averages 34% at this address vs 48% district-wide (-13 pts) — the specific schools serving this property underperform the Broward average; the district grade overstates school quality for this exact location.
- Market conditions: Rents soft (-0.9%/yr); 438 active listings in the ZIP; 40 comparable units currently listed for rent nearby; rentals at typical pace (median 24d on market — plan ~3-4 weeks tenant-placement turnaround); 2,111 units permitted in Broward County in 2024 (1,265 in 5+ unit buildings).
- This rent runs 39% of the median local income ($69k/yr) — at the standard rent-burdened threshold; future hikes will face affordability resistance.
Forward outlook
- Local home prices are declining (-3.0%/yr); year-one equity from $601 of loan paydown is wiped out by about $3k of value loss. Plan a longer hold.
- Broward County population projected at +34% by 2050 — long-run rental-demand tailwind backs the buy-and-hold thesis.
- At projected returns (-3.0% appreciation + 0.0% rent growth), your $24k cash investment doubles in ~9 years — after that, you're playing with house money.
Negotiation context
- Only 3 days on market — expect competitive offers; lowballing is unlikely to land.
- 4 sale attempts since 7y ago with the ask held roughly flat each time — persistent listings suggest the price (not the market) is what's stuck; bring a comps-based counter.
Risks & watch-outs
- Watch-outs: HOA is 32% of rent.
- Climate carrying-cost: severe wind risk, 99% chance of damaging wind over 30y; extreme-heat days projected 5→20/yr by 2055 (HVAC capex compounding) — expect insurance premiums to compound above CPI over the hold.
Questions for the listing agent
- Built in 1974 — when were the roof, HVAC, electrical panel, plumbing, and water heater last replaced?
- What does the HOA fee cover, when was the last increase, and are there any pending special assessments or reserve-fund shortfalls?
- Any open or pending special assessments — roof, HVAC, plumbing, elevator, façade? What's the per-unit balance and payoff schedule, and is the seller paying it off at close or rolling it to the buyer?
- Is there a deadline driving the sale (1031 exchange, divorce, estate, relocation)? That informs how much negotiation room exists.
- Schools are A-rated — typically a magnet for longer-tenancy family renters. What's the average tenant stay here, and is there a school-zone premium baked into asking?
- What's the average days-on-market for RENTAL listings here right now (not sales)? A rising rental-DOM trend means longer vacancies and softer asking-rent achievability than the comps imply.
- What's the recent tenant-quality profile in this submarket — average credit score on applications, eviction rate, late-payment / NSF rate, and stable-employment percentage? A property-management company in the area should have these aggregated.
- How much new apartment / multifamily construction is in the pipeline within 1–3 miles? Heavy new supply (>2% of stock underway) typically softens rents 12–24 months out; light construction supports rent growth.
Investment metrics
- 1% rule
- 2.58% ✓
- Cap rate
- 12.44%
- Cash-on-cash
- 21.96%
- DSCR
- 1.98
- GRM
- 3.2
CMA / ARV
No comps found within radius.
Projected returns pro-forma
-3.0% appreciation · 0.0% rent growth · sell at horizon
- IRR
- 9.1%
- Equity multiple
- 1.34×
- Total profit
- $8,174
- Equity at exit
- $12,957
- IRR
- 13.5%
- Equity multiple
- 1.83×
- Total profit
- $20,158
- Equity at exit
- $7,514
Cash invested: $24,332 (down + closing). Projections, not guarantees.
Landlord ↔ Tenant lean methodology
- Overall (STATE)
- 87 Strongly Landlord-Friendly
- State Florida
- 87 Strongly Landlord-Friendly · R+3
- County
- — inherits STATE
- City
- — inherits STATE
ZIP-level market 33025
- Rents YoY
- -0.9%
- Active inventory
- 438
- Price-to-rent
- 3.2×
Monthly cashflow live
- Estimated rent
- $2,245 high interval (Pro) →
- Mortgage (P&I)
- −$456
- Tax from tax record
- −$116 /mo · $1,396/yr
- Insurance
- −$36
- HOA
- −$720
- Vacancy / Maint / Mgmt
- −$471
- Net cashflow
- $445
Break-even live
UW: 25.0% down · 7.5% · 30yr · 1.5% tax · 5.0% vac · 8.0% maint · 8.0% mgmt
Financing live
Cash to close
- Down payment
- $21,725
- Closing costs
- $2,607
- Reserves months
- —
- Total cash needed
- —
Loan-product check · same deal, 3 products live
Conventional
25% down · 7.5% · 30yr
- Down + closing
- —
- Monthly P&I
- —
- Monthly cashflow
- —
- DSCR
- —
- Eligible?
- —
Personal DTI + credit; lowest rate.
DSCR
20% down · 8.5% · 30yr
- Down + closing
- —
- Monthly P&I
- —
- Monthly cashflow
- —
- DSCR
- —
- Eligible?
- —
No personal income docs; deal must DSCR.
Hard money
10% down · 12.0% · 12mo
- Down + closing
- —
- Monthly P&I
- —
- Monthly cashflow
- —
- DSCR
- —
- Eligible?
- —
Short-term bridge; refi at stabilization.
Rent comps 40 comps
| Address | Beds | Baths | Sqft | Rent | $/sqft | DOM | Units | Dist |
|---|---|---|---|---|---|---|---|---|
| 681 S Hollybrook Dr #305 Pembroke Pines, FL | 2.0 | 2.0 | 1050 | $1,995 | $1.90 | 24d | 1 | 0.05mi |
| 811 S Hollybrook Dr #208 Pembroke Pines, FL | 2.0 | 2.0 | 1170 | $2,500 | $2.14 | 24d | 1 | 0.07mi |
| 671 S Hollybrook Dr #209 Pembroke Pines, FL | 2.0 | 2.0 | 1170 | $1,900 | $1.62 | 24d | 1 | 0.07mi |
| 8960 S Hollybrook Blvd #301 Pembroke Pines, FL | 2.0 | 2.0 | 1170 | $2,800 | $2.39 | 4d | 1 | 0.08mi |
| 8990 S Hollybrook Blvd Pembroke Pines, FL | 1.0–2.0 | 1.5–2.0 | 1035 | $2,000 | $1.93 | 4d | 2 | 0.11mi |
| 820 S Hollybrook Dr #209 Pembroke Pines, FL | 2.0 | 2.0 | 1170 | $2,900 | $2.48 | 24d | 1 | 0.14mi |
| 8940 S Hollybrook Blvd Pembroke Pines, FL | 2.0 | 2.0 | 1170 | $1,725 | $1.47 | 21d | 2 | 0.16mi |
| 8941 S Hollybrook Blvd #203 Pembroke Pines, FL | 2.0 | 2.0 | 1170 | $2,200 | $1.88 | 24d | 1 | 0.17mi |
| 8941 S Hollybrook Blvd #203 Pembroke Pines, FL | 2.0 | 2.0 | 1170 | $2,200 | $1.88 | 7d | 1 | 0.17mi |
| 381 S Hollybrook Dr #106 Pembroke Pines, FL | 1.0 | 1.5 | 900 | $1,700 | $1.89 | 24d | 1 | 0.17mi |
| 830 S Hollybrook Dr #204 Pembroke Pines, FL | 2.0 | 2.0 | 1170 | $1,700 | $1.45 | 5d | 1 | 0.19mi |
| 830 S Hollybrook Dr #204 Pembroke Pines, FL | 2.0 | 2.0 | 1170 | $1,700 | $1.45 | 24d | 1 | 0.19mi |
| 8900 Washington Blvd #410 Pembroke Pines, FL | 1.0 | 1.5 | 800 | $3,100 | $3.88 | 1d | 1 | 0.20mi |
| 8900 Washington Blvd #410 Pembroke Pines, FL | 1.0 | 1.5 | 800 | $3,100 | $3.88 | 24d | 1 | 0.20mi |
| 400 S Hollybrook Dr #202 Pembroke Pines, FL | 2.0 | 2.0 | 1170 | $1,900 | $1.62 | 24d | 1 | 0.22mi |
| 320 Palm Cir E #320 Pembroke Pines, FL | 2.0 | 2.5 | 1113 | $2,500 | $2.25 | 24d | 1 | 0.25mi |
| 306 Palm Cir E Pembroke Pines, FL | 2.0 | 2.0 | 1016 | $2,250 | $2.21 | 3d | 1 | 0.27mi |
| 351 Palm Way Pembroke Pines, FL | 1.0–2.0 | 1.0–2.0 | 787 | $2,095 | $2.66 | 5d | 2 | 0.29mi |
| 9475 Palm Cir N Unit 9475 Pembroke Pines, FL | 2.0 | 2.5 | 1113 | $2,300 | $2.07 | 3d | 1 | 0.30mi |
| 9475 Palm Cir N Unit 9475 Pembroke Pines, FL | 2.0 | 2.5 | 1113 | $2,400 | $2.16 | 24d | 1 | 0.30mi |
| 9800 N Hollybrook Lake Dr Unit 9-303 Pembroke Pines, FL | 2.0 | 2.0 | 1170 | $1,700 | $1.45 | 24d | 1 | 0.31mi |
| 8886 SW 3rd St #204 Pembroke Pines, FL | 2.0 | 2.0 | 985 | $2,200 | $2.23 | 3d | 1 | 0.33mi |
| 8886 SW 3rd St #204 Pembroke Pines, FL | 2.0 | 2.0 | 985 | $2,200 | $2.23 | 21d | 1 | 0.33mi |
| 306 Palm Cir W Unit 306 Pembroke Pines, FL | 2.0 | 2.0 | 1016 | $2,350 | $2.31 | 24d | 1 | 0.34mi |
| 251 Palm Cir W #206 Pembroke Pines, FL | 2.0 | 2.0 | 1016 | $2,300 | $2.26 | 24d | 1 | 0.34mi |
| 300 Palm Cir W Unit 305 Pembroke Pines, FL | 1.0 | 1.0 | 739 | $1,700 | $2.30 | 11d | 1 | 0.35mi |
| 203 Palm Cir W Unit 203 Pembroke Pines, FL | 2.0 | 2.0 | 1016 | $2,200 | $2.17 | 12d | 1 | 0.36mi |
| 107 Palm Cir W Unit 107 Pembroke Pines, FL | 2.0 | 1.0 | 881 | $2,100 | $2.38 | 24d | 1 | 0.38mi |
| 250 Palm Cir W #204 Pembroke Pines, FL | 1.0 | 1.0 | 739 | $1,700 | $2.30 | 24d | 1 | 0.38mi |
| 8657 SW 5th St Pembroke Pines, FL | 2.0 | 1.0–2.0 | 877 | $2,125 | $2.42 | 21d | 2 | 0.40mi |
| 8710 SW 3rd St #201 Pembroke Pines, FL | 1.0 | 2.0 | 805 | $1,800 | $2.24 | 24d | 1 | 0.40mi |
| 8657 SW 5th St #205 Pembroke Pines, FL | 2.0 | 2.0 | 985 | $2,350 | $2.39 | 18d | 1 | 0.40mi |
| 417 Palm Cir #417 Pembroke Pines, FL | 2.0 | 2.5 | 1113 | $2,275 | $2.04 | 5d | 1 | 0.41mi |
| 9423 S Hollybrook Lake Dr #203 Pembroke Pines, FL | 2.0 | 2.0 | 1170 | $2,000 | $1.71 | 24d | 1 | 0.45mi |
| 101 NW 93rd Ave #106 Pembroke Pines, FL | 2.0 | 2.0 | 787 | $2,200 | $2.80 | 17d | 1 | 0.46mi |
| 142 NW 91st Ave #104 Pembroke Pines, FL | 2.0 | 2.0 | 787 | $2,050 | $2.60 | 24d | 1 | 0.47mi |
| 9117 NW 1st Ct #105 Pembroke Pines, FL | 2.0 | 2.0 | 787 | $1,990 | $2.53 | 14d | 1 | 0.47mi |
| 9220 S Hollybrook Lake Dr #208 Pembroke Pines, FL | 2.0 | 2.0 | 1170 | $1,900 | $1.62 | 24d | 1 | 0.47mi |
| 9420 S Hollybrook Lake Dr #102 Pembroke Pines, FL | 2.0 | 2.0 | 1170 | $2,250 | $1.92 | 15d | 1 | 0.50mi |
| 150 NW 96th Ave Unit 9-203 Pembroke Pines, FL | 2.0 | 2.0 | 1000 | $2,225 | $2.23 | 24d | 1 | 0.51mi |
HOA detail condo
- Monthly dues
- $720 · $8,640/yr
- Assessments
- None detected in remarks — confirm with the listing agent.
Listing history 5 events
-
2026-06-07status $86,900 Pending 3 DOM
-
2026-06-04days on market $86,900 Active 3 DOM
-
2026-06-03days on market $86,900 Active 2 DOM
-
2026-06-02remarks 699-char remark
-
2026-06-02$86,900 Active 1 DOM
ⓘ Source: listings_history table (triggers on properties + properties_extension) + one-shot
backfill from property_details.listing_events for pre-trigger history.
Tax reassessment forecast FL · Resets to sale price
- Current annual tax
- $1,396 · $116/mo
- Projected year-2 tax
- $1,396 · $116/mo
- Expected delta
- $0/yr ($0/mo · 0.0%)
ⓘ Screening estimate from a state-policy table — verify with the county assessor before closing.
Climate risk First Street
- Flood 1/10 Low FEMA zone X (shaded) · 0% chance over 30 yrs
- Wildfire 1/10 Low
- Heat 9/10 Extreme 5 d/yr ≥105°F today · 20 d/yr by 30 yrs out
- Wind 10/10 Extreme 99% chance of damaging wind over 30 yrs
- Air quality 2/10 Low 2 unhealthy d/yr today · 2 by 30 yrs out
Nearby sold comps map
Loading sold comps map…
Walkable amenities ~0.75 mi
Loading nearby amenities…
Taxation est. · year 1
- Rental income
- $26,938
- − Mortgage interest
- −$4,868
- − Property taxes
- −$1,396
- − Insurance
- −$434
- − Repairs & maintenance
- −$2,155
- − Management
- −$2,155
- − HOA
- −$8,640
- − Depreciation
- −$2,528
- Taxable income
- $4,762
- Est. tax owed @ 24.0%
- −$1,143
- After-tax cash flow
- $4,199/yr
For passive investors: Depreciation is non-cash, so a rental often shows a tax loss while cash-flowing — sheltering income. Rental losses are passive: they offset passive income freely, and up to $25,000/yr can offset ordinary (W-2) income if you actively participate and your MAGI is under $100k (phasing out to $0 by $150k); unused losses carry forward. On sale, claimed depreciation is recaptured at up to 25%, and gains may owe capital-gains tax (a 1031 exchange can defer both). Figures are a year-1 estimate at your 24.0% rate — not tax advice; consult a CPA.
Schools (NCES district)
- District
- Broward
- NCES district ID
- 1200180
- Math proficiency
- 42% ▼ -18.00%
- Reading proficiency
- 53% ▼ -5.00%
- Median HH income
- $52,139
- Composite
- 40.88/100
- National rank
- #3621
- State rank
- #46 of 73 in FL
Livability — Pembroke Pines
- Score
- 83/100
- State rank
- #54
- US rank
- #933
Category grades
Schools grade is shown separately in the Schools card above.
Census & demographics
- Census place
- Pembroke Pines, FL
- County
- Broward County · 1,963,430 people
- City population
- 180,224
- Metro
- Miami-Fort Lauderdale-Pompano Beach, FL
- Population (ZIP)
- 76,967
- Household income
- $68,743
- Rent vs Own
- Severe rent burden
- 4834.0
Population outlook (Broward County) Hauer SSP2
- Today (2025)
- 2,207,033 people
- By 2030
- 2,360,704 · +7.0%
- By 2040
- 2,661,208 · +20.6%
- By 2050
- 2,946,698 · +33.5%
- By 2075
- 3,602,273 · +63.2%
- By 2100
- 3,970,984 · +79.9%
Race, ethnicity, and origin ACS 2023
- Neighborhood character
- Diverse neighborhood (Simpson 0.64)
- Race & ethnicity
- Black 44% Hispanic / Latino 39% Two or more races 18% White 11% Asian 3%
- Hispanic origin (detail)
- Puerto Rican 4% Cuban 11% Dominican 3% Salvadoran 1%
- Common ancestry
- Hispanic 8% Italian 1%
- Foreign-born
- 38% · Canada, Jamaica, Dominican Republic
- Languages at home
- 54% English-only · Spanish 35% French/Haitian/Cajun 7% Other Indo-European 1%
Political lean MEDSL · Broward
- 2024 margin
- D (+17.0) · D 58.0% · R 41.0%
- 2008→2024 swing
- -17.8pp toward R · 2008: 34.7pp · 2024: 17.0pp
- All cycles
- 2024: D+17.0 2020: D+29.8 2016: D+35.0 2012: D+34.9 2008: D+34.7
Not yet ingested
- Civics
- —
Market trends
- HPI YoY
- ▼ -246.93%
- Current HPI
- 416.2123
- Rent YoY
- ▼ -0.92%
- Metro
- Miami-Fort Lauderdale-Pompano Beach, FL
- State GDP YoY
- ▲ 3.28%
- F500 in state
- 36
Industry mix (Fortune 500 HQ in FL)
| Industry | F500 HQs | Revenue |
|---|---|---|
| Industrial Technology | 2 | $29B |
|
||
| Insurance | 2 | $17B |
|
||
| Retail | 1 | $60B |
|
||
| Technology Distribution | 1 | $58B |
|
||
| Homebuilding | 1 | $35B |
|
||
| Technology Manufacturing | 1 | $35B |
|
||
Price history
+208.2% since first listed13 events — show timeline
- 2026-06-01 Listed $86,900 Beaches MLS
- 2020-03-27 Sold (Public Records) $87,500 Public Records
- 2020-03-24 Sold (MLS) $87,500 MARMLS
- 2020-03-10 Pending — MARMLS
- 2020-02-05 Relisted — MARMLS
- 2020-01-22 Pending — MARMLS
- 2019-12-04 Listed $99,000 MARMLS
- 2019-11-29 Listing Removed — MARMLS
- 2019-10-30 Price Changed $99,000 MARMLS
- 2019-08-19 Price Changed $105,000 MARMLS
- 2019-06-23 Listed $115,000 MARMLS
- 2001-02-05 Sold (Public Records) $41,000 Public Records
- 1975-11-01 Sold (Public Records) $28,200 Public Records
Property tax history
+5.8%/yrLatest (2025): $1,396 · +3.0% YoY. Source: county tax records.
Cash-flow waterfall
monthlySold comps — $/sqft
last 12 mo · ≤1 miLoading sold comps…