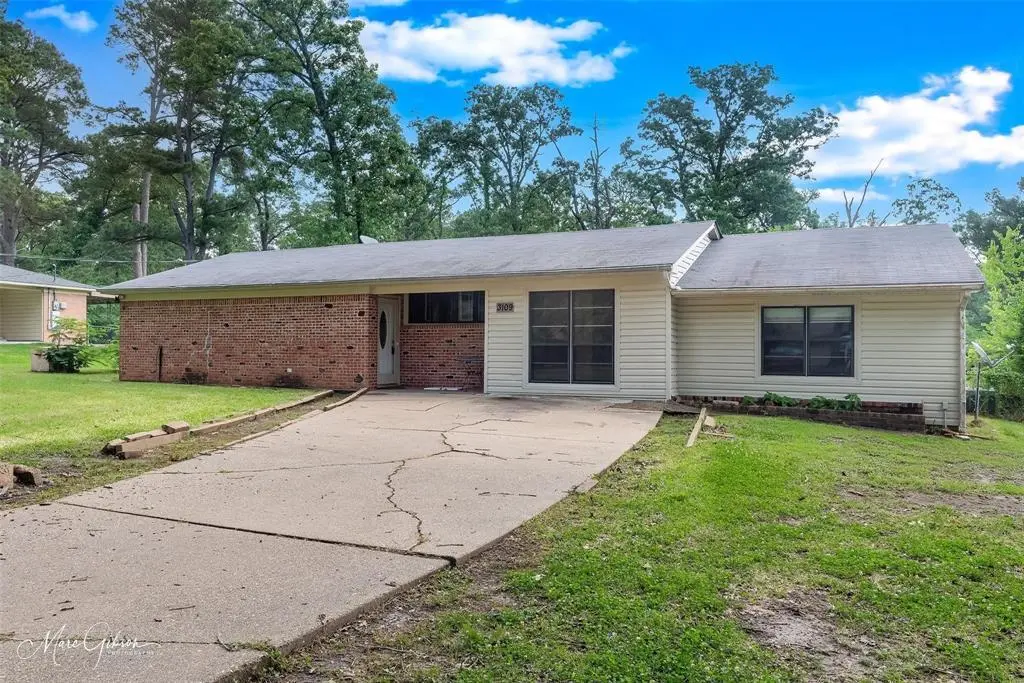
3109 Gorton Rd · Shreveport, LA
Flood risk 1/10 · Minimal
- FEMA flood zone
- X (unshaded)
- Chance of flooding over 30 yrs
- 0.0%
- Est. flood insurance / yr
- $507 – $1,088
Fire risk 3/10 · Minor
- Est. fire insurance / yr
- $1,269 – $2,357
Heat risk 7/10 · Major
- Hot days now (above 110°F)
- 7 days/yr
- Hot days in 30 yrs
- 22 days/yr
Wind risk 6/10 · Moderate
- Chance of severe wind over 30 yrs
- 60.0%
Air-quality risk 2/10 · Minimal
- Unhealthy air days now
- 0 days/yr
- Unhealthy air days in 30 yrs
- 1 days/yr
Risk factors via First Street. Map © Google.
Why this score? — see what drove the C- grade
The composite is a weighted blend of 9 inputs, each scored 0–100. Each bar is that input's sub-score; the figure is the points it added to the 100-point composite (weight × sub-score).
- Cash flow +16.2/30.0
- ARV discount +15.0/15.0
- DSCR +5.0/10.0
- 1% rule +4.3/10.0
- Livability +3.0/5.0
- Rent growth +2.5/5.0
- Condition / age +2.5/5.0
- Schools +2.2/10.0
- Appreciation +0.0/10.0
$159,900
🖨 Deal sheet 📄 Offer letter ✓ Due diligence
Listing remarks
Spacious 4-bedroom, 2.5-bath home in Yarborough Subdivision offering over 2,300 square feet of versatile living space on a large half-acre lot. This unique layout includes multiple living areas and a private split-bedroom setup with its own exterior entrance and private bath, offering flexibility for guests, a home office, or additional privacy. The home features updated flooring throughout much of the property, mature trees, and additional storage space. Conveniently located near Cross Lake, I-20 & I-220, shopping, and restaurants, this property offers space, functionality, and convenience at an affordable price point. With plenty of room to personalize and make it your own, this hom
Key facts
- Large half-acre lot
- Private bath
- Exterior entrance
Tags
Property features AI
Finance
- Other: Seller reserves the mineral rights
- Financial info: Treat as clear loan type; No second mortgage
- HOA & community: No HOA / association
Exterior
- Parking: Concrete parking
- Utilities: City Water; City Sewer; Cable available; Municipal utility district: No
- Home design: Single-family residence; One story; Property attached: Yes; Subdivision: Yarbrough Sub
- Construction: Built in 1955; Preowned
- Exterior features: Half-acre lot (about 0.515 acres); City water and city sewer available; Cable available
Interior
- Kitchen: Refrigerator included
- Bedrooms: 4 bedrooms (Primary bedroom on level 1)
- Bathrooms: 3 total bathrooms (2 full, 1 half)
- Interior features: Kitchen island; Two living areas; One dining area; Family room fireplace
Neighborhood map
What this means for you Summary
Snapshot
- This is a 3-bed/2.0-bath single-family listed at $160k.
Deal economics
- At list price, monthly cash flow is $85 ($1k/yr) — positive.
- The deal already cash-flows at list — no discount required.
- To meet the 1% rule (rent ≥ 1% of price), the offer needs to be $149k (6.6% below list).
- Recommended offer: $149k (6.6% below list) — sets the bar for 1% rule.
- Cap rate 6.9% vs local median 5.7% in Shreveport — meaningfully above typical; check what's discounted (condition, days-on-market, listing class) to confirm the premium yield is real.
Location & tenants
- Location reads 59/100 on livability (#270 in LA) — a working-class tenant base; expect higher turnover. Strengths: cost of living A+, housing A; Watch: schools D+, crime F, amenities F.
- Caddo Parish (urban): math 21% / reading 32% proficiency, ranked #53 of 98 in LA (top 54%) — low school quality limits family demand, transient renter base, plan for 1-2y turnover; 64% free/reduced lunch — lower-income household profile, screen leases tightly.
- Market conditions: 156 active listings in the ZIP; 221 units permitted in Caddo Parish in 2024 (0 in 5+ unit buildings).
Forward outlook
- Local home prices are declining (-3.0%/yr); year-one equity from $1k of loan paydown is wiped out by about $5k of value loss. Plan a longer hold.
- Caddo County population projected at -15% by 2050 — secular population decline; favor cash flow + early exit over multi-decade hold.
Negotiation context
- It's been on market 26 days — a 2% lower offer ($158k) is reasonable based on typical stale-listing flexibility.
- 6 sale attempts since 2y ago with the ask held roughly flat each time — persistent listings suggest the price (not the market) is what's stuck; bring a comps-based counter.
- Current owner paid $90k; list at $160k implies a 78% gain — meaningful room to come down on a strong offer.
Risks & watch-outs
- Watch-outs: built in 1955 — expect roof / HVAC / electrical / plumbing capex.
- Climate carrying-cost: major wind risk, 60% chance of damaging wind over 30y; extreme-heat days projected 7→22/yr by 2055 (HVAC capex compounding) — expect insurance premiums to compound above CPI over the hold.
Questions for the listing agent
- Built in 1955 — when were the roof, HVAC, electrical panel, plumbing, and water heater last replaced?
- Is there a deadline driving the sale (1031 exchange, divorce, estate, relocation)? That informs how much negotiation room exists.
- Schools are D-rated, which usually means shorter tenancies and higher turnover. Who's the typical renter profile here, and what's been the actual vacancy rate?
- Crime grade is F in this area — have there been break-ins, vandalism, or insurance claims at this property in the last 3 years? What carrier currently insures it and at what premium?
- What's the average days-on-market for RENTAL listings here right now (not sales)? A rising rental-DOM trend means longer vacancies and softer asking-rent achievability than the comps imply.
- What's the recent tenant-quality profile in this submarket — average credit score on applications, eviction rate, late-payment / NSF rate, and stable-employment percentage? A property-management company in the area should have these aggregated.
- How much new for-sale + rental construction is in the pipeline within 1–3 miles? Heavy new supply typically softens prices + rents 12–24 months out; constrained supply supports both.
Investment metrics
- 1% rule
- 0.93% ✗
- Cap rate
- 6.93%
- Cash-on-cash
- 2.28%
- DSCR
- 1.10
- GRM
- 8.9
CMA / ARV
- ARV (median comp)
- $212,489
- List price
- $159,900
- Delta
- -24.75%
- Verdict
- UNDERPRICED
- Comps
- 20 within 1.0 mi
Show comp detail 4 sales within ~0.75 mi
| Address | Dist | Beds/Ba | Sqft | Sold | Price | $/sf | Match |
|---|---|---|---|---|---|---|---|
| 3132 Sandra Dr | 0.06mi | 4/2.5 (+1) | 2,349 (-14%) | 8mo | $205,000 | $87 | 60 |
| 3044 Gorton Rd | 0.23mi | 4/3.0 (+1) | 2,448 (-11%) | 23mo | $189,900 | $78 | 43 |
| 3305 Pines Rd | 0.40mi | 3/2.0 | 2,389 (-13%) | 20mo | $230,000 | $96 | 43 |
| 3404 Sandra Dr | 0.64mi | 4/3.0 (+1) | 2,472 (-10%) | 19mo | $249,000 | $101 | 28 |
Match score weights: distance 35% · size 25% · config 20% · recency 20%. Top-matched comps best support the ARV.
Projected returns pro-forma
-3.0% appreciation · 3.0% rent growth · sell at horizon
- IRR
- -12.7%
- Equity multiple
- 0.54×
- Total profit
- $-20,488
- Equity at exit
- $23,842
- IRR
- -3.6%
- Equity multiple
- 0.76×
- Total profit
- $-10,813
- Equity at exit
- $13,825
Cash invested: $44,772 (down + closing). Projections, not guarantees.
Landlord ↔ Tenant lean methodology
- Overall (STATE)
- 90 Strongly Landlord-Friendly
- State Louisiana
- 90 Strongly Landlord-Friendly · R+12
- County
- — inherits STATE
- City
- — inherits STATE
ZIP-level market 71119
- Home prices YoY
- -25.7%
- Active inventory
- 156
- Price-to-rent
- 8.9×
Monthly cashflow live
- Estimated rent
- $1,493 medium interval (Pro) →
- Mortgage (P&I)
- −$839
- Tax from tax record
- −$190 /mo · $2,276/yr
- Insurance
- −$67
- HOA
- −$0
- Vacancy / Maint / Mgmt
- −$314
- Net cashflow
- $85
Break-even live
UW: 25.0% down · 7.5% · 30yr · 1.5% tax · 5.0% vac · 8.0% maint · 8.0% mgmt
Financing live
Cash to close
- Down payment
- $39,975
- Closing costs
- $4,797
- Reserves months
- —
- Total cash needed
- —
Loan-product check · same deal, 3 products live
Conventional
25% down · 7.5% · 30yr
- Down + closing
- —
- Monthly P&I
- —
- Monthly cashflow
- —
- DSCR
- —
- Eligible?
- —
Personal DTI + credit; lowest rate.
DSCR
20% down · 8.5% · 30yr
- Down + closing
- —
- Monthly P&I
- —
- Monthly cashflow
- —
- DSCR
- —
- Eligible?
- —
No personal income docs; deal must DSCR.
Hard money
10% down · 12.0% · 12mo
- Down + closing
- —
- Monthly P&I
- —
- Monthly cashflow
- —
- DSCR
- —
- Eligible?
- —
Short-term bridge; refi at stabilization.
Listing history 25 events
-
2026-06-09status $159,900 Pending 26 DOM
-
2026-06-08days on market $159,900 Active Contingent 26 DOM
-
2026-06-07days on market $159,900 Active Contingent 25 DOM
-
2026-06-05days on market $159,900 Active Contingent 22 DOM
-
2026-06-03days on market $159,900 Active Contingent 21 DOM
-
2026-06-02days on market $159,900 Active Contingent 20 DOM
-
2026-06-01days on market $159,900 Active Contingent 19 DOM
-
2026-05-31days on market $159,900 Active Contingent 18 DOM
-
2026-05-30days on market $159,900 Active Contingent 17 DOM
-
2026-05-13$159,900 Active 826-char remark
-
2026-05-13historical
-
2026-05-06$159,900 Active
-
2026-05-04historical $2,000
-
2026-05-03historical
-
2026-02-10$2,000
-
2026-02-05status Active
-
2026-01-27historical Active Contingent
-
2026-01-20price $159,900
-
2025-05-03$173,900 Active
-
2024-10-27price $174,000
-
2024-09-26price $179,000
-
2024-09-12price $189,000
-
2024-08-22$199,000 Active
-
2020-11-04soldstatus $90,000
-
2006-11-02soldstatus
ⓘ Source: listings_history table (triggers on properties + properties_extension) + one-shot
backfill from property_details.listing_events for pre-trigger history.
Tax reassessment forecast LA · Resets to sale price
- Current annual tax
- $2,276 · $190/mo
- Projected year-2 tax
- $2,276 · $190/mo
- Expected delta
- $0/yr ($0/mo · 0.0%)
ⓘ Screening estimate from a state-policy table — verify with the county assessor before closing.
Climate risk First Street
- Flood 1/10 Low FEMA zone X (unshaded) · 0% chance over 30 yrs
- Wildfire 3/10 Moderate
- Heat 7/10 Severe 7 d/yr ≥110°F today · 22 d/yr by 30 yrs out
- Wind 6/10 Major 60% chance of damaging wind over 30 yrs
- Air quality 2/10 Low 0 unhealthy d/yr today · 1 by 30 yrs out
Nearby sold comps map
Loading sold comps map…
Walkable amenities ~0.75 mi
Loading nearby amenities…
Taxation est. · year 1
- Rental income
- $17,919
- − Mortgage interest
- −$8,957
- − Property taxes
- −$2,276
- − Insurance
- −$800
- − Repairs & maintenance
- −$1,434
- − Management
- −$1,434
- − Depreciation
- −$4,652
- Taxable loss
- −$1,632
- Est. tax savings @ 24.0%
- +$392
- After-tax cash flow
- $1,410/yr
For passive investors: Depreciation is non-cash, so a rental often shows a tax loss while cash-flowing — sheltering income. Rental losses are passive: they offset passive income freely, and up to $25,000/yr can offset ordinary (W-2) income if you actively participate and your MAGI is under $100k (phasing out to $0 by $150k); unused losses carry forward. On sale, claimed depreciation is recaptured at up to 25%, and gains may owe capital-gains tax (a 1031 exchange can defer both). Figures are a year-1 estimate at your 24.0% rate — not tax advice; consult a CPA.
Schools (NCES district)
- District
- Caddo Parish
- NCES district ID
- 2200300
- Math proficiency
- 21% ▼ -33.00%
- Reading proficiency
- 32% ▼ -30.00%
- Median HH income
- $39,227
- Composite
- 22.23/100
- National rank
- #8148
- State rank
- #53 of 98 in LA
Livability — Shreveport
- Score
- 59/100
- State rank
- #270
- US rank
- #19730
Category grades
Schools grade is shown separately in the Schools card above.
Census & demographics
- Census place
- Shreveport, LA
- City population
- 164,123
- Population (ZIP)
- 10,364
Population outlook (Caddo County) Hauer SSP2
- Today (2025)
- 243,190 people
- By 2030
- 237,231 · -2.5%
- By 2040
- 222,502 · -8.5%
- By 2050
- 206,516 · -15.1%
- By 2075
- 165,706 · -31.9%
- By 2100
- 122,262 · -49.7%
Race, ethnicity, and origin ACS 2023
- Neighborhood character
- Majority Black (60%)
- Race & ethnicity
- Black 60% White 34% Asian 3% Two or more races 2% Hispanic / Latino 2%
- Common ancestry
- Lithuanian 2% Italian 1% Slovak 1%
- Foreign-born
- 0%
- Languages at home
- 98% English-only · Spanish 1%
Political lean MEDSL · Caddo
- 2024 margin
- Toss-up / Even · D 51.6% · R 47.0% · Other 1.4%
- 2008→2024 swing
- +1.6pp toward D · 2008: 3.0pp · 2024: 4.6pp
- All cycles
- 2024: D+4.6 2020: D+6.8 2016: D+4.2 2012: D+4.9 2008: D+3.0
Not yet ingested
- Civics
- —
Market trends
- HPI YoY
- ▼ -44.76%
- Current HPI
- 129.6866
- Rent YoY
- —
- Metro
- —
- State GDP YoY
- ▲ 3.29%
- F500 in state
- 10
Industry mix (Fortune 500 HQ in LA)
| Industry | F500 HQs | Revenue |
|---|---|---|
| Telecommunications | 2 | $23B |
|
||
| Utilities | 1 | $12B |
|
||
| Wholesale / Distribution | 1 | $5B |
|
||
| Advertising | 1 | $2B |
|
||
Price history
+77.7% since first listed18 events — show timeline
- 2026-06-09 Pending — NTREIS
- 2026-05-28 Contingent — NTREIS
- 2026-05-13 Listing Removed — NTREIS
- 2026-05-13 Listed $159,900 NTREIS
- 2026-05-06 Listed $159,900 NTREIS
- 2026-05-04 Rental Removed $2,000 NTREIS
- 2026-05-03 Listing Removed — NTREIS
- 2026-02-10 Listed for Rent $2,000 NTREIS
- 2026-02-05 Relisted — NTREIS
- 2026-01-27 Contingent — NTREIS
- 2026-01-20 Price Changed $159,900 NTREIS
- 2025-05-03 Listed $173,900 NTREIS
- 2024-10-27 Price Changed $174,000 NTREIS
- 2024-09-26 Price Changed $179,000 NTREIS
- 2024-09-12 Price Changed $189,000 NTREIS
- 2024-08-22 Listed $199,000 NTREIS
- 2020-11-04 Sold (Public Records) $90,000 Public Records
- 2006-11-02 Sold (Public Records) — Public Records
Property tax history
+6.5%/yrLatest (2025): $2,276 · +0.4% YoY. Source: county tax records.
Cash-flow waterfall
monthlySold comps — $/sqft
last 12 mo · ≤1 miLoading sold comps…