697 Branton Dr · Shelby, NC
Flood risk 1/10 · Minimal
- FEMA flood zone
- X (unshaded)
- Chance of flooding over 30 yrs
- 0.0%
- Est. flood insurance / yr
- $507 – $1,088
Fire risk 3/10 · Minor
- Est. fire insurance / yr
- $906 – $1,684
Heat risk 6/10 · Moderate
- Hot days now (above 104°F)
- 7 days/yr
- Hot days in 30 yrs
- 17 days/yr
Wind risk 3/10 · Minor
- Chance of severe wind over 30 yrs
- 4.0%
Air-quality risk 3/10 · Minor
- Unhealthy air days now
- 3 days/yr
- Unhealthy air days in 30 yrs
- 3 days/yr
Risk factors via First Street. Map © Google.
Why this score? — see what drove the C- grade
The composite is a weighted blend of 9 inputs, each scored 0–100. Each bar is that input's sub-score; the figure is the points it added to the 100-point composite (weight × sub-score).
- ARV discount +15.0/15.0
- Cash flow +14.9/30.0
- DSCR +4.6/10.0
- Schools +4.0/10.0
- Livability +3.8/5.0
- 1% rule +3.5/10.0
- Rent growth +2.5/5.0
- Condition / age +2.5/5.0
- Appreciation +0.0/10.0
$170,000
🖨 Deal sheet (PDF) 📄 Offer letter ✓ Due diligence
Listing remarks
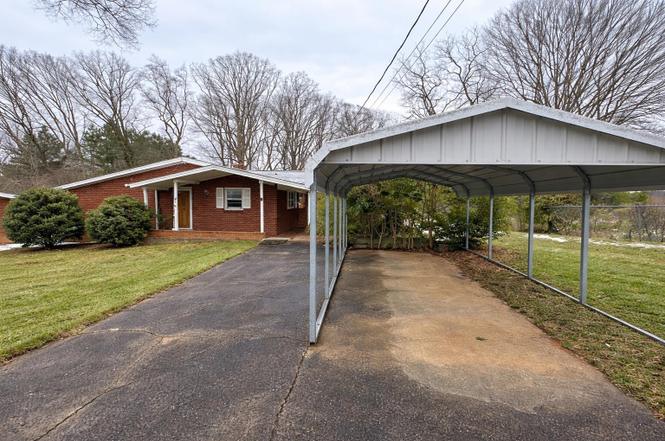
Calling all investors, renovators, and visionaries! This fixer-upper sits on a . 28-acre lot and is full of potential for the right buyer. With a solid layout and plenty of space to work with, this home is ready for a transformation. Whether you’re looking to renovate and resell, create a rental, or design a home tailored to your own style, this property offers the perfect canvas. The spacious lot provides room to expand, improve outdoor living, or enhance curb appeal. Convenient location close to town amenities. Bring your ideas and unlock the potential — sold as-is.
Key facts
- Solid layout
- Spacious lot
- 28-acre lot
Tags
Neighborhood map
What this means for you Summary
Snapshot
- This is a 3-bed/1.5-bath single-family listed at $170k.
Deal economics
- At list price, monthly cash flow is $51 ($606/yr) — positive.
- The deal already cash-flows at list — no discount required.
- To meet the 1% rule (rent ≥ 1% of price), the offer needs to be $144k (15.1% below list).
- Recommended offer: $144k (15.1% below list) — sets the bar for 1% rule.
- Cap rate 6.6% vs local median 2.9% in Shelby — top-decile yield for the area; either an underpriced asset or a hidden risk that comps aren't pricing in. Stress-test before assuming the spread holds.
Location & tenants
- Location reads 75/100 on livability (#52 in NC, #4,349 nationally) — a middle-class / working-renter tenant base. Strengths: commute A+, cost of living A+, housing A+; Watch: crime F, employment F.
- Cleveland County Schools (rural): math 47% / reading 49% proficiency, ranked #76 of 178 in NC (top 43%) — families likely to look elsewhere, expect single-tenant / working-renter base with shorter leases.
- Zoned schools: Graham Elementary (math 17% / reading 27%); Shelby Middle (math 25% / reading 42%, grade F, #299 of 475 statewide, top 64%, 630 students, 81% FRL); Shelby High (math 17% / reading 52%, grade F, #427 of 535 statewide, top 81%, 825 students, 65% FRL).
- Zoned-school proficiency averages 30% at this address vs 48% district-wide (-18 pts) — the specific schools serving this property underperform the Cleveland County Schools average; the district grade overstates school quality for this exact location.
- Market conditions: 199 active listings in the ZIP; 461 units permitted in Cleveland County in 2024 (38 in 5+ unit buildings).
Forward outlook
- Local home prices are declining (-3.0%/yr); year-one equity from $1k of loan paydown is wiped out by about $5k of value loss. Plan a longer hold.
- Cleveland County population projected at -15% by 2050 — secular population decline; favor cash flow + early exit over multi-decade hold.
Negotiation context
- It's been on market 61 days — a 6% lower offer ($160k) is reasonable based on typical stale-listing flexibility.
- 2 sale attempts with the ask held roughly flat each time — persistent listings suggest the price (not the market) is what's stuck; bring a comps-based counter.
Risks & watch-outs
- Climate carrying-cost: extreme-heat days projected 7→17/yr by 2055 (HVAC capex compounding) — expect insurance premiums to compound above CPI over the hold.
Questions for the listing agent
- It's been on market 61 days. Have you received any prior offers? Is the seller open to a 15% concession, seller financing, or rate buy-down credit?
- Why hasn't it sold? Are there any deal-killer items the seller is aware of (foundation, flood, title, zoning, code violations)?
- Is there a deadline driving the sale (1031 exchange, divorce, estate, relocation)? That informs how much negotiation room exists.
- Schools are D-rated, which usually means shorter tenancies and higher turnover. Who's the typical renter profile here, and what's been the actual vacancy rate?
- Crime grade is F in this area — have there been break-ins, vandalism, or insurance claims at this property in the last 3 years? What carrier currently insures it and at what premium?
- What's the average days-on-market for RENTAL listings here right now (not sales)? A rising rental-DOM trend means longer vacancies and softer asking-rent achievability than the comps imply.
- What's the recent tenant-quality profile in this submarket — average credit score on applications, eviction rate, late-payment / NSF rate, and stable-employment percentage? A property-management company in the area should have these aggregated.
- How much new for-sale + rental construction is in the pipeline within 1–3 miles? Heavy new supply typically softens prices + rents 12–24 months out; constrained supply supports both.
Investment metrics
- 1% rule
- 0.85% ✗
- Cap rate
- 6.65%
- Cash-on-cash
- 1.27%
- DSCR
- 1.06
- GRM
- 9.8
CMA / ARV
- ARV (on-the-fly)
- $250,656
- Comps found
- 12
Show comp detail 12 sales within ~0.75 mi
| Address | Dist | Beds/Ba | Sqft | Sold | Price | $/sf | Match |
|---|---|---|---|---|---|---|---|
| 1408 Lackey St | 0.22mi | 3/2.0 | 1,416 (-5%) | 6mo | $272,000 | $192 | 74 |
| 602 Charles Rd | 0.21mi | 4/3.0 (+1) | 1,546 (+4%) | 5mo | $220,000 | $142 | 69 |
| 505 Melody Ln | 0.14mi | 3/2.0 | 1,645 (+10%) | 11mo | $300,000 | $182 | 66 |
| 901 W Elm St | 0.57mi | 3/2.0 | 1,548 (+4%) | 1mo | $240,000 | $155 | 64 |
| 1309 Briarcliff Rd | 0.37mi | 3/2.0 | 1,432 (-4%) | 13mo | $235,500 | $164 | 63 |
| 1106 Ladell Ln | 0.59mi | 3/2.0 | 1,526 (+2%) | 9mo | $270,000 | $177 | 59 |
| 1400 Lackey St | 0.24mi | 4/2.0 (+1) | 1,668 (+12%) | 12mo | $279,900 | $168 | 52 |
| 804 Kirby St | 0.63mi | 3/2.0 | 1,629 (+9%) | 1mo | $273,000 | $168 | 52 |
| 300 Westside Dr | 0.51mi | 3/2.0 | 1,322 (-11%) | 4mo | $279,000 | $211 | 52 |
| 712 Maynard St | 0.71mi | 3/2.5 | 1,648 (+10%) | 5mo | $267,000 | $162 | 41 |
| 506 Gold St | 0.67mi | 3/1.0 | 1,305 (-12%) | 10mo | $140,000 | $107 | 38 |
| 1153 N Woodhill Dr | 0.62mi | 3/1.0 | 1,278 (-14%) | 10mo | $217,500 | $170 | 37 |
Match score weights: distance 35% · size 25% · config 20% · recency 20%. Top-matched comps best support the ARV.
Projected returns pro-forma
-3.0% appreciation · 3.0% rent growth · sell at horizon
- IRR
- -14.3%
- Equity multiple
- 0.49×
- Total profit
- $-24,361
- Equity at exit
- $25,348
- IRR
- -5.6%
- Equity multiple
- 0.64×
- Total profit
- $-17,195
- Equity at exit
- $14,698
Cash invested: $47,600 (down + closing). Projections, not guarantees.
Landlord ↔ Tenant lean methodology
- Overall (STATE)
- 85 Strongly Landlord-Friendly
- State North Carolina
- 85 Strongly Landlord-Friendly · R+3
- County
- — inherits STATE
- City
- — inherits STATE
ZIP-level market 28152
- Home prices YoY
- -34.4%
- Active inventory
- 199
- Price-to-rent
- 9.8×
Monthly cashflow live
- Estimated rent
- $1,443 medium interval (Pro) →
- Mortgage (P&I)
- −$891
- Tax from tax record
- −$128 /mo · $1,530/yr
- Insurance
- −$71
- HOA
- −$0
- Vacancy / Maint / Mgmt
- −$303
- Net cashflow
- $51
Break-even live
Sensitivity live
| Price | -10% $147 | -5% $99 | +0% $51 | +5% $2 | +10% $-46 |
|---|---|---|---|---|---|
| Rent | -10% $-64 | -5% $-7 | +0% $51 | +5% $108 | +10% $165 |
| Rate | -1.0pp $136 | -0.5pp $94 | base $51 | +0.5pp $6 | +1.0pp $-38 |
UW: 25.0% down · 7.5% · 30yr · 1.5% tax · 5.0% vac · 8.0% maint · 8.0% mgmt
Financing live
Cash to close
- Down payment
- $42,500
- Closing costs
- $5,100
- Reserves months
- —
- Total cash needed
- —
Loan-product check · same deal, 3 products live
Conventional
25% down · 7.5% · 30yr
- Down + closing
- —
- Monthly P&I
- —
- Monthly cashflow
- —
- DSCR
- —
- Eligible?
- —
Personal DTI + credit; lowest rate.
DSCR
20% down · 8.5% · 30yr
- Down + closing
- —
- Monthly P&I
- —
- Monthly cashflow
- —
- DSCR
- —
- Eligible?
- —
No personal income docs; deal must DSCR.
Hard money
10% down · 12.0% · 12mo
- Down + closing
- —
- Monthly P&I
- —
- Monthly cashflow
- —
- DSCR
- —
- Eligible?
- —
Short-term bridge; refi at stabilization.
Listing history 4 events
-
2026-04-27status Pending
-
2026-02-25$170,000 Active
-
2025-09-22price $190,000
-
2025-07-29$250,000 Active
ⓘ Source: listings_history table (triggers on properties + properties_extension) + one-shot
backfill from property_details.listing_events for pre-trigger history.
Tax reassessment forecast NC · Resets to sale price
- Current annual tax
- $1,530 · $128/mo
- Projected year-2 tax
- $1,530 · $128/mo
- Expected delta
- $0/yr ($0/mo · 0.0%)
ⓘ Screening estimate from a state-policy table — verify with the county assessor before closing.
Climate risk First Street
- Flood 1/10 Low FEMA zone X (unshaded) · 0% chance over 30 yrs
- Wildfire 3/10 Moderate
- Heat 6/10 Major 7 d/yr ≥104°F today · 17 d/yr by 30 yrs out
- Wind 3/10 Moderate 4% chance of damaging wind over 30 yrs
- Air quality 3/10 Moderate 3 unhealthy d/yr today · 3 by 30 yrs out
Nearby sold comps map
Loading sold comps map…
Walkable amenities ~0.75 mi
Loading nearby amenities…
Taxation est. · year 1
- Rental income
- $17,322
- − Mortgage interest
- −$9,523
- − Property taxes
- −$1,530
- − Insurance
- −$850
- − Repairs & maintenance
- −$1,386
- − Management
- −$1,386
- − Depreciation
- −$4,945
- Taxable loss
- −$2,298
- Est. tax savings @ 24.0%
- +$552
- After-tax cash flow
- $1,158/yr
For passive investors: Depreciation is non-cash, so a rental often shows a tax loss while cash-flowing — sheltering income. Rental losses are passive: they offset passive income freely, and up to $25,000/yr can offset ordinary (W-2) income if you actively participate and your MAGI is under $100k (phasing out to $0 by $150k); unused losses carry forward. On sale, claimed depreciation is recaptured at up to 25%, and gains may owe capital-gains tax (a 1031 exchange can defer both). Figures are a year-1 estimate at your 24.0% rate — not tax advice; consult a CPA.
Schools (NCES district)
- District
- Cleveland County Schools
- NCES district ID
- 3700900
- Math proficiency
- 47% ▬ 0.00%
- Reading proficiency
- 49% ▲ 4.00%
- Median HH income
- $38,501
- Composite
- 40.03/100
- National rank
- #3823
- State rank
- #76 of 178 in NC
Livability — Shelby
- Score
- 75/100
- State rank
- #52
- US rank
- #4349
Category grades
Schools grade is shown separately in the Schools card above.
Census & demographics
- Census place
- Shelby, NC
- County
- Cleveland County · 83,736 people
- City population
- 26,134
- Metro
- Shelby, NC
- Population (ZIP)
- 26,134
- Household income
- $57,806
- Rent vs Own
- Severe rent burden
- 768.0
Population outlook (Cleveland County) Hauer SSP2
- Today (2025)
- 93,671 people
- By 2030
- 91,157 · -2.7%
- By 2040
- 85,519 · -8.7%
- By 2050
- 79,708 · -14.9%
- By 2075
- 68,317 · -27.1%
- By 2100
- 57,145 · -39.0%
Race, ethnicity, and origin ACS 2023
- Neighborhood character
- Predominantly White (65%)
- Race & ethnicity
- White 65% Black 22% Two or more races 9% Hispanic / Latino 3%
- Common ancestry
- Slovak 2% Lithuanian 2% Serbian 1%
- Foreign-born
- 2% · Canada
- Languages at home
- 96% English-only · Spanish 3% Other Indo-European 1%
Political lean MEDSL · Cleveland
- 2024 margin
- Solid R (+35.0) · D 32.2% · R 67.2%
- 2008→2024 swing
- -15.1pp toward R · 2008: -19.9pp · 2024: -35.0pp
- All cycles
- 2024: R+35.0 2020: R+32.8 2016: R+30.6 2012: R+20.5 2008: R+19.9
Not yet ingested
- Civics
- —
Market trends
- HPI YoY
- ▼ -116.69%
- Current HPI
- 223.0302
- Rent YoY
- —
- Metro
- Shelby, NC
- State GDP YoY
- ▲ 3.28%
- F500 in state
- 26
Industry mix (Fortune 500 HQ in NC)
| Industry | F500 HQs | Revenue |
|---|---|---|
| Financial Services | 2 | $213B |
|
||
| Retail | 2 | $95B |
|
||
| Industrial Conglomerate | 1 | $38B |
|
||
| Metals / Steel | 1 | $35B |
|
||
| Utilities | 1 | $30B |
|
||
| Industrial Machinery | 1 | $19B |
|
||
Price history
-32.0% since first listed4 events — show timeline
- 2026-04-27 Pending — SPMLS
- 2026-02-25 Listed $170,000 SPMLS
- 2025-09-22 Price Changed $190,000 CANOPYMLS as Distributed by MLS Grid
- 2025-07-29 Listed $250,000 CANOPYMLS as Distributed by MLS Grid
Property tax history
+11.3%/yrLatest (2025): $1,530 · +42.0% YoY. Source: county tax records.
Cash-flow waterfall
monthlySold comps — $/sqft
last 12 mo · ≤1 miLoading sold comps…