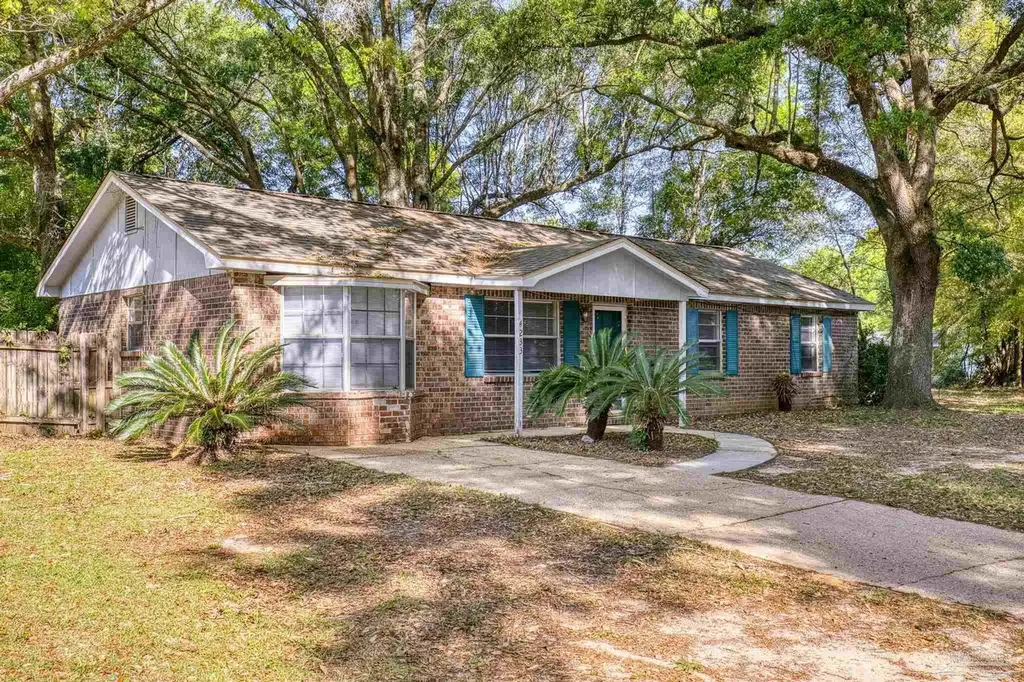
4233 W Avenida De Golf · Pea Ridge, FL
Flood risk 1/10 · Minimal
- FEMA flood zone
- X (unshaded)
- Chance of flooding over 30 yrs
- 0.0%
- Est. flood insurance / yr
- $507 – $1,088
Fire risk 3/10 · Minor
- Est. fire insurance / yr
- $947 – $1,759
Heat risk 10/10 · Severe
- Hot days now (above 105°F)
- 7 days/yr
- Hot days in 30 yrs
- 21 days/yr
Wind risk 9/10 · Severe
- Chance of severe wind over 30 yrs
- 99.0%
Air-quality risk 1/10 · Minimal
- Unhealthy air days now
- 0 days/yr
- Unhealthy air days in 30 yrs
- 0 days/yr
Risk factors via First Street. Map © Google.
Why this score? — see what drove the B grade
The composite is a weighted blend of 9 inputs, each scored 0–100. Each bar is that input's sub-score; the figure is the points it added to the 100-point composite (weight × sub-score).
- Cash flow +27.2/30.0
- ARV discount +15.0/15.0
- DSCR +9.5/10.0
- 1% rule +6.1/10.0
- Schools +5.3/10.0
- Livability +3.5/5.0
- Rent growth +3.2/5.0
- Condition / age +2.5/5.0
- Appreciation +0.0/10.0
$180,000
🖨 Deal sheet (PDF) 📄 Offer letter ✓ Due diligence
Listing remarks MLS
Lovely home with ceramic tile, new carpet, fresh paint, office and workshop. Beautiful shaded lot with majestic Live Oak trees. Brand new roof and A/C. Perfect for the 1st time home buyer!
Key facts
- Generous lot
- Spacious kitchen
- All brick home
Tags
Neighborhood map
What this means for you Summary
Snapshot
- This is a 3-bed/2.0-bath single-family listed at $180k.
Deal economics
- At list price, monthly cash flow is $515 ($6k/yr) — positive.
- The deal already cash-flows at list — no discount required.
- Meets the 1% rule at list price ($2k rent vs $180k).
- Cap rate 9.7% vs local median 4.5% in Pea Ridge — top-decile yield for the area; either an underpriced asset or a hidden risk that comps aren't pricing in. Stress-test before assuming the spread holds.
Location & tenants
- Location reads 69/100 on livability (#459 in FL) — a middle-class / working-renter tenant base. Strengths: cost of living A+, housing A+, crime A-; Watch: schools D-, amenities F, commute F.
- Santa Rosa (suburban): math 63% / reading 60% proficiency, ranked #8 of 73 in FL (top 11%) — acceptable for families but not a draw, mixed tenant base, ~2y average lease.
- Market conditions: Rents rising (+2.7%/yr); 665 active listings in the ZIP; 17 comparable units currently listed for rent nearby; rentals at typical pace (median 15d on market — plan ~3-4 weeks tenant-placement turnaround); solid renter incomes; 1,983 units permitted in Santa Rosa County in 2024 (128 in 5+ unit buildings).
Forward outlook
- Local home prices are declining (-3.0%/yr); year-one equity from $1k of loan paydown is wiped out by about $5k of value loss. Plan a longer hold.
- Santa Rosa County population projected at +31% by 2050 — long-run rental-demand tailwind backs the buy-and-hold thesis.
- At projected returns (-3.0% appreciation + 2.7% rent growth), your $50k cash investment doubles in ~10 years — after that, you're playing with house money.
Negotiation context
- Only 6 days on market — expect competitive offers; lowballing is unlikely to land.
- 4 sale attempts since 21y ago with the ask held roughly flat each time — persistent listings suggest the price (not the market) is what's stuck; bring a comps-based counter.
- Current owner paid $100k; list at $180k implies a 80% gain — meaningful room to come down on a strong offer.
Risks & watch-outs
- Climate carrying-cost: severe wind risk, 99% chance of damaging wind over 30y; extreme-heat days projected 7→21/yr by 2055 (HVAC capex compounding) — expect insurance premiums to compound above CPI over the hold.
Questions for the listing agent
- Built in 1977 — when were the roof, HVAC, electrical panel, plumbing, and water heater last replaced?
- Is there a deadline driving the sale (1031 exchange, divorce, estate, relocation)? That informs how much negotiation room exists.
- Schools are D-rated, which usually means shorter tenancies and higher turnover. Who's the typical renter profile here, and what's been the actual vacancy rate?
- What's the average days-on-market for RENTAL listings here right now (not sales)? A rising rental-DOM trend means longer vacancies and softer asking-rent achievability than the comps imply.
- What's the recent tenant-quality profile in this submarket — average credit score on applications, eviction rate, late-payment / NSF rate, and stable-employment percentage? A property-management company in the area should have these aggregated.
- How much new for-sale + rental construction is in the pipeline within 1–3 miles? Heavy new supply typically softens prices + rents 12–24 months out; constrained supply supports both.
Investment metrics
- 1% rule
- 1.11% ✓
- Cap rate
- 9.73%
- Cash-on-cash
- 12.26%
- DSCR
- 1.55
- GRM
- 7.5
CMA / ARV
- ARV (on-the-fly)
- $219,700
- Comps found
- 12
Show comp detail 12 sales within ~0.75 mi
| Address | Dist | Beds/Ba | Sqft | Sold | Price | $/sf | Match |
|---|---|---|---|---|---|---|---|
| 4233 W Avenida De Golf | 0.00mi | 3/2.0 | 1,300 (0%) | 1mo | $181,500 | $140 | 100 |
| 5270 Barcelona St | 0.29mi | 3/2.0 | 1,353 (+4%) | 4mo | $228,000 | $169 | 76 |
| 4364 W Avenida De Golf | 0.42mi | 3/1.5 | 1,325 (+2%) | 2mo | $225,000 | $170 | 74 |
| 5306 Catalina St | 0.52mi | 3/1.0 | 1,326 (+2%) | 3mo | $150,000 | $113 | 66 |
| 4361 W Avenida De Golf | 0.44mi | 3/1.5 | 1,371 (+6%) | 3mo | $204,000 | $149 | 66 |
| 4412 Copperwood Pl | 0.33mi | 3/2.0 | 1,442 (+11%) | 4mo | $305,000 | $212 | 63 |
| 4344 Chantilly Way | 0.60mi | 3/2.0 | 1,380 (+6%) | 2mo | $245,000 | $178 | 60 |
| 4460 Santa Villa Dr | 0.49mi | 3/1.5 | 1,400 (+8%) | 4mo | $215,000 | $154 | 60 |
| 4327 Chantilly Way | 0.54mi | 3/2.0 | 1,385 (+6%) | 6mo | $210,000 | $152 | 59 |
| 5247 Catalina St | 0.58mi | 3/2.0 | 1,430 (+10%) | 3mo | $251,000 | $176 | 54 |
| 5301 E Avenida De Golf | 0.42mi | 3/2.0 | 1,492 (+15%) | 4mo | $221,000 | $148 | 52 |
| 4079 Huckleberry Finn Rd | 0.74mi | 3/2.0 | 1,477 (+14%) | 6mo | $302,400 | $205 | 38 |
Match score weights: distance 35% · size 25% · config 20% · recency 20%. Top-matched comps best support the ARV.
Projected returns pro-forma
-3.0% appreciation · 2.72% rent growth · sell at horizon
- IRR
- 1.5%
- Equity multiple
- 1.06×
- Total profit
- $2,980
- Equity at exit
- $26,839
- IRR
- 10.9%
- Equity multiple
- 1.84×
- Total profit
- $42,198
- Equity at exit
- $15,563
Cash invested: $50,400 (down + closing). Projections, not guarantees.
Landlord ↔ Tenant lean methodology
- Overall (STATE)
- 87 Strongly Landlord-Friendly
- State Florida
- 87 Strongly Landlord-Friendly · R+3
- County
- — inherits STATE
- City
- — inherits STATE
ZIP-level market 32571
- Home prices YoY
- -17.7%
- Rents YoY
- 2.7%
- Active inventory
- 665
- Price-to-rent
- 7.5×
Monthly cashflow live
- Estimated rent
- $1,998 high interval (Pro) →
- Mortgage (P&I)
- −$944
- Tax from tax record
- −$45 /mo · $539/yr
- Insurance
- −$75
- HOA
- −$0
- Vacancy / Maint / Mgmt
- −$420
- Net cashflow
- $515
Break-even live
Sensitivity live
| Price | -10% $617 | -5% $566 | +0% $515 | +5% $464 | +10% $413 |
|---|---|---|---|---|---|
| Rent | -10% $357 | -5% $436 | +0% $515 | +5% $594 | +10% $673 |
| Rate | -1.0pp $605 | -0.5pp $561 | base $515 | +0.5pp $468 | +1.0pp $421 |
UW: 25.0% down · 7.5% · 30yr · 1.5% tax · 5.0% vac · 8.0% maint · 8.0% mgmt
Financing live
Cash to close
- Down payment
- $45,000
- Closing costs
- $5,400
- Reserves months
- —
- Total cash needed
- —
Loan-product check · same deal, 3 products live
Conventional
25% down · 7.5% · 30yr
- Down + closing
- —
- Monthly P&I
- —
- Monthly cashflow
- —
- DSCR
- —
- Eligible?
- —
Personal DTI + credit; lowest rate.
DSCR
20% down · 8.5% · 30yr
- Down + closing
- —
- Monthly P&I
- —
- Monthly cashflow
- —
- DSCR
- —
- Eligible?
- —
No personal income docs; deal must DSCR.
Hard money
10% down · 12.0% · 12mo
- Down + closing
- —
- Monthly P&I
- —
- Monthly cashflow
- —
- DSCR
- —
- Eligible?
- —
Short-term bridge; refi at stabilization.
Rent comps 17 comps
| Address | Beds | Baths | Sqft | Rent | $/sqft | DOM | Units | Dist |
|---|---|---|---|---|---|---|---|---|
| 4933 Bell Ridge Ln Milton, FL | 1.0–3.0 | 1.0–2.0 | 865 | $1,437 | $1.66 | 15d | 8 | 0.94mi |
| 4530 Chantilly Way Milton, FL | 3.0 | 2.0 | 1629 | $1,750 | $1.07 | 24d | 1 | 1.02mi |
| 5061 Peach Dr Milton, FL | 3.0 | 2.5 | 1581 | $1,850 | $1.17 | 24d | 1 | 1.07mi |
| 4836 Covenant Cir Milton, FL | 3.0 | 2.0 | 1590 | $1,875 | $1.18 | 15d | 1 | 1.10mi |
| 4624 Malay Cir Milton, FL | 4.0 | 2.0 | 1787 | $2,085 | $1.17 | 15d | 1 | 1.24mi |
| 5157 Peach Dr Milton, FL | 3.0 | 2.0 | 1788 | $2,100 | $1.17 | 15d | 1 | 1.24mi |
| 4413 Oak Vista Ln Milton, FL | 1.0–3.0 | 1.0–2.0 | 992 | $2,354 | $2.37 | 15d | 18 | 1.25mi |
| 5320 Cornwall Dr Milton, FL | 3.0 | 2.0 | 1703 | $2,200 | $1.29 | 15d | 1 | 1.28mi |
| 3984 Pendragon Cir Unit 1 Milton, FL | 3.0 | 2.5 | 1537 | $1,800 | $1.17 | 22d | 1 | 1.30mi |
| 4355 Park Ct Trlr Park , FL | 2.0 | 1.5 | 1000 | $1,200 | $1.20 | 24d | 1 | 1.34mi |
| 3863 Pendragon Cir , FL | 3.0 | 2.5 | 1579 | $2,500 | $1.58 | 24d | 1 | 1.34mi |
| 4051 Pendragon Cir Milton, FL | 3.0 | 2.5 | 1530 | $1,800 | $1.18 | 15d | 1 | 1.38mi |
| 4185 Pendragon Cir Unit Alisha walker Milton, FL | 3.0 | 2.5 | 1553 | $1,800 | $1.16 | 15d | 1 | 1.39mi |
| 4067 Pendragon Cir Milton, FL | 3.0 | 2.5 | 1537 | $1,800 | $1.17 | 15d | 1 | 1.39mi |
| 4167 Pendragon Cir Milton, FL | 3.0 | 2.5 | 1553 | $1,800 | $1.16 | 15d | 1 | 1.39mi |
| 5240 Peach Dr Unit NA Milton, FL | 4.0 | 2.0 | 1800 | $2,175 | $1.21 | 24d | 1 | 1.42mi |
| 5604 Shooting Star Ct Milton, FL | 3.0 | 2.0 | 1324 | $2,300 | $1.74 | 15d | 1 | 1.48mi |
Listing history 12 events
-
2026-04-22status Pending
-
2026-04-16$180,000 Active
-
2026-01-31historical $1,495
-
2026-01-29historical $1,495
-
2026-01-10$1,495
-
2026-01-10$1,495
-
2005-08-30soldstatus $100,000
-
2005-08-12soldstatus $100,000 191-char remark
Show marketing remark (191 chars)
Lovely home with ceramic tile, new carpet, fresh paint, office and workshop. Beautiful shaded lot with majestic Live Oak trees. Brand new roof and A/C. Perfect for the 1st time home buyer!
-
2005-04-19$109,900 191-char remark
Show marketing remark (191 chars)
Lovely home with ceramic tile, new carpet, fresh paint, office and workshop. Beautiful shaded lot with majestic Live Oak trees. Brand new roof and A/C. Perfect for the 1st time home buyer!
-
2000-04-03soldstatus $56,800
-
1986-01-01soldstatus $36,000
-
1977-12-01soldstatus $22,900
ⓘ Source: listings_history table (triggers on properties + properties_extension) + one-shot
backfill from property_details.listing_events for pre-trigger history.
Tax reassessment forecast FL · Resets to sale price
- Current annual tax
- $539 · $45/mo
- Projected year-2 tax
- $1,494 · $124/mo
- Expected delta
- +$955/yr (+$80/mo · 177.2%)
ⓘ Screening estimate from a state-policy table — verify with the county assessor before closing.
Climate risk First Street
- Flood 1/10 Low FEMA zone X (unshaded) · 0% chance over 30 yrs
- Wildfire 3/10 Moderate
- Heat 10/10 Extreme 7 d/yr ≥105°F today · 21 d/yr by 30 yrs out
- Wind 9/10 Extreme 99% chance of damaging wind over 30 yrs
- Air quality 1/10 Low 0 unhealthy d/yr today · 0 by 30 yrs out
Nearby sold comps map
Loading sold comps map…
Walkable amenities ~0.75 mi
Loading nearby amenities…
Taxation est. · year 1
- Rental income
- $23,980
- − Mortgage interest
- −$10,083
- − Property taxes
- −$539
- − Insurance
- −$900
- − Repairs & maintenance
- −$1,918
- − Management
- −$1,918
- − Depreciation
- −$5,236
- Taxable income
- $3,385
- Est. tax owed @ 24.0%
- −$812
- After-tax cash flow
- $5,365/yr
For passive investors: Depreciation is non-cash, so a rental often shows a tax loss while cash-flowing — sheltering income. Rental losses are passive: they offset passive income freely, and up to $25,000/yr can offset ordinary (W-2) income if you actively participate and your MAGI is under $100k (phasing out to $0 by $150k); unused losses carry forward. On sale, claimed depreciation is recaptured at up to 25%, and gains may owe capital-gains tax (a 1031 exchange can defer both). Figures are a year-1 estimate at your 24.0% rate — not tax advice; consult a CPA.
Schools (NCES district)
- District
- Santa Rosa
- NCES district ID
- 1201650
- Math proficiency
- 63% ▼ -6.00%
- Reading proficiency
- 60% ▼ -5.00%
- Median HH income
- $58,161
- Composite
- 53.12/100
- National rank
- #1511
- State rank
- #8 of 73 in FL
Livability — Pea Ridge
- Score
- 69/100
- State rank
- #459
- US rank
- #8316
Category grades
Schools grade is shown separately in the Schools card above.
Census & demographics
- Census place
- Pea Ridge, FL
- County
- Santa Rosa County · 194,764 people
- Metro
- Pensacola-Ferry Pass-Brent, FL
- Population (ZIP)
- 42,171
- Household income
- $87,617
- Rent vs Own
- Severe rent burden
- 301.0
Population outlook (Santa Rosa County) Hauer SSP2
- Today (2025)
- 195,978 people
- By 2030
- 209,782 · +7.0%
- By 2040
- 235,293 · +20.1%
- By 2050
- 256,408 · +30.8%
- By 2075
- 298,074 · +52.1%
- By 2100
- 303,216 · +54.7%
Race, ethnicity, and origin ACS 2023
- Neighborhood character
- Predominantly White (80%)
- Race & ethnicity
- White 80% Two or more races 9% Hispanic / Latino 6% Black 4% Asian 2%
- Hispanic origin (detail)
- Mexican 3%
- Common ancestry
- Lithuanian 4% Italian 3% Slovak 2%
- Foreign-born
- 6% · Canada, South Korea
- Languages at home
- 93% English-only · Spanish 2% Other Indo-European 1% Russian/Polish/Slavic 1%
Political lean MEDSL · Santa Rosa
- 2024 margin
- Solid R (+51.0) · D 24.1% · R 75.0%
- 2008→2024 swing
- -3.0pp toward R · 2008: -47.9pp · 2024: -51.0pp
- All cycles
- 2024: R+51.0 2020: R+46.5 2016: R+53.5 2012: R+52.6 2008: R+47.9
Not yet ingested
- Civics
- —
Market trends
- HPI YoY
- ▼ -62.39%
- Current HPI
- 290.2953
- Rent YoY
- ▲ 2.72%
- Metro
- Pensacola-Ferry Pass-Brent, FL
- State GDP YoY
- ▲ 3.28%
- F500 in state
- 36
Industry mix (Fortune 500 HQ in FL)
| Industry | F500 HQs | Revenue |
|---|---|---|
| Industrial Technology | 2 | $29B |
|
||
| Insurance | 2 | $17B |
|
||
| Retail | 1 | $60B |
|
||
| Technology Distribution | 1 | $58B |
|
||
| Homebuilding | 1 | $35B |
|
||
| Technology Manufacturing | 1 | $35B |
|
||
Price history
+686.0% since first listed12 events — show timeline
- 2026-04-22 Pending — PARMLS
- 2026-04-16 Listed $180,000 PARMLS
- 2026-01-31 Rental Removed $1,495 TENANTTURNER2
- 2026-01-29 Rental Removed $1,495 PARMLS
- 2026-01-10 Listed for Rent $1,495 TENANTTURNER2
- 2026-01-10 Listed for Rent $1,495 PARMLS
- 2005-08-30 Sold (Public Records) $100,000 Public Records
- 2005-08-12 Sold (MLS) $100,000 PARMLS
- 2005-04-19 Listed $109,900 PARMLS
- 2000-04-03 Sold (Public Records) $56,800 Public Records
- 1986-01-01 Sold (Public Records) $36,000 Public Records
- 1977-12-01 Sold (Public Records) $22,900 Public Records
Property tax history
+1.4%/yrLatest (2025): $539 · +2.1% YoY. Source: county tax records.
Cash-flow waterfall
monthlySold comps — $/sqft
last 12 mo · ≤1 miLoading sold comps…