10412 White Lake Ct · Westchase, FL
Flood risk 1/10 · Minimal
- FEMA flood zone
- X (unshaded)
- Chance of flooding over 30 yrs
- 0.0%
- Est. flood insurance / yr
- $507 – $1,088
Fire risk 3/10 · Minor
- Est. fire insurance / yr
- $947 – $1,759
Heat risk 10/10 · Severe
- Hot days now (above 107°F)
- 7 days/yr
- Hot days in 30 yrs
- 28 days/yr
Wind risk 10/10 · Severe
- Chance of severe wind over 30 yrs
- 99.0%
Air-quality risk 3/10 · Minor
- Unhealthy air days now
- 3 days/yr
- Unhealthy air days in 30 yrs
- 3 days/yr
Risk factors via First Street. Map © Google.
Why this score? — see what drove the F grade
The composite is a weighted blend of 9 inputs, each scored 0–100. Each bar is that input's sub-score; the figure is the points it added to the 100-point composite (weight × sub-score).
- ARV discount +7.5/15.0
- Schools +4.2/10.0
- Livability +3.7/5.0
- 1% rule +2.9/10.0
- Condition / age +2.5/5.0
- Rent growth +1.3/5.0
- Cash flow +1.0/30.0
- DSCR +0.0/10.0
- Appreciation +0.0/10.0
$265,000
🖨 Deal sheet 📄 Offer letter ✓ Due diligence
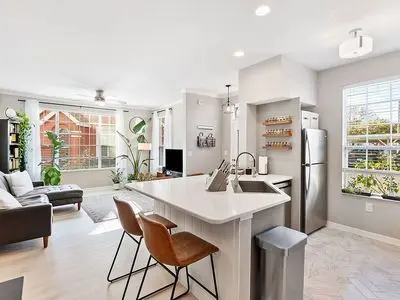
Listing remarks
Charming First-Floor Condo with Modern Upgrades: This beautifully renovated first-story condo offers the perfect blend of modern updates and cozy charm, just 50 feet from lake access in a gated community. Interior Highlights: Recently renovated with stylish finishes Elegant quartz countertops in the kitchen Whirlpool & amp; Frigidaire appliances (all just 3 years old) Herringbone-patterned kitchen floor for added character Board & amp; batten and shiplap accents throughout New closet storage for optimal organization Washer & amp; dryer included Significant storage space with 2 pantries Convenience & amp; Community: Parking just 15 feet from the front door First-floor acces
Key facts
- Gated community
- Whirlpool appliances
- Lake access
Tags
Neighborhood map
What this means for you Summary
Snapshot
- This is a 2-bed/2.0-bath condo listed at $265k.
Deal economics
- At list price, monthly cash flow is $-1k ($-13k/yr) — negative.
- To cash-flow at today's rent, offer at most $250k (5.8% below list).
- To meet the 1% rule (rent ≥ 1% of price), the offer needs to be $211k (20.6% below list).
- Recommended offer: $211k (20.6% below list) — sets the bar for 1% rule.
Location & tenants
- Location reads 73/100 on livability (#320 in FL) — a middle-class / working-renter tenant base. Strengths: crime A+, employment A+, housing A+; Watch: amenities F, commute F, cost of living F.
- Hillsborough (suburban): math 47% / reading 50% proficiency, ranked #41 of 73 in FL (top 56%) — families likely to look elsewhere, expect single-tenant / working-renter base with shorter leases.
- Market conditions: Rents falling (-4.7%/yr); 205 active listings in the ZIP; 31 comparable units currently listed for rent nearby; rentals at typical pace (median 16d on market — plan ~3-4 weeks tenant-placement turnaround); high-income renter base; 9,053 units permitted in Hillsborough County in 2024 (4,555 in 5+ unit buildings).
Forward outlook
- Local home prices are declining (-3.0%/yr); year-one equity from $2k of loan paydown is wiped out by about $8k of value loss. Plan a longer hold.
- Hillsborough County population projected at +37% by 2050 — long-run rental-demand tailwind backs the buy-and-hold thesis.
Negotiation context
- It's been on market 34 days — a 3% lower offer ($257k) is reasonable based on typical stale-listing flexibility.
Risks & watch-outs
- Watch-outs: HOA is 48% of rent.
- Climate carrying-cost: severe wind risk, 99% chance of damaging wind over 30y; extreme-heat days projected 7→28/yr by 2055 (HVAC capex compounding) — expect insurance premiums to compound above CPI over the hold.
Questions for the listing agent
- What do current leases actually rent for vs. the listed asking? Can we see a recent rent roll and the last 12 months of T-12 income?
- It's been on market 34 days. Have you received any prior offers? Is the seller open to a 21% concession, seller financing, or rate buy-down credit?
- What does the HOA fee cover, when was the last increase, and are there any pending special assessments or reserve-fund shortfalls?
- Any open or pending special assessments — roof, HVAC, plumbing, elevator, façade? What's the per-unit balance and payoff schedule, and is the seller paying it off at close or rolling it to the buyer?
- Is there a deadline driving the sale (1031 exchange, divorce, estate, relocation)? That informs how much negotiation room exists.
- The area grade is low — what's the realistic commute time and amenity access for the typical tenant pool here? Any planned neighborhood developments (good or bad) we should know about?
- What's the average days-on-market for RENTAL listings here right now (not sales)? A rising rental-DOM trend means longer vacancies and softer asking-rent achievability than the comps imply.
- What's the recent tenant-quality profile in this submarket — average credit score on applications, eviction rate, late-payment / NSF rate, and stable-employment percentage? A property-management company in the area should have these aggregated.
- How much new apartment / multifamily construction is in the pipeline within 1–3 miles? Heavy new supply (>2% of stock underway) typically softens rents 12–24 months out; light construction supports rent growth.
Investment metrics
- 1% rule
- 0.79% ✗
- Cap rate
- 1.34%
- Cash-on-cash
- -17.68%
- DSCR
- 0.21
- GRM
- 10.5
CMA / ARV
No comps found within radius.
Projected returns pro-forma
-3.0% appreciation · 0.0% rent growth · sell at horizon
- IRR
- -57.7%
- Equity multiple
- -0.59×
- Total profit
- $-118,124
- Equity at exit
- $39,512
- IRR
- —
- Equity multiple
- -1.88×
- Total profit
- $-213,906
- Equity at exit
- $22,912
Cash invested: $74,200 (down + closing). Projections, not guarantees.
Landlord ↔ Tenant lean methodology
- Overall (STATE)
- 87 Strongly Landlord-Friendly
- State Florida
- 87 Strongly Landlord-Friendly · R+3
- County
- — inherits STATE
- City
- — inherits STATE
ZIP-level market 33626
- Home prices YoY
- -30.6%
- Rents YoY
- -4.7%
- Active inventory
- 205
- Price-to-rent
- 10.5×
Monthly cashflow live
- Estimated rent
- $2,105 high interval (Pro) →
- Mortgage (P&I)
- −$1,390
- Tax from tax record
- −$250 /mo · $3,002/yr
- Insurance
- −$110
- HOA est. from 1 same-building comp
- −$1,006
- Vacancy / Maint / Mgmt
- −$442
- Net cashflow
- $-1,093
Break-even live
UW: 25.0% down · 7.5% · 30yr · 1.5% tax · 5.0% vac · 8.0% maint · 8.0% mgmt
Financing live
Cash to close
- Down payment
- $66,250
- Closing costs
- $7,950
- Reserves months
- —
- Total cash needed
- —
Loan-product check · same deal, 3 products live
Conventional
25% down · 7.5% · 30yr
- Down + closing
- —
- Monthly P&I
- —
- Monthly cashflow
- —
- DSCR
- —
- Eligible?
- —
Personal DTI + credit; lowest rate.
DSCR
20% down · 8.5% · 30yr
- Down + closing
- —
- Monthly P&I
- —
- Monthly cashflow
- —
- DSCR
- —
- Eligible?
- —
No personal income docs; deal must DSCR.
Hard money
10% down · 12.0% · 12mo
- Down + closing
- —
- Monthly P&I
- —
- Monthly cashflow
- —
- DSCR
- —
- Eligible?
- —
Short-term bridge; refi at stabilization.
Rent comps 31 comps
| Address | Beds | Baths | Sqft | Rent | $/sqft | DOM | Units | Dist |
|---|---|---|---|---|---|---|---|---|
| 10412 White Lake Ct #10412 Tampa, FL | 2.0 | 2.0 | 1140 | $2,500 | $2.19 | 24d | 1 | 0.03mi |
| 10440 White Lake Ct #10440 Tampa, FL | 2.0 | 2.0 | 1140 | $1,700 | $1.49 | 2d | 1 | 0.03mi |
| 10440 White Lake Ct Tampa, FL | 2.0 | 2.0 | 1140 | $1,700 | $1.49 | 1d | 1 | 0.04mi |
| 9744 Lake Chase Island Way Tampa, FL | 2.0 | 2.0 | 1140 | $1,900 | $1.67 | 17d | 1 | 0.07mi |
| 10534 White Lake Ct #10534 Tampa, FL | 2.0 | 2.0 | 1373 | $1,995 | $1.45 | 24d | 1 | 0.08mi |
| 10462 White Lake Ct Tampa, FL | 2.0 | 2.0 | 1168 | $1,975 | $1.69 | 24d | 1 | 0.08mi |
| 9646 Lake Chase Island Way Unit 9646 Tampa, FL | 3.0 | 2.0 | 1373 | $2,200 | $1.60 | 4d | 1 | 0.10mi |
| 9068 Lake Chase Island Way Tampa, FL | 2.0 | 2.0 | 1140 | $2,000 | $1.75 | 24d | 1 | 0.13mi |
| 9108 Lake Chase Island Way #9108 Tampa, FL | 1.0 | 1.0 | 904 | $1,500 | $1.66 | 4d | 1 | 0.21mi |
| 11905 Cypress Vista Tampa, FL | 2.0 | 1.5 | 1200 | $2,495 | $2.08 | 4d | 1 | 0.33mi |
| 11804 Cypress Hill Cir #45 Tampa, FL | 2.0 | 1.5 | 960 | $1,700 | $1.77 | 24d | 1 | 0.42mi |
| 8801 Citrus Village Dr Tampa, FL | 1.0–3.0 | 1.0–2.0 | 1144 | $1,998 | $1.75 | 1d | 36 | 0.46mi |
| 11013 Blaine Top Pl Tampa, FL | 2.0 | 2.5 | 1147 | $2,100 | $1.83 | 4d | 1 | 0.74mi |
| 11003 Blaine Top Pl Tampa, FL | 2.0 | 2.5 | 1147 | $2,200 | $1.92 | 24d | 1 | 0.75mi |
| 10142 Montague St Unit 1475289P Westchase, FL | 2.0 | 2.0 | 1345 | $4,115 | $3.06 | 15d | 1 | 0.84mi |
| 12011 Citrus Falls Cir Tampa, FL | 1.0–3.0 | 1.0–2.0 | 966 | $1,884 | $1.95 | 2d | 27 | 0.93mi |
| 9874 Montague St Unit 1475279P Tampa, FL | 3.0 | 2.0 | 1345 | $4,126 | $3.07 | 1d | 1 | 1.02mi |
| 8741 Exposition Dr Tampa, FL | 3.0 | 2.0 | 1366 | $2,450 | $1.79 | 2d | 1 | 1.05mi |
| 9508 W Park Village Dr #107 Tampa, FL | 3.0 | 2.0 | 1279 | $2,475 | $1.94 | 23d | 1 | 1.06mi |
| 8735 Exposition Dr Tampa, FL | 3.0 | 2.0 | 1250 | $2,699 | $2.16 | 17d | 1 | 1.07mi |
| 9781 Magnolia Blossom Dr Unit 1475280P Westchase, FL | 2.0 | 2.0 | 1345 | $3,624 | $2.69 | 15d | 1 | 1.09mi |
| 9902 Brompton Dr Tampa, FL | 1.0–3.0 | 1.0–2.5 | 1303 | $2,170 | $1.67 | 2d | 38 | 1.11mi |
| 10020 Tate Ln Tampa, FL | 2.0 | 2.5 | 1276 | $2,650 | $2.08 | 17d | 1 | 1.11mi |
| 9533 Magnolia Blossom Dr Unit 1504550P Tampa, FL | 2.0 | 2.0 | 1119 | $5,304 | $4.74 | 24d | 1 | 1.11mi |
| 9763 Magnolia Blossom Dr Unit 1475286P Tampa, FL | 2.0 | 2.0 | 1345 | $3,559 | $2.65 | 20d | 1 | 1.12mi |
| 9763 Magnolia Blossom Dr Unit 1475288P Tampa, FL | 2.0 | 2.0 | 1345 | $3,522 | $2.62 | 16d | 1 | 1.12mi |
| 9763 Magnolia Blossom Dr Unit 1475282P Tampa, FL | 2.0 | 2.0 | 1345 | $3,608 | $2.68 | 4d | 1 | 1.12mi |
| 8820 Thomas Oaks Dr Tampa, FL | 1.0–3.0 | 1.0–2.0 | 1043 | $2,223 | $2.13 | 1d | 22 | 1.17mi |
| 8035 Gardner Rd Tampa, FL | 3.0 | 2.0 | 880 | $2,650 | $3.01 | 24d | 2 | 1.26mi |
| 8774 Huntfield St Tampa, FL | 3.0 | 2.0 | 1388 | $3,100 | $2.23 | 4d | 1 | 1.44mi |
| 8134 Colonial Village Dr Tampa, FL | 1.0–3.0 | 1.0–2.0 | 1113 | $1,985 | $1.78 | 1d | 12 | 1.48mi |
HOA detail condo
- Monthly dues
- $0 · $0/yr
- Likely covers
- poolsecurity
- Assessments
- None detected in remarks — confirm with the listing agent.
Listing history 15 events
-
2026-06-15days on market $265,000 Active 34 DOM
-
2026-06-13days on market $265,000 Active 32 DOM
-
2026-06-13days on market $265,000 Active 31 DOM
-
2026-06-09days on market $265,000 Active 28 DOM
-
2026-06-08days on market $265,000 Active 27 DOM
-
2026-06-07days on market $265,000 Active 26 DOM
-
2026-06-04days on market $265,000 Active 23 DOM
-
2026-06-03days on market $265,000 Active 22 DOM
-
2026-06-02days on market $265,000 Active 21 DOM
-
2026-06-01days on market $265,000 Active 20 DOM
-
2026-05-31days on market $265,000 Active 19 DOM
-
2026-05-12$265,000 Active 1160-char remark
-
2021-12-01soldstatus $243,000
-
2019-10-01soldstatus $62,955
-
2004-11-18soldstatus $40,269,000
ⓘ Source: listings_history table (triggers on properties + properties_extension) + one-shot
backfill from property_details.listing_events for pre-trigger history.
Tax reassessment forecast FL · Resets to sale price
- Current annual tax
- $3,002 · $250/mo
- Projected year-2 tax
- $3,002 · $250/mo
- Expected delta
- $0/yr ($0/mo · 0.0%)
ⓘ Screening estimate from a state-policy table — verify with the county assessor before closing.
Climate risk First Street
- Flood 1/10 Low FEMA zone X (unshaded) · 0% chance over 30 yrs
- Wildfire 3/10 Moderate
- Heat 10/10 Extreme 7 d/yr ≥107°F today · 28 d/yr by 30 yrs out
- Wind 10/10 Extreme 99% chance of damaging wind over 30 yrs
- Air quality 3/10 Moderate 3 unhealthy d/yr today · 3 by 30 yrs out
Nearby sold comps map
Loading sold comps map…
Walkable amenities ~0.75 mi
Loading nearby amenities…
Taxation est. · year 1
- Rental income
- $25,265
- − Mortgage interest
- −$14,844
- − Property taxes
- −$3,002
- − Insurance
- −$1,325
- − Repairs & maintenance
- −$2,021
- − Management
- −$2,021
- − HOA
- −$12,072
- − Depreciation
- −$7,709
- Taxable loss
- −$17,730
- Est. tax savings @ 24.0%
- +$4,255
- After-tax cash flow
- $-8,861/yr
For passive investors: Depreciation is non-cash, so a rental often shows a tax loss while cash-flowing — sheltering income. Rental losses are passive: they offset passive income freely, and up to $25,000/yr can offset ordinary (W-2) income if you actively participate and your MAGI is under $100k (phasing out to $0 by $150k); unused losses carry forward. On sale, claimed depreciation is recaptured at up to 25%, and gains may owe capital-gains tax (a 1031 exchange can defer both). Figures are a year-1 estimate at your 24.0% rate — not tax advice; consult a CPA.
Schools (NCES district)
- District
- Hillsborough
- NCES district ID
- 1200870
- Math proficiency
- 47% ▼ -8.00%
- Reading proficiency
- 50% ▼ -4.00%
- Median HH income
- $50,622
- Composite
- 41.6/100
- National rank
- #3435
- State rank
- #41 of 73 in FL
Livability — Westchase
- Score
- 73/100
- State rank
- #320
- US rank
- #5558
Category grades
Schools grade is shown separately in the Schools card above.
Census & demographics
- Census place
- Westchase, FL
- County
- Hillsborough County · 1,540,968 people
- City population
- 30,575
- Metro
- Tampa-St. Petersburg-Clearwater, FL
- Population (ZIP)
- 30,575
- Household income
- $127,118
- Rent vs Own
- Severe rent burden
- 1072.0
Population outlook (Hillsborough County) Hauer SSP2
- Today (2025)
- 1,607,022 people
- By 2030
- 1,733,968 · +7.9%
- By 2040
- 1,979,565 · +23.2%
- By 2050
- 2,203,427 · +37.1%
- By 2075
- 2,667,893 · +66.0%
- By 2100
- 2,891,558 · +79.9%
Race, ethnicity, and origin ACS 2023
- Neighborhood character
- Diverse neighborhood (Simpson 0.58)
- Race & ethnicity
- White 61% Hispanic / Latino 21% Two or more races 16% Asian 9% Black 2%
- Hispanic origin (detail)
- Mexican 1% Puerto Rican 5% Cuban 3% Dominican 2%
- Common ancestry
- Lithuanian 3% Romanian 3% Italian 2%
- Foreign-born
- 23% · Canada, Jamaica, China
- Languages at home
- 68% English-only · Spanish 16% Other Indo-European 8% Russian/Polish/Slavic 3%
Political lean MEDSL · Hillsborough
- 2024 margin
- Toss-up / Even · D 47.8% · R 50.9% · Other 1.3%
- 2008→2024 swing
- -10.2pp toward R · 2008: 7.1pp · 2024: -3.1pp
- All cycles
- 2024: R+3.1 2020: D+6.9 2016: D+6.8 2012: D+6.7 2008: D+7.1
Not yet ingested
- Civics
- —
Market trends
- HPI YoY
- ▼ -106.80%
- Current HPI
- 241.882
- Rent YoY
- ▼ -4.66%
- Metro
- Tampa-St. Petersburg-Clearwater, FL
- State GDP YoY
- ▲ 3.28%
- F500 in state
- 36
Industry mix (Fortune 500 HQ in FL)
| Industry | F500 HQs | Revenue |
|---|---|---|
| Industrial Technology | 2 | $29B |
|
||
| Insurance | 2 | $17B |
|
||
| Retail | 1 | $60B |
|
||
| Technology Distribution | 1 | $58B |
|
||
| Homebuilding | 1 | $35B |
|
||
| Technology Manufacturing | 1 | $35B |
|
||
Price history
-99.4% since first listed3 events — show timeline
- 2021-12-01 Sold (Public Records) $243,000 Public Records
- 2019-10-01 Sold (Public Records) $62,955 Public Records
- 2004-11-18 Sold (Public Records) $40,269,000 Public Records
Property tax history
+8.7%/yrLatest (2025): $3,002 · +2.3% YoY. Source: county tax records.
Cash-flow waterfall
monthlySold comps — $/sqft
last 12 mo · ≤1 miLoading sold comps…