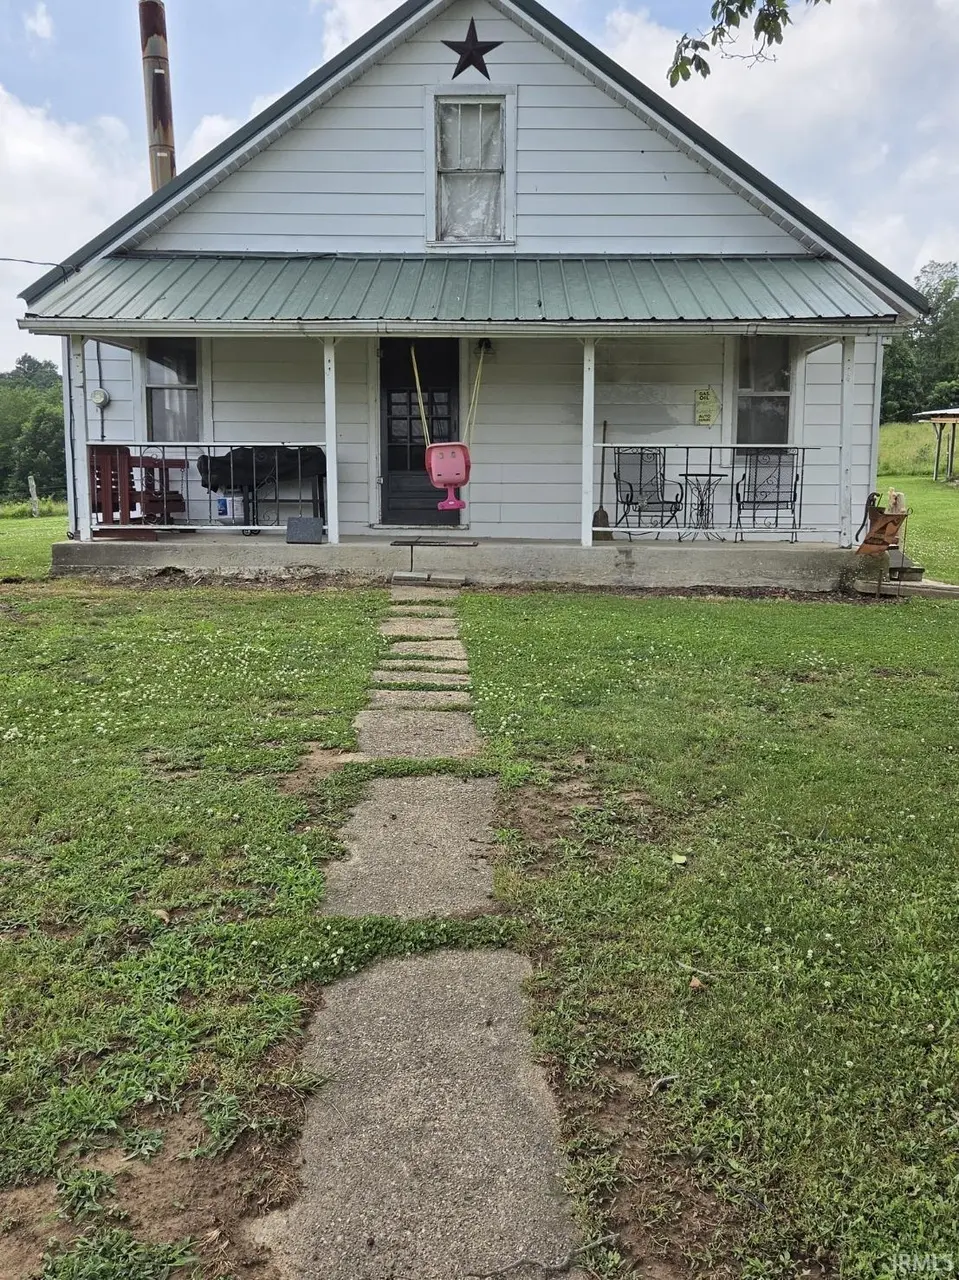
845 N Crowe Rd · Bloomfield, IN
Flood risk 1/10 · Minimal
- FEMA flood zone
- X (unshaded)
- Chance of flooding over 30 yrs
- 0.0%
- Est. flood insurance / yr
- $473 – $860
Fire risk 3/10 · Minor
- Est. fire insurance / yr
- $717 – $1,331
Heat risk 4/10 · Minor
- Hot days now (above 105°F)
- 7 days/yr
- Hot days in 30 yrs
- 19 days/yr
Wind risk 2/10 · Minimal
- Chance of severe wind over 30 yrs
- 1.0%
Air-quality risk 3/10 · Minor
- Unhealthy air days now
- 2 days/yr
- Unhealthy air days in 30 yrs
- 5 days/yr
Risk factors via First Street. Map © Google.
Why this score? — see what drove the D grade
The composite is a weighted blend of 9 inputs, each scored 0–100. Each bar is that input's sub-score; the figure is the points it added to the 100-point composite (weight × sub-score).
- Cash flow +13.8/30.0
- ARV discount +7.5/15.0
- DSCR +4.2/10.0
- 1% rule +3.9/10.0
- Livability +3.7/5.0
- Appreciation +3.6/10.0
- Schools +2.9/10.0
- Rent growth +2.5/5.0
- Condition / age +2.5/5.0
$147,500
🖨 Deal sheet (PDF) 📄 Offer letter ✓ Due diligence
Listing remarks
Perfect little starter home - on . 71 acres! 2 bedroom 1 bath home with a finished loft area. Big ticket items have been replaced over the last few years: Water heater is 6years old, Furnace 7years, Ac Unit 1 year and metal roof is only 6 years old. Nice size chicken coop will stay and chickens can stay if buyers would like them. Lots of yard for the kids and pets, plenty of garden space. young baby in the home, 24 hour notice is required to schedule a showing. Sale is contingent on Seller finding suitable housing.
Key facts
- Metal roof
- Finished loft area
- Chicken coop
Tags
Property features AI
Finance
- HOA & community: No association amenities
Exterior
- Parking: Detached garage with 1 garage space; Gravel and off-street parking; RV access/parking
- Security: Smoke detectors
- Utilities: Public water; Septic tank sewer; Cable available
- Home design: Single-family residence (site-built); One story; Block foundation; Metal roof
- Construction: Wood siding construction; Block foundation; Metal roof; Built as a site-built home
- Exterior features: Fire pit; Deck (covered); Porch; Partial wire fencing; Level lot; Asphalt road access; Irregular lot dimensions
Interior
- Kitchen: Dishwasher; Microwave; Refrigerator; Gas oven; Gas range; Exhaust fan; Breakfast bar; Pantry
- Bedrooms: Master bedroom located on the main level
- Flooring: Hardwood
- Bathrooms: One full bathroom (main level)
- Heating & cooling: Natural gas forced-air heating; Central air conditioning
- Interior features: Pantry; Breakfast bar; Built-in features; Master bedroom on main level; One fireplace (none specified for features)
- Laundry & utility: Washer; Dryer; Laundry on main level; Unfinished crawl space basement
Neighborhood map
What this means for you Summary
Snapshot
- This is a 2-bed/1.0-bath single-family listed at $148k.
Deal economics
- At list price, monthly cash flow is $14 ($165/yr) — positive.
- The deal already cash-flows at list — no discount required.
- To meet the 1% rule (rent ≥ 1% of price), the offer needs to be $131k (11.3% below list).
- Recommended offer: $131k (11.3% below list) — sets the bar for 1% rule.
Location & tenants
- Location reads 73/100 on livability (#96 in IN) — a middle-class / working-renter tenant base. Strengths: crime A+, cost of living A+, housing A+; Watch: amenities F, commute F.
- Eastern Greene Schools (rural): math 31% / reading 37% proficiency, ranked #199 of 301 in IN (top 66%) — families likely to look elsewhere, expect single-tenant / working-renter base with shorter leases.
- Zoned schools: Eastern Greene Elementary School (math 32% / reading 27%, grade F, #697 of 994 statewide, top 73%, 433 students, 54% FRL); Eastern Greene Middle School (math 27% / reading 33%, grade F, #208 of 330 statewide, top 64%, 349 students, 51% FRL); Eastern Greene High School (math 42% / reading 77%, grade C+, #49 of 369 statewide, top 16%, 334 students, 43% FRL).
- Market conditions: 55 active listings in the ZIP.
Forward outlook
- Local home prices are declining (-2.8%/yr); year-one equity from $1k of loan paydown is wiped out by about $4k of value loss. Plan a longer hold.
- Greene County population projected at -22% by 2050 — secular population decline; favor cash flow + early exit over multi-decade hold.
Negotiation context
- Only 10 days on market — expect competitive offers; lowballing is unlikely to land.
Risks & watch-outs
- Watch-outs: built in 1939 — expect roof / HVAC / electrical / plumbing capex.
Questions for the listing agent
- Built in 1939 — when were the roof, HVAC, electrical panel, plumbing, and water heater last replaced?
- Is there a deadline driving the sale (1031 exchange, divorce, estate, relocation)? That informs how much negotiation room exists.
- Schools are D-rated, which usually means shorter tenancies and higher turnover. Who's the typical renter profile here, and what's been the actual vacancy rate?
- The area grade is low — what's the realistic commute time and amenity access for the typical tenant pool here? Any planned neighborhood developments (good or bad) we should know about?
- What's the average days-on-market for RENTAL listings here right now (not sales)? A rising rental-DOM trend means longer vacancies and softer asking-rent achievability than the comps imply.
- What's the recent tenant-quality profile in this submarket — average credit score on applications, eviction rate, late-payment / NSF rate, and stable-employment percentage? A property-management company in the area should have these aggregated.
- How much new for-sale + rental construction is in the pipeline within 1–3 miles? Heavy new supply typically softens prices + rents 12–24 months out; constrained supply supports both.
Investment metrics
- 1% rule
- 0.89% ✗
- Cap rate
- 6.40%
- Cash-on-cash
- 0.40%
- DSCR
- 1.02
- GRM
- 9.4
CMA / ARV
No comps found within radius.
Projected returns pro-forma
-2.84% appreciation · 3.0% rent growth · sell at horizon
- IRR
- -14.7%
- Equity multiple
- 0.47×
- Total profit
- $-22,017
- Equity at exit
- $23,047
- IRR
- -6.3%
- Equity multiple
- 0.59×
- Total profit
- $-17,121
- Equity at exit
- $14,572
Cash invested: $41,300 (down + closing). Projections, not guarantees.
Landlord ↔ Tenant lean methodology
- Overall (STATE)
- 90 Strongly Landlord-Friendly
- State Indiana
- 90 Strongly Landlord-Friendly · R+11
- County
- — inherits STATE
- City
- — inherits STATE
ZIP-level market 47424
- Home prices YoY
- -1.3%
- Active inventory
- 55
- Price-to-rent
- 9.4×
Monthly cashflow live
- Estimated rent
- $1,308 medium interval (Pro) →
- Mortgage (P&I)
- −$774
- Tax est. 1.5%
- −$184 /mo · $2,212/yr
- Insurance
- −$61
- HOA
- −$0
- Vacancy / Maint / Mgmt
- −$275
- Net cashflow
- $14
Break-even live
Sensitivity live
| Price | -10% $116 | -5% $65 | +0% $14 | +5% $-37 | +10% $-88 |
|---|---|---|---|---|---|
| Rent | -10% $-90 | -5% $-38 | +0% $14 | +5% $65 | +10% $117 |
| Rate | -1.0pp $88 | -0.5pp $51 | base $14 | +0.5pp $-25 | +1.0pp $-63 |
UW: 25.0% down · 7.5% · 30yr · 1.5% tax · 5.0% vac · 8.0% maint · 8.0% mgmt
Financing live
Cash to close
- Down payment
- $36,875
- Closing costs
- $4,425
- Reserves months
- —
- Total cash needed
- —
Loan-product check · same deal, 3 products live
Conventional
25% down · 7.5% · 30yr
- Down + closing
- —
- Monthly P&I
- —
- Monthly cashflow
- —
- DSCR
- —
- Eligible?
- —
Personal DTI + credit; lowest rate.
DSCR
20% down · 8.5% · 30yr
- Down + closing
- —
- Monthly P&I
- —
- Monthly cashflow
- —
- DSCR
- —
- Eligible?
- —
No personal income docs; deal must DSCR.
Hard money
10% down · 12.0% · 12mo
- Down + closing
- —
- Monthly P&I
- —
- Monthly cashflow
- —
- DSCR
- —
- Eligible?
- —
Short-term bridge; refi at stabilization.
Listing history 9 events
-
2026-06-22days on market $147,500 Active 10 DOM
-
2026-06-19days on market $147,500 Active 8 DOM
-
2026-06-18days on market $147,500 Active 7 DOM
-
2026-06-17days on market $147,500 Active 6 DOM
-
2026-06-16days on market $147,500 Active 5 DOM
-
2026-06-15days on market $147,500 Active 4 DOM
-
2026-06-14days on market $147,500 Active 2 DOM
-
2026-06-13remarks 520-char remark
-
2026-06-13$147,500 Active 1 DOM
ⓘ Source: listings_history table (triggers on properties + properties_extension) + one-shot
backfill from property_details.listing_events for pre-trigger history.
Climate risk First Street
- Flood 1/10 Low FEMA zone X (unshaded) · 0% chance over 30 yrs
- Wildfire 3/10 Moderate
- Heat 4/10 Moderate 7 d/yr ≥105°F today · 19 d/yr by 30 yrs out
- Wind 2/10 Low 100% chance of damaging wind over 30 yrs
- Air quality 3/10 Moderate 2 unhealthy d/yr today · 5 by 30 yrs out
Nearby sold comps map
Loading sold comps map…
Walkable amenities ~0.75 mi
Loading nearby amenities…
Taxation est. · year 1
- Rental income
- $15,692
- − Mortgage interest
- −$8,262
- − Property taxes
- −$2,212
- − Insurance
- −$738
- − Repairs & maintenance
- −$1,255
- − Management
- −$1,255
- − Depreciation
- −$4,291
- Taxable loss
- −$2,322
- Est. tax savings @ 24.0%
- +$557
- After-tax cash flow
- $722/yr
For passive investors: Depreciation is non-cash, so a rental often shows a tax loss while cash-flowing — sheltering income. Rental losses are passive: they offset passive income freely, and up to $25,000/yr can offset ordinary (W-2) income if you actively participate and your MAGI is under $100k (phasing out to $0 by $150k); unused losses carry forward. On sale, claimed depreciation is recaptured at up to 25%, and gains may owe capital-gains tax (a 1031 exchange can defer both). Figures are a year-1 estimate at your 24.0% rate — not tax advice; consult a CPA.
Schools (NCES district)
- District
- Eastern Greene Schools
- NCES district ID
- 1803090
- Math proficiency
- 31% ▼ -13.00%
- Reading proficiency
- 37% ▼ -11.00%
- Median HH income
- $47,226
- Composite
- 29.24/100
- National rank
- #6565
- State rank
- #199 of 301 in IN
Livability — Bloomfield
- Score
- 73/100
- State rank
- #96
- US rank
- #5394
Category grades
Schools grade is shown separately in the Schools card above.
Census & demographics
- Population (ZIP)
- 8,620
Population outlook (Greene County) Hauer SSP2
- Today (2025)
- 30,724 people
- By 2030
- 29,506 · -4.0%
- By 2040
- 26,744 · -13.0%
- By 2050
- 23,879 · -22.3%
- By 2075
- 18,341 · -40.3%
- By 2100
- 13,976 · -54.5%
Race, ethnicity, and origin ACS 2023
- Neighborhood character
- Predominantly White (96%)
- Race & ethnicity
- White 96% Two or more races 2%
- Common ancestry
- Italian 2% Iranian 2% Slovak 2%
- Foreign-born
- 0%
Political lean MEDSL · Greene
- 2024 margin
- Solid R (+53.7) · D 22.4% · R 76.1% · Other 1.6%
- 2008→2024 swing
- -39.2pp toward R · 2008: -14.5pp · 2024: -53.7pp
- All cycles
- 2024: R+53.7 2020: R+52.2 2016: R+53.4 2012: R+31.4 2008: R+14.5
Not yet ingested
- Civics
- —
Market trends
- HPI YoY
- ▼ -2.84%
- Current HPI
- 208.554
- Rent YoY
- —
- Metro
- —
- State GDP YoY
- ▲ 2.90%
- F500 in state
- 18
Industry mix (Fortune 500 HQ in IN)
| Industry | F500 HQs | Revenue |
|---|---|---|
| Industrial Machinery | 2 | $37B |
|
||
| Healthcare | 1 | $177B |
|
||
| Pharmaceuticals | 1 | $45B |
|
||
| Metals / Steel | 1 | $18B |
|
||
| Agriculture | 1 | $17B |
|
||
| Packaging | 1 | $12B |
|
||
Price history
1 event — show timeline
- 2026-06-11 Listed $147,500 IRMLS
Property tax history
-0.4%/yrLatest (2025): $223 · -29.6% YoY. Source: county tax records.
Cash-flow waterfall
monthlySold comps — $/sqft
last 12 mo · ≤1 miLoading sold comps…