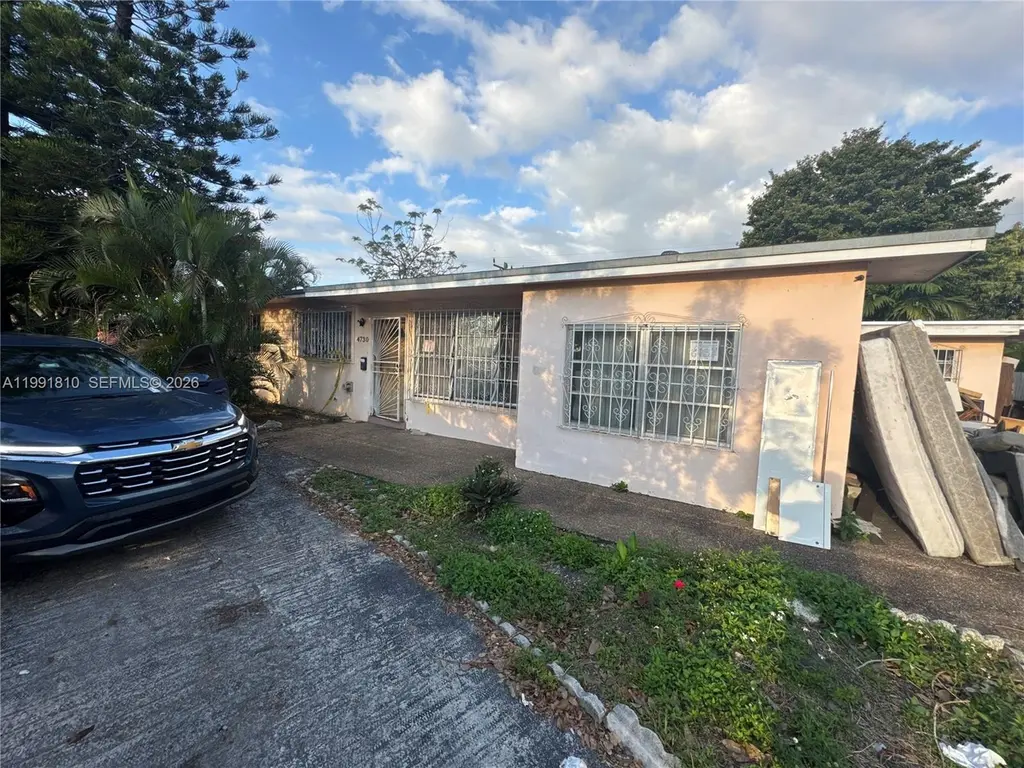
4730 W 8th Ave · Hialeah, FL
Flood risk 1/10 · Minimal
- FEMA flood zone
- X (unshaded)
- Chance of flooding over 30 yrs
- 0.0%
- Est. flood insurance / yr
- $507 – $1,088
Fire risk 1/10 · Minimal
- Est. fire insurance / yr
- $947 – $1,759
Heat risk 9/10 · Severe
- Hot days now (above 105°F)
- 5 days/yr
- Hot days in 30 yrs
- 19 days/yr
Wind risk 10/10 · Severe
- Chance of severe wind over 30 yrs
- 99.0%
Air-quality risk 2/10 · Minimal
- Unhealthy air days now
- 1 days/yr
- Unhealthy air days in 30 yrs
- 2 days/yr
Risk factors via First Street. Map © Google.
Why this score? — see what drove the D grade
The composite is a weighted blend of 9 inputs, each scored 0–100. Each bar is that input's sub-score; the figure is the points it added to the 100-point composite (weight × sub-score).
- Cash flow +12.2/30.0
- ARV discount +7.5/15.0
- 1% rule +5.6/10.0
- Schools +4.2/10.0
- Livability +3.7/5.0
- DSCR +3.6/10.0
- Condition / age +2.5/5.0
- Rent growth +2.1/5.0
- Appreciation +0.0/10.0
$280,000
🖨 Deal sheet (PDF) 📄 Offer letter ✓ Due diligence
Listing remarks
SHORT SALE SUBJET TO LENDER APPROVAL!!!
Key facts
- 7,500 sq ft lot
- Parking
- Built 1958
Neighborhood map
What this means for you Summary
Snapshot
- This is a 4-bed/2.0-bath single-family listed at $280k.
Deal economics
- At list price, monthly cash flow is $-55 ($-661/yr) — negative.
- To cash-flow at today's rent, offer at most $270k (3.5% below list).
- Meets the 1% rule at list price ($3k rent vs $280k).
- Recommended offer: $270k (3.5% below list) — sets the bar for cash-flow.
- Cap rate 6.1% vs local median 3.5% in Hialeah — top-decile yield for the area; either an underpriced asset or a hidden risk that comps aren't pricing in. Stress-test before assuming the spread holds.
Location & tenants
- Location reads 74/100 on livability (#288 in FL, #4,774 nationally) — a middle-class / working-renter tenant base. Strengths: commute A+, health & safety A+; Watch: amenities F, employment D-.
- Miami-Dade (suburban): math 45% / reading 54% proficiency, ranked #40 of 73 in FL (top 55%) — families likely to look elsewhere, expect single-tenant / working-renter base with shorter leases; 64% free/reduced lunch — lower-income household profile, screen leases tightly.
- Zoned schools: Meadowlane Elementary School (math 61% / reading 59%, grade B-, #680 of 2,144 statewide, top 32%, 687 students, 73% FRL); Palm Springs Middle School (math 32% / reading 40%, grade F, #410 of 571 statewide, top 72%, 782 students, 72% FRL); Hialeah Senior High School (math 16% / reading 37%, grade F, #489 of 667 statewide, top 74%, 1,732 students, 67% FRL).
- Market conditions: Rents soft (-1.5%/yr); 199 active listings in the ZIP; 10,051 units permitted in Miami-Dade County in 2024 (7,758 in 5+ unit buildings).
- At $2,957/mo this rent would consume 69% of the median local household income ($51k/yr) (locally 4195% of renters already pay >50% of income on rent) — very limited rent-growth headroom before tenants either downsize or default.
Forward outlook
- Local home prices are declining (-3.0%/yr); year-one equity from $2k of loan paydown is wiped out by about $8k of value loss. Plan a longer hold.
- Miami-Dade County population projected at +28% by 2050 — long-run rental-demand tailwind backs the buy-and-hold thesis.
Negotiation context
- Only 1 days on market — expect competitive offers; lowballing is unlikely to land.
- Current owner paid $115k; list at $280k implies a 143% gain — meaningful room to come down on a strong offer.
Risks & watch-outs
- Watch-outs: property tax is 3.5% of price; built in 1958 — expect roof / HVAC / electrical / plumbing capex.
- Climate carrying-cost: severe wind risk, 99% chance of damaging wind over 30y; extreme-heat days projected 5→19/yr by 2055 (HVAC capex compounding) — expect insurance premiums to compound above CPI over the hold.
Questions for the listing agent
- What do current leases actually rent for vs. the listed asking? Can we see a recent rent roll and the last 12 months of T-12 income?
- Built in 1958 — when were the roof, HVAC, electrical panel, plumbing, and water heater last replaced?
- Property tax is high relative to price — has the assessment been appealed recently, and will the sale trigger a re-assessment?
- Is there a deadline driving the sale (1031 exchange, divorce, estate, relocation)? That informs how much negotiation room exists.
- The area grade is low — what's the realistic commute time and amenity access for the typical tenant pool here? Any planned neighborhood developments (good or bad) we should know about?
- What's the average days-on-market for RENTAL listings here right now (not sales)? A rising rental-DOM trend means longer vacancies and softer asking-rent achievability than the comps imply.
- What's the recent tenant-quality profile in this submarket — average credit score on applications, eviction rate, late-payment / NSF rate, and stable-employment percentage? A property-management company in the area should have these aggregated.
- How much new for-sale + rental construction is in the pipeline within 1–3 miles? Heavy new supply typically softens prices + rents 12–24 months out; constrained supply supports both.
Investment metrics
- 1% rule
- 1.06% ✓
- Cap rate
- 6.06%
- Cash-on-cash
- -0.84%
- DSCR
- 0.96
- GRM
- 7.9
CMA / ARV
- ARV (on-the-fly)
- $767,046
- Comps found
- 1
Show comp detail 1 sale within ~0.75 mi
| Address | Dist | Beds/Ba | Sqft | Sold | Price | $/sf | Match |
|---|---|---|---|---|---|---|---|
| 4660 W 8th Pl | 0.10mi | 3/2.0 (-1) | 2,751 (+5%) | 11mo | $810,000 | $294 | 72 |
Match score weights: distance 35% · size 25% · config 20% · recency 20%. Top-matched comps best support the ARV.
Projected returns pro-forma
-3.0% appreciation · 0.0% rent growth · sell at horizon
- IRR
- -21.8%
- Equity multiple
- 0.27×
- Total profit
- $-57,220
- Equity at exit
- $41,749
- IRR
- -28.7%
- Equity multiple
- -0.10×
- Total profit
- $-86,513
- Equity at exit
- $24,209
Cash invested: $78,400 (down + closing). Projections, not guarantees.
Landlord ↔ Tenant lean methodology
- Overall (STATE)
- 87 Strongly Landlord-Friendly
- State Florida
- 87 Strongly Landlord-Friendly · R+3
- County
- — inherits STATE
- City
- — inherits STATE
ZIP-level market 33012
- Rents YoY
- -1.5%
- Active inventory
- 199
- Price-to-rent
- 7.9×
Monthly cashflow live
- Estimated rent
- $2,957 medium interval (Pro) →
- Mortgage (P&I)
- −$1,468
- Tax from tax record
- −$806 /mo · $9,673/yr
- Insurance
- −$117
- HOA
- −$0
- Vacancy / Maint / Mgmt
- −$621
- Net cashflow
- $-55
Break-even live
Sensitivity live
| Price | -10% $103 | -5% $24 | +0% $-55 | +5% $-134 | +10% $-214 |
|---|---|---|---|---|---|
| Rent | -10% $-289 | -5% $-172 | +0% $-55 | +5% $62 | +10% $179 |
| Rate | -1.0pp $86 | -0.5pp $16 | base $-55 | +0.5pp $-128 | +1.0pp $-201 |
UW: 25.0% down · 7.5% · 30yr · 1.5% tax · 5.0% vac · 8.0% maint · 8.0% mgmt
Financing live
Cash to close
- Down payment
- $70,000
- Closing costs
- $8,400
- Reserves months
- —
- Total cash needed
- —
Loan-product check · same deal, 3 products live
Conventional
25% down · 7.5% · 30yr
- Down + closing
- —
- Monthly P&I
- —
- Monthly cashflow
- —
- DSCR
- —
- Eligible?
- —
Personal DTI + credit; lowest rate.
DSCR
20% down · 8.5% · 30yr
- Down + closing
- —
- Monthly P&I
- —
- Monthly cashflow
- —
- DSCR
- —
- Eligible?
- —
No personal income docs; deal must DSCR.
Hard money
10% down · 12.0% · 12mo
- Down + closing
- —
- Monthly P&I
- —
- Monthly cashflow
- —
- DSCR
- —
- Eligible?
- —
Short-term bridge; refi at stabilization.
Listing history 5 events
-
2026-03-31status Pending
-
2026-03-30$280,000 Active
-
1992-12-14soldstatus $115,000
-
1989-10-10soldstatus $105,000
-
1979-06-01soldstatus $45,000
ⓘ Source: listings_history table (triggers on properties + properties_extension) + one-shot
backfill from property_details.listing_events for pre-trigger history.
Tax reassessment forecast FL · Resets to sale price
- Current annual tax
- $9,673 · $806/mo
- Projected year-2 tax
- $9,673 · $806/mo
- Expected delta
- $0/yr ($0/mo · 0.0%)
ⓘ Screening estimate from a state-policy table — verify with the county assessor before closing.
Climate risk First Street
- Flood 1/10 Low FEMA zone X (unshaded) · 0% chance over 30 yrs
- Wildfire 1/10 Low
- Heat 9/10 Extreme 5 d/yr ≥105°F today · 19 d/yr by 30 yrs out
- Wind 10/10 Extreme 99% chance of damaging wind over 30 yrs
- Air quality 2/10 Low 1 unhealthy d/yr today · 2 by 30 yrs out
Nearby sold comps map
Loading sold comps map…
Walkable amenities ~0.75 mi
Loading nearby amenities…
Taxation est. · year 1
- Rental income
- $35,484
- − Mortgage interest
- −$15,684
- − Property taxes
- −$9,673
- − Insurance
- −$1,400
- − Repairs & maintenance
- −$2,839
- − Management
- −$2,839
- − Depreciation
- −$8,145
- Taxable loss
- −$5,096
- Est. tax savings @ 24.0%
- +$1,223
- After-tax cash flow
- $562/yr
For passive investors: Depreciation is non-cash, so a rental often shows a tax loss while cash-flowing — sheltering income. Rental losses are passive: they offset passive income freely, and up to $25,000/yr can offset ordinary (W-2) income if you actively participate and your MAGI is under $100k (phasing out to $0 by $150k); unused losses carry forward. On sale, claimed depreciation is recaptured at up to 25%, and gains may owe capital-gains tax (a 1031 exchange can defer both). Figures are a year-1 estimate at your 24.0% rate — not tax advice; consult a CPA.
Schools (NCES district)
- District
- Miami-Dade
- NCES district ID
- 1200390
- Math proficiency
- 45% ▼ -16.00%
- Reading proficiency
- 54% ▼ -5.00%
- Median HH income
- $43,928
- Composite
- 41.76/100
- National rank
- #3397
- State rank
- #40 of 73 in FL
Livability — Hialeah
- Score
- 74/100
- State rank
- #288
- US rank
- #4774
Category grades
Schools grade is shown separately in the Schools card above.
Census & demographics
- Census place
- Hialeah, FL
- County
- Miami-Dade County · 2,697,751 people
- City population
- 315,776
- Metro
- Miami-Fort Lauderdale-Pompano Beach, FL
- Population (ZIP)
- 71,017
- Household income
- $51,450
- Rent vs Own
- Severe rent burden
- 4195.0
Population outlook (Miami-Dade County) Hauer SSP2
- Today (2025)
- 3,126,439 people
- By 2030
- 3,325,765 · +6.4%
- By 2040
- 3,697,561 · +18.3%
- By 2050
- 4,012,134 · +28.3%
- By 2075
- 4,605,612 · +47.3%
- By 2100
- 4,866,598 · +55.7%
Race, ethnicity, and origin ACS 2023
- Neighborhood character
- Predominantly Hispanic (96%)
- Race & ethnicity
- Hispanic / Latino 96% Two or more races 57% White 3%
- Hispanic origin (detail)
- Puerto Rican 2% Cuban 80% Dominican 2%
- Common ancestry
- Lithuanian 1%
- Foreign-born
- 76% · Canada, Jamaica, Dominican Republic
- Languages at home
- 7% English-only · Spanish 92%
Political lean MEDSL · Miami-Dade
- 2024 margin
- R (+11.4) · D 43.9% · R 55.4%
- 2008→2024 swing
- -27.6pp toward R · 2008: 16.1pp · 2024: -11.4pp
- All cycles
- 2024: R+11.4 2020: D+7.3 2016: D+29.6 2012: D+23.7 2008: D+16.1
Not yet ingested
- Civics
- —
Market trends
- HPI YoY
- ▼ -711.72%
- Current HPI
- 387.8757
- Rent YoY
- ▼ -1.50%
- Metro
- Miami-Fort Lauderdale-Pompano Beach, FL
- State GDP YoY
- ▲ 3.28%
- F500 in state
- 36
Industry mix (Fortune 500 HQ in FL)
| Industry | F500 HQs | Revenue |
|---|---|---|
| Industrial Technology | 2 | $29B |
|
||
| Insurance | 2 | $17B |
|
||
| Retail | 1 | $60B |
|
||
| Technology Distribution | 1 | $58B |
|
||
| Homebuilding | 1 | $35B |
|
||
| Technology Manufacturing | 1 | $35B |
|
||
Price history
+522.2% since first listed5 events — show timeline
- 2026-03-31 Pending — MARMLS
- 2026-03-30 Listed $280,000 MARMLS
- 1992-12-14 Sold (Public Records) $115,000 Public Records
- 1989-10-10 Sold (Public Records) $105,000 Public Records
- 1979-06-01 Sold (Public Records) $45,000 Public Records
Property tax history
+13.5%/yrLatest (2025): $9,673 · +3.7% YoY. Source: county tax records.
Cash-flow waterfall
monthlySold comps — $/sqft
last 12 mo · ≤1 miLoading sold comps…