114 Shadowlight Ter · San Antonio, TX
Flood risk 1/10 · Minimal
- FEMA flood zone
- X (unshaded)
- Chance of flooding over 30 yrs
- 0.0%
- Est. flood insurance / yr
- $507 – $1,088
Fire risk 1/10 · Minimal
- Est. fire insurance / yr
- $1,222 – $2,270
Heat risk 8/10 · Major
- Hot days now (above 107°F)
- 7 days/yr
- Hot days in 30 yrs
- 22 days/yr
Wind risk 8/10 · Major
- Chance of severe wind over 30 yrs
- 80.0%
Air-quality risk 2/10 · Minimal
- Unhealthy air days now
- 0 days/yr
- Unhealthy air days in 30 yrs
- 1 days/yr
Risk factors via First Street. Map © Google.
Why this score? — see what drove the D grade
The composite is a weighted blend of 9 inputs, each scored 0–100. Each bar is that input's sub-score; the figure is the points it added to the 100-point composite (weight × sub-score).
- ARV discount +15.0/15.0
- Cash flow +8.7/30.0
- 1% rule +4.0/10.0
- Livability +4.0/5.0
- Schools +3.8/10.0
- Rent growth +2.5/5.0
- Condition / age +2.5/5.0
- DSCR +2.4/10.0
- Appreciation +0.0/10.0
$164,900
🖨 Deal sheet (PDF) 📄 Offer letter ✓ Due diligence
Listing remarks MLS
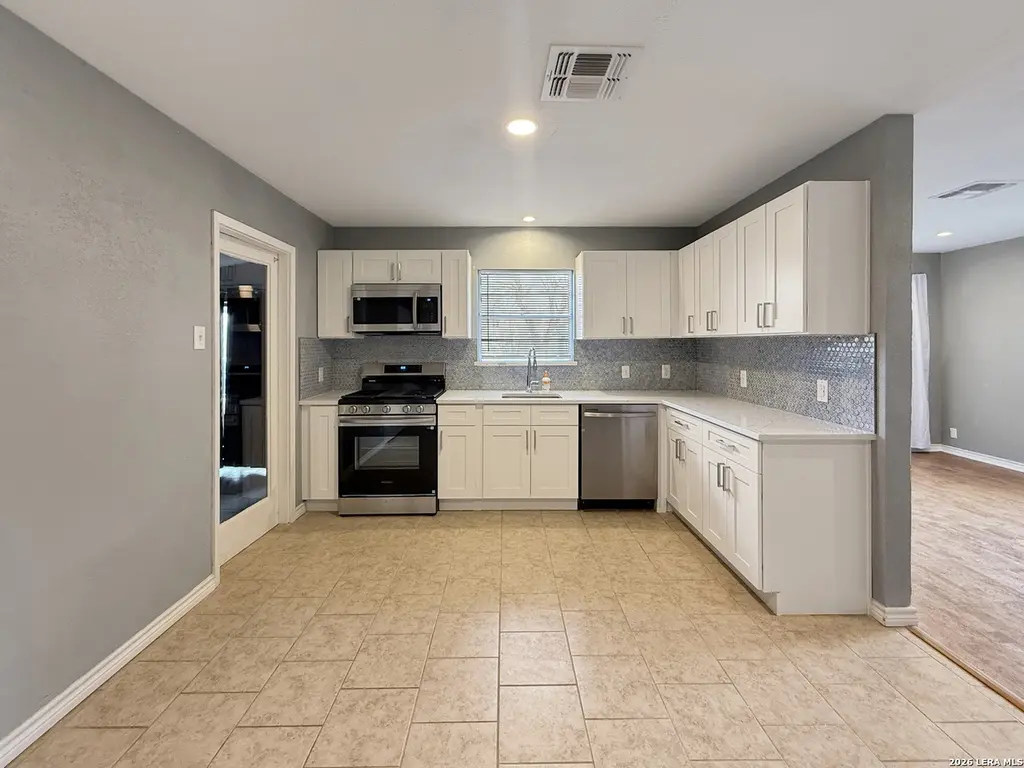
Excellent Move-in Ready home is ready for new owners!
Key facts
- 6,882 sq ft lot
- Built 1960
- Listed 81 days
Neighborhood map
What this means for you Summary
Snapshot
- This is a 3-bed/2.0-bath single-family listed at $165k.
Deal economics
- At list price, monthly cash flow is $-138 ($-2k/yr) — negative.
- To cash-flow at today's rent, offer at most $140k (14.8% below list).
- To meet the 1% rule (rent ≥ 1% of price), the offer needs to be $149k (9.9% below list).
- Recommended offer: $140k (14.8% below list) — sets the bar for cash-flow.
- Cap rate 5.3% vs local median 3.8% in San Antonio — top-decile yield for the area; either an underpriced asset or a hidden risk that comps aren't pricing in. Stress-test before assuming the spread holds.
Location & tenants
- Location reads 80/100 on livability (#31 in TX, #1,616 nationally) — a professional / high-income tenant draw. Strengths: amenities A+, commute A+, cost of living A+; Watch: crime F.
- North East ISD (urban): math 38% / reading 49% proficiency, ranked #276 of 826 in TX (top 33%) — families likely to look elsewhere, expect single-tenant / working-renter base with shorter leases.
- Zoned schools: Clear Spring El (math 17% / reading 22%, grade F, #3,583 of 4,322 statewide, top 86%, 318 students, 89% FRL); Krueger Middle (math 37% / reading 34%, grade F, #827 of 1,662 statewide, top 51%, 813 students, 77% FRL); Roosevelt H S (math 20% / reading 40%, grade F, #1,096 of 1,632 statewide, top 68%, 2,599 students, 72% FRL) — zoned schools average 79% FRL vs 41% district-wide (38 pts higher); higher-poverty schools than district average — tighter screening recommended.
- Zoned-school proficiency averages 28% at this address vs 44% district-wide (-15 pts) — the specific schools serving this property underperform the North East ISD average; the district grade overstates school quality for this exact location.
- Market conditions: Rents soft (-0.1%/yr); 308 active listings in the ZIP; 40 comparable units currently listed for rent nearby; rentals at typical pace (median 17d on market — plan ~3-4 weeks tenant-placement turnaround); solid renter incomes; 8,308 units permitted in Bexar County in 2024 (2,506 in 5+ unit buildings).
Forward outlook
- Local home prices are declining (-3.0%/yr); year-one equity from $1k of loan paydown is wiped out by about $5k of value loss. Plan a longer hold.
- Bexar County population projected at +50% by 2050 — long-run rental-demand tailwind backs the buy-and-hold thesis.
Negotiation context
- It's been on market 81 days — a 6% lower offer ($155k) is reasonable based on typical stale-listing flexibility.
- 11 sale attempts since 22y ago with the ask held roughly flat each time — persistent listings suggest the price (not the market) is what's stuck; bring a comps-based counter.
Risks & watch-outs
- Watch-outs: property tax is 2.8% of price.
- Climate carrying-cost: severe wind risk, 80% chance of damaging wind over 30y; extreme-heat days projected 7→22/yr by 2055 (HVAC capex compounding) — expect insurance premiums to compound above CPI over the hold.
Questions for the listing agent
- What do current leases actually rent for vs. the listed asking? Can we see a recent rent roll and the last 12 months of T-12 income?
- It's been on market 81 days. Have you received any prior offers? Is the seller open to a 15% concession, seller financing, or rate buy-down credit?
- Built in 1960 — when were the roof, HVAC, electrical panel, plumbing, and water heater last replaced?
- Property tax is high relative to price — has the assessment been appealed recently, and will the sale trigger a re-assessment?
- Why hasn't it sold? Are there any deal-killer items the seller is aware of (foundation, flood, title, zoning, code violations)?
- Is there a deadline driving the sale (1031 exchange, divorce, estate, relocation)? That informs how much negotiation room exists.
- Crime grade is F in this area — have there been break-ins, vandalism, or insurance claims at this property in the last 3 years? What carrier currently insures it and at what premium?
- The area grade is low — what's the realistic commute time and amenity access for the typical tenant pool here? Any planned neighborhood developments (good or bad) we should know about?
- What's the average days-on-market for RENTAL listings here right now (not sales)? A rising rental-DOM trend means longer vacancies and softer asking-rent achievability than the comps imply.
- What's the recent tenant-quality profile in this submarket — average credit score on applications, eviction rate, late-payment / NSF rate, and stable-employment percentage? A property-management company in the area should have these aggregated.
- How much new for-sale + rental construction is in the pipeline within 1–3 miles? Heavy new supply typically softens prices + rents 12–24 months out; constrained supply supports both.
Investment metrics
- 1% rule
- 0.90% ✗
- Cap rate
- 5.29%
- Cash-on-cash
- -3.59%
- DSCR
- 0.84
- GRM
- 9.2
CMA / ARV
- ARV (median comp)
- $200,682
- List price
- $164,900
- Delta
- -17.83%
- Verdict
- UNDERPRICED
- Comps
- 20 within 1.0 mi
Show comp detail 10 sales within ~0.75 mi
| Address | Dist | Beds/Ba | Sqft | Sold | Price | $/sf | Match |
|---|---|---|---|---|---|---|---|
| 114 Shadowlight Ter | 0.00mi | 4/1.0 (+1) | 1,112 (0%) | 0mo | $164,900 | $148 | 91 |
| 168 Booker Palm | 0.46mi | 2/2.0 (-1) | 1,150 (+3%) | 2mo | $197,000 | $171 | 66 |
| 103 Starlight Ter | 0.14mi | 4/1.0 (+1) | 1,212 (+9%) | 6mo | $168,468 | $139 | 65 |
| 314 Centerway Dr | 0.08mi | 3/1.0 | 1,222 (+10%) | 19mo | $220,000 | $180 | 60 |
| 9627 Heidelberg St | 0.45mi | 3/1.0 | 1,150 (+3%) | 12mo | $160,000 | $139 | 59 |
| 118 Beacon Bay | 0.37mi | 2/2.0 (-1) | 1,150 (+3%) | 17mo | $186,990 | $163 | 58 |
| 115 Goforth | 0.44mi | 3/2.0 | 1,008 (-9%) | 13mo | $235,000 | $233 | 53 |
| 126 Starlight Ter | 0.14mi | 3/1.0 | 966 (-13%) | 22mo | $135,990 | $141 | 49 |
| 5714 Bienville | 0.67mi | 3/1.0 | 977 (-12%) | 11mo | $91,500 | $94 | 35 |
| 5711 Bienville Dr | 0.66mi | 3/1.0 | 963 (-13%) | 24mo | $180,000 | $187 | 23 |
Match score weights: distance 35% · size 25% · config 20% · recency 20%. Top-matched comps best support the ARV.
Projected returns pro-forma
-3.0% appreciation · 0.0% rent growth · sell at horizon
- IRR
- -26.2%
- Equity multiple
- 0.14×
- Total profit
- $-39,745
- Equity at exit
- $24,587
- IRR
- -41.0%
- Equity multiple
- -0.35×
- Total profit
- $-62,245
- Equity at exit
- $14,258
Cash invested: $46,172 (down + closing). Projections, not guarantees.
Landlord ↔ Tenant lean methodology
- Overall (STATE)
- 87 Strongly Landlord-Friendly
- State Texas
- 87 Strongly Landlord-Friendly · R+5
- County
- — inherits STATE
- City
- — inherits STATE
ZIP-level market 78233
- Home prices YoY
- -31.0%
- Rents YoY
- -0.1%
- Active inventory
- 308
- Price-to-rent
- 9.2×
Monthly cashflow live
- Estimated rent
- $1,486 high interval (Pro) →
- Mortgage (P&I)
- −$865
- Tax from tax record
- −$379 /mo · $4,542/yr
- Insurance
- −$69
- HOA
- −$0
- Vacancy / Maint / Mgmt
- −$312
- Net cashflow
- $-138
Break-even live
Sensitivity live
| Price | -10% $-45 | -5% $-91 | +0% $-138 | +5% $-185 | +10% $-231 |
|---|---|---|---|---|---|
| Rent | -10% $-256 | -5% $-197 | +0% $-138 | +5% $-79 | +10% $-21 |
| Rate | -1.0pp $-55 | -0.5pp $-96 | base $-138 | +0.5pp $-181 | +1.0pp $-224 |
UW: 25.0% down · 7.5% · 30yr · 1.5% tax · 5.0% vac · 8.0% maint · 8.0% mgmt
Financing live
Cash to close
- Down payment
- $41,225
- Closing costs
- $4,947
- Reserves months
- —
- Total cash needed
- —
Loan-product check · same deal, 3 products live
Conventional
25% down · 7.5% · 30yr
- Down + closing
- —
- Monthly P&I
- —
- Monthly cashflow
- —
- DSCR
- —
- Eligible?
- —
Personal DTI + credit; lowest rate.
DSCR
20% down · 8.5% · 30yr
- Down + closing
- —
- Monthly P&I
- —
- Monthly cashflow
- —
- DSCR
- —
- Eligible?
- —
No personal income docs; deal must DSCR.
Hard money
10% down · 12.0% · 12mo
- Down + closing
- —
- Monthly P&I
- —
- Monthly cashflow
- —
- DSCR
- —
- Eligible?
- —
Short-term bridge; refi at stabilization.
Rent comps 40 comps
| Address | Beds | Baths | Sqft | Rent | $/sqft | DOM | Units | Dist |
|---|---|---|---|---|---|---|---|---|
| 214 Earlyway Dr San Antonio, TX | 3.0 | 1.0 | 1300 | $1,500 | $1.15 | 6d | 1 | 0.17mi |
| 9919 Grove Mist Unit 104 San Antonio, TX | 3.0 | 2.5 | 1300 | $1,425 | $1.10 | 9d | 1 | 0.37mi |
| 9919 Grove Mist Unit 4 San Antonio, TX | 3.0 | 2.5 | 1360 | $1,495 | $1.10 | 25d | 1 | 0.37mi |
| 9934 Hazy Bnd San Antonio, TX | 3.0 | 2.5 | 1225 | $1,538 | $1.26 | 4d | 2 | 0.37mi |
| 9934 Hazy Bnd Unit 101 San Antonio, TX | 3.0 | 2.5 | 1225 | $1,400 | $1.14 | 45d | 1 | 0.37mi |
| 9934 Hazy Bnd Unit 104 San Antonio, TX | 3.0 | 2.5 | 1225 | $1,675 | $1.37 | 45d | 1 | 0.37mi |
| 9911 Grove Mist Unit 102 San Antonio, TX | 3.0 | 2.5 | 1225 | $1,550 | $1.27 | 25d | 1 | 0.38mi |
| 9911 Grove Mist Unit 101 San Antonio, TX | 3.0 | 2.5 | 1225 | $1,345 | $1.10 | 45d | 1 | 0.38mi |
| 9911 Grove Mist San Antonio, TX | 3.0 | 2.5 | 1225 | $1,345 | $1.10 | 12d | 2 | 0.38mi |
| 9930 Hazy Bnd Unit 3 San Antonio, TX | 3.0 | 2.5 | 1225 | $1,375 | $1.12 | 45d | 1 | 0.38mi |
| 3 Basin Elm San Antonio, TX | 3.0 | 2.0 | 1437 | $1,595 | $1.11 | 0d | 1 | 0.39mi |
| 9903 Grove Mist Unit 101 San Antonio, TX | 3.0 | 2.5 | 1225 | $1,345 | $1.10 | 45d | 1 | 0.39mi |
| 9903 Grove Mist Unit 102 San Antonio, TX | 3.0 | 2.5 | 1225 | $1,345 | $1.10 | 25d | 1 | 0.39mi |
| 9903 Grove Mist San Antonio, TX | 3.0 | 2.5 | 1225 | $1,345 | $1.10 | 4d | 2 | 0.39mi |
| 9926 Hazy Bnd Unit 104 San Antonio, TX | 3.0 | 2.5 | 1298 | $1,395 | $1.07 | 45d | 1 | 0.39mi |
| 9926 Hazy Bnd Unit 104 San Antonio, TX | 3.0 | 2.5 | 1298 | $1,395 | $1.07 | 18d | 1 | 0.39mi |
| 11 Basin Elm San Antonio, TX | 3.0 | 2.5 | 1437 | $1,550 | $1.08 | 6d | 1 | 0.40mi |
| 9918 Hazy Bnd Unit 104 San Antonio, TX | 3.0 | 2.5 | 1246 | $1,350 | $1.08 | 16d | 1 | 0.41mi |
| 5206 Wurzbach Pkwy Unit 710 San Antonio, TX | 2.0 | 2.0 | 1024 | $1,545 | $1.51 | 0d | 1 | 0.42mi |
| 9910 Hazy Bnd San Antonio, TX | 3.0 | 2.5 | 1225 | $1,400 | $1.14 | 22d | 1 | 0.42mi |
| 9910 Hazy Bnd Unit 1 San Antonio, TX | 3.0 | 2.5 | 1225 | $1,400 | $1.14 | 25d | 1 | 0.42mi |
| 9906 Hazy Bnd Unit 104 San Antonio, TX | 3.0 | 2.5 | 1225 | $1,350 | $1.10 | 16d | 1 | 0.42mi |
| 9906 Hazy Bnd Unit 104 San Antonio, TX | 3.0 | 2.5 | 1225 | $1,395 | $1.14 | 45d | 1 | 0.42mi |
| 9906 Hazy Bnd Unit 103 San Antonio, TX | 3.0 | 2.5 | 1225 | $1,375 | $1.12 | 25d | 1 | 0.42mi |
| 9906 Hazy Bnd San Antonio, TX | 3.0 | 2.5 | 1225 | $1,375 | $1.12 | 4d | 1 | 0.42mi |
| 7 Beacon Oak San Antonio, TX | 3.0 | 2.5 | 1446 | $1,699 | $1.17 | 5d | 1 | 0.45mi |
| 5314 Randolph Blvd Apt 903 San Antonio, TX | 2.0 | 2.0 | 924 | $1,110 | $1.20 | 25d | 1 | 0.47mi |
| 5314 Randolph Blvd Apt 714 San Antonio, TX | 2.0 | 2.0 | 924 | $1,110 | $1.20 | 45d | 1 | 0.47mi |
| 5314 Randolph Blvd Apt 603 San Antonio, TX | 2.0 | 1.0 | 842 | $1,010 | $1.20 | 6d | 1 | 0.47mi |
| 18 Beacon Bay San Antonio, TX | 3.0 | 2.5 | 1441 | $1,695 | $1.18 | 45d | 1 | 0.54mi |
| 10306 Pinehurst Run San Antonio, TX | 3.0 | 2.0 | 1271 | $1,750 | $1.38 | 0d | 1 | 0.67mi |
| 11411 Crosswinds Way San Antonio, TX | 3.0 | 1.0–2.0 | 944 | $2,101 | $2.22 | 4d | 20 | 0.79mi |
| 5411 Encanta St San Antonio, TX | 3.0 | 1.5 | 1053 | $1,435 | $1.36 | 45d | 1 | 0.86mi |
| 8835 Willmon Way Windcrest, TX | 1.0–3.0 | 1.0–2.0 | 979 | $1,155 | $1.18 | 0d | 12 | 0.93mi |
| 4530 Longvale Dr San Antonio, TX | 3.0 | 1.0 | 1000 | $1,375 | $1.38 | 16d | 1 | 1.01mi |
| 4527 Clear Spring Dr San Antonio, TX | 3.0 | 1.5 | 1098 | $1,350 | $1.23 | 25d | 1 | 1.03mi |
| 4620 Thousand Oaks Dr San Antonio, TX | 1.0–2.0 | 1.0–2.0 | 717 | $1,205 | $1.68 | 9d | 19 | 1.03mi |
| 11823 Casa Alto St San Antonio, TX | 3.0 | 1.0 | 968 | $1,340 | $1.38 | 0d | 1 | 1.05mi |
| 4518 Clear Spring Dr San Antonio, TX | 3.0 | 1.0 | 864 | $1,275 | $1.48 | 16d | 1 | 1.06mi |
| 4502 Longvale Dr San Antonio, TX | 3.0 | 2.0 | 1092 | $1,600 | $1.47 | 6d | 1 | 1.09mi |
Listing history 32 events
-
2026-05-19historical Active Option 53-char remark
Show marketing remark (53 chars)
Excellent Move-in Ready home is ready for new owners!
-
2026-05-12price $164,900 53-char remark
Show marketing remark (53 chars)
Excellent Move-in Ready home is ready for new owners!
-
2026-05-12status Back on Market 53-char remark
Show marketing remark (53 chars)
Excellent Move-in Ready home is ready for new owners!
-
2026-05-10historical 53-char remark
Show marketing remark (53 chars)
Excellent Move-in Ready home is ready for new owners!
-
2026-04-29status Back on Market 53-char remark
Show marketing remark (53 chars)
Excellent Move-in Ready home is ready for new owners!
-
2026-04-26historical 53-char remark
Show marketing remark (53 chars)
Excellent Move-in Ready home is ready for new owners!
-
2026-04-07price $168,990 53-char remark
Show marketing remark (53 chars)
Excellent Move-in Ready home is ready for new owners!
-
2026-04-07status Back on Market 53-char remark
Show marketing remark (53 chars)
Excellent Move-in Ready home is ready for new owners!
-
2026-04-05historical 53-char remark
Show marketing remark (53 chars)
Excellent Move-in Ready home is ready for new owners!
-
2026-03-09status Back on Market 53-char remark
Show marketing remark (53 chars)
Excellent Move-in Ready home is ready for new owners!
-
2026-03-08historical 53-char remark
Show marketing remark (53 chars)
Excellent Move-in Ready home is ready for new owners!
-
2026-02-25$169,500 New 53-char remark
Show marketing remark (53 chars)
Excellent Move-in Ready home is ready for new owners!
-
2026-02-21historical
-
2026-02-15price $169,900
-
2026-02-10price $177,790
-
2026-02-02$184,750 New
-
2025-12-17soldstatus Sold
-
2025-12-12soldstatus
-
2025-12-01historical Active Option
-
2025-11-26status Back on Market
-
2025-11-17historical Active Option
-
2025-11-12status Back on Market
-
2025-11-01historical Active Option
-
2025-10-13price $152,000
-
2025-09-17status Back on Market
-
2025-09-08historical Active RFR
-
2025-07-18price $159,000
-
2025-05-30$164,000 New
-
2004-08-12soldstatus
-
2004-08-10soldstatus
-
2004-05-10$62,900
-
2000-10-17soldstatus
ⓘ Source: listings_history table (triggers on properties + properties_extension) + one-shot
backfill from property_details.listing_events for pre-trigger history.
Tax reassessment forecast TX · Resets to sale price
- Current annual tax
- $4,542 · $379/mo
- Projected year-2 tax
- $4,542 · $379/mo
- Expected delta
- $0/yr ($0/mo · 0.0%)
ⓘ Screening estimate from a state-policy table — verify with the county assessor before closing.
Climate risk First Street
- Flood 1/10 Low FEMA zone X (unshaded) · 0% chance over 30 yrs
- Wildfire 1/10 Low
- Heat 8/10 Severe 7 d/yr ≥107°F today · 22 d/yr by 30 yrs out
- Wind 8/10 Severe 80% chance of damaging wind over 30 yrs
- Air quality 2/10 Low 0 unhealthy d/yr today · 1 by 30 yrs out
Nearby sold comps map
Loading sold comps map…
Walkable amenities ~0.75 mi
Loading nearby amenities…
Taxation est. · year 1
- Rental income
- $17,831
- − Mortgage interest
- −$9,237
- − Property taxes
- −$4,542
- − Insurance
- −$824
- − Repairs & maintenance
- −$1,426
- − Management
- −$1,426
- − Depreciation
- −$4,797
- Taxable loss
- −$4,423
- Est. tax savings @ 24.0%
- +$1,062
- After-tax cash flow
- $-596/yr
For passive investors: Depreciation is non-cash, so a rental often shows a tax loss while cash-flowing — sheltering income. Rental losses are passive: they offset passive income freely, and up to $25,000/yr can offset ordinary (W-2) income if you actively participate and your MAGI is under $100k (phasing out to $0 by $150k); unused losses carry forward. On sale, claimed depreciation is recaptured at up to 25%, and gains may owe capital-gains tax (a 1031 exchange can defer both). Figures are a year-1 estimate at your 24.0% rate — not tax advice; consult a CPA.
Schools (NCES district)
- District
- North East ISD
- NCES district ID
- 4832940
- Math proficiency
- 38% ▼ -14.00%
- Reading proficiency
- 49% ▼ -4.00%
- Median HH income
- $57,715
- Composite
- 38.1/100
- National rank
- #4276
- State rank
- #276 of 826 in TX
Livability — San Antonio
- Score
- 80/100
- State rank
- #31
- US rank
- #1616
Category grades
Schools grade is shown separately in the Schools card above.
Census & demographics
- Census place
- San Antonio, TX
- County
- Bexar County · 1,990,555 people
- City population
- 1,806,925
- Metro
- San Antonio-New Braunfels, TX
- Population (ZIP)
- 48,911
- Household income
- $76,421
- Rent vs Own
- Severe rent burden
- 1635.0
Population outlook (Bexar County) Hauer SSP2
- Today (2025)
- 2,336,851 people
- By 2030
- 2,560,728 · +9.6%
- By 2040
- 3,020,569 · +29.3%
- By 2050
- 3,493,522 · +49.5%
- By 2075
- 4,668,459 · +99.8%
- By 2100
- 5,533,242 · +136.8%
Race, ethnicity, and origin ACS 2023
- Neighborhood character
- Diverse neighborhood (Simpson 0.62)
- Race & ethnicity
- Hispanic / Latino 52% White 31% Two or more races 23% Black 11% Asian 3% Native American 1%
- Hispanic origin (detail)
- Mexican 42% Puerto Rican 3%
- Common ancestry
- Romanian 1% Lithuanian 1% Italian 1%
- Foreign-born
- 12% · Canada, South Korea, Vietnam
- Languages at home
- 69% English-only · Spanish 27% Korean 1% Other Asian/Pacific 1%
Political lean MEDSL · Bexar
- 2024 margin
- Lean D (+9.8) · D 54.3% · R 44.6% · Other 1.1%
- 2008→2024 swing
- +4.2pp toward D · 2008: 5.6pp · 2024: 9.8pp
- All cycles
- 2024: D+9.8 2020: D+18.2 2016: D+13.5 2012: D+4.6 2008: D+5.6
Not yet ingested
- Civics
- —
Market trends
- HPI YoY
- ▼ -123.27%
- Current HPI
- 274.943
- Rent YoY
- ▼ -0.06%
- Metro
- San Antonio-New Braunfels, TX
- State GDP YoY
- ▲ 3.95%
- F500 in state
- 110
Industry mix (Fortune 500 HQ in TX)
| Industry | F500 HQs | Revenue |
|---|---|---|
| Energy | 16 | $1,198B |
|
||
| Technology | 5 | $198B |
|
||
| Engineering / Construction | 4 | $72B |
|
||
| Energy Services | 3 | $60B |
|
||
| Utilities | 3 | $41B |
|
||
| Healthcare | 2 | $330B |
|
||
Price history
+162.2% since first listed32 events — show timeline
- 2026-05-19 Contingent — LERA
- 2026-05-12 Price Changed $164,900 LERA
- 2026-05-12 Relisted — LERA
- 2026-05-10 Listing Removed — LERA
- 2026-04-29 Relisted — LERA
- 2026-04-26 Listing Removed — LERA
- 2026-04-07 Price Changed $168,990 LERA
- 2026-04-07 Relisted — LERA
- 2026-04-05 Listing Removed — LERA
- 2026-03-09 Relisted — LERA
- 2026-03-08 Listing Removed — LERA
- 2026-02-25 Listed $169,500 LERA
- 2026-02-21 Listing Removed — LERA
- 2026-02-15 Price Changed $169,900 LERA
- 2026-02-10 Price Changed $177,790 LERA
- 2026-02-02 Listed $184,750 LERA
- 2025-12-17 Sold (MLS) — LERA
- 2025-12-12 Sold (Public Records) — Public Records
- 2025-12-01 Contingent — LERA
- 2025-11-26 Relisted — LERA
- 2025-11-17 Contingent — LERA
- 2025-11-12 Relisted — LERA
- 2025-11-01 Contingent — LERA
- 2025-10-13 Price Changed $152,000 LERA
- 2025-09-17 Relisted — LERA
- 2025-09-08 Contingent — LERA
- 2025-07-18 Price Changed $159,000 LERA
- 2025-05-30 Listed $164,000 LERA
- 2004-08-12 Sold (Public Records) — Public Records
- 2004-08-10 Sold (MLS) — LERA
- 2004-05-10 Listed $62,900 LERA
- 2000-10-17 Sold (Public Records) — Public Records
Property tax history
+7.4%/yrLatest (2025): $4,542 · -2.2% YoY. Source: county tax records.
Cash-flow waterfall
monthlySold comps — $/sqft
last 12 mo · ≤1 miLoading sold comps…