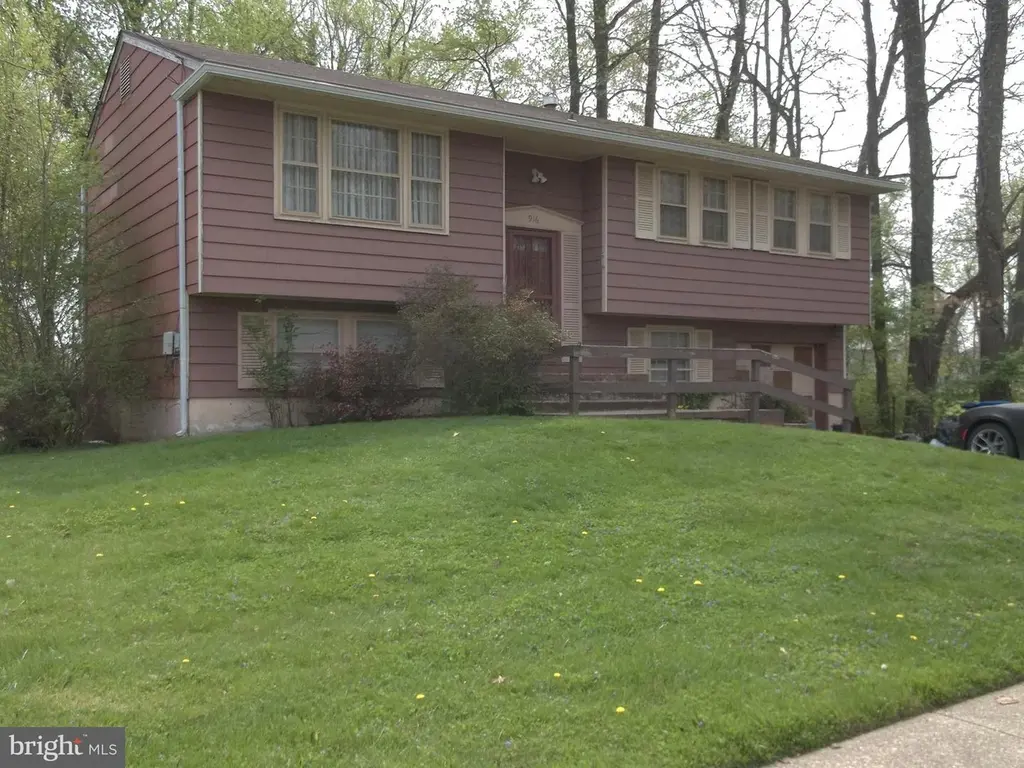
916 Russo Dr · Burlington, NJ
Flood risk 1/10 · Minimal
- FEMA flood zone
- X (unshaded)
- Chance of flooding over 30 yrs
- 0.0%
- Est. flood insurance / yr
- $507 – $1,088
Fire risk 1/10 · Minimal
- Est. fire insurance / yr
- $526 – $976
Heat risk 7/10 · Major
- Hot days now (above 104°F)
- 7 days/yr
- Hot days in 30 yrs
- 15 days/yr
Wind risk 6/10 · Moderate
- Chance of severe wind over 30 yrs
- 55.0%
Air-quality risk 4/10 · Minor
- Unhealthy air days now
- 5 days/yr
- Unhealthy air days in 30 yrs
- 7 days/yr
Risk factors via First Street. Map © Google.
Why this score? — see what drove the B- grade
The composite is a weighted blend of 9 inputs, each scored 0–100. Each bar is that input's sub-score; the figure is the points it added to the 100-point composite (weight × sub-score).
- Cash flow +25.2/30.0
- ARV discount +15.0/15.0
- DSCR +8.3/10.0
- 1% rule +6.8/10.0
- Livability +3.9/5.0
- Schools +3.1/10.0
- Rent growth +2.9/5.0
- Condition / age +2.5/5.0
- Appreciation +0.0/10.0
$325,000
🖨 Deal sheet (PDF) 📄 Offer letter ✓ Due diligence
Listing remarks
Inviting Potential! This 3 bedroom, 1.5 bath bi-level home is being sold in "AS IS" condition offering a fantastic opportunity to customize to buyers desires. Located in a welcoming neighborhood and community, the home also features a single car garage, nice size front and back yard with great curb appeal. With some updating and finishing touches, the house can be a dream space to call home!
Key facts
- 9,200 sq ft lot
- Garage
- Built 1963
Property features AI
Exterior
- Parking: Attached 1-car garage with garage door opener and additional storage area; Driveway parking; On-street parking
- Utilities: Public water; Public sewer; Electric cooling fuel; Natural gas for heating and hot water
- Home design: Detached structure; Frame construction; Built according to assessor records
- Construction: Frame construction; Slab foundation; Above-grade and below-grade structures noted
- Exterior features: Lot approximately 80 x 115; No tidal water
Interior
- Bedrooms: 3 bedrooms on the main level
- Bathrooms: 1 full bathroom on the main level; 1 half bathroom on the main level
- Heating & cooling: Forced air heating (natural gas); Cooling via ceiling fans and window units (electric); Natural gas hot water
- Interior features: Brick fireplace (1)
- Laundry & utility: Laundry on lower floor
Neighborhood map
What this means for you Summary
Snapshot
- This is a 3-bed/1.5-bath single-family listed at $325k.
Deal economics
- At list price, monthly cash flow is $730 ($9k/yr) — positive.
- The deal already cash-flows at list — no discount required.
- Meets the 1% rule at list price ($4k rent vs $325k).
- Cap rate 9.0% vs local median 4.9% in Burlington — top-decile yield for the area; either an underpriced asset or a hidden risk that comps aren't pricing in. Stress-test before assuming the spread holds.
Location & tenants
- Location reads 78/100 on livability (#89 in NJ, #2,359 nationally) — a middle-class / working-renter tenant base. Strengths: housing A+, health & safety A+, cost of living A-; Watch: amenities F.
- Westampton Township Public School District (suburban): math 17% / reading 44% proficiency, ranked #288 of 472 in NJ (top 61%) — families likely to look elsewhere, expect single-tenant / working-renter base with shorter leases; only 15% free/reduced lunch — higher-income household profile.
- Zoned schools: Holly Hills Elementary School (math 17% / reading 42%, grade F, #731 of 1,303 statewide, top 59%, 394 students, 19% FRL); Westampton Township Middle School (math 17% / reading 45%, grade F, #299 of 431 statewide, top 70%, 529 students, 22% FRL); Rancocas Valley Regional High School (math 29% / reading 49%, grade F, #197 of 399 statewide, top 51%, 1,981 students, 25% FRL).
- Market conditions: Rents rising (+1.4%/yr); 137 active listings in the ZIP; 10 comparable units currently listed for rent nearby; rentals leasing fast (median 1d on market — plan ~1-2 weeks tenant-placement turnaround); solid renter incomes; 2,161 units permitted in Burlington County in 2024 (988 in 5+ unit buildings).
- This rent runs 42% of the median local income ($109k/yr) — at the standard rent-burdened threshold; future hikes will face affordability resistance.
Forward outlook
- Local home prices are declining (-3.0%/yr); year-one equity from $2k of loan paydown is wiped out by about $10k of value loss. Plan a longer hold.
- Burlington County population projected to shrink 5% by 2050 — rents likely to lag national; underwrite the cash flow, not the appreciation.
Negotiation context
- Only 4 days on market — expect competitive offers; lowballing is unlikely to land.
Risks & watch-outs
- Climate carrying-cost: major wind risk, 55% chance of damaging wind over 30y; extreme-heat days projected 7→15/yr by 2055 (HVAC capex compounding) — expect insurance premiums to compound above CPI over the hold.
Questions for the listing agent
- Built in 1963 — when were the roof, HVAC, electrical panel, plumbing, and water heater last replaced?
- Is there a deadline driving the sale (1031 exchange, divorce, estate, relocation)? That informs how much negotiation room exists.
- What's the average days-on-market for RENTAL listings here right now (not sales)? A rising rental-DOM trend means longer vacancies and softer asking-rent achievability than the comps imply.
- What's the recent tenant-quality profile in this submarket — average credit score on applications, eviction rate, late-payment / NSF rate, and stable-employment percentage? A property-management company in the area should have these aggregated.
- How much new for-sale + rental construction is in the pipeline within 1–3 miles? Heavy new supply typically softens prices + rents 12–24 months out; constrained supply supports both.
Investment metrics
- 1% rule
- 1.18% ✓
- Cap rate
- 8.99%
- Cash-on-cash
- 9.63%
- DSCR
- 1.43
- GRM
- 7.1
CMA / ARV
- ARV (on-the-fly)
- $461,482
- Comps found
- 12
Show comp detail 12 sales within ~0.75 mi
| Address | Dist | Beds/Ba | Sqft | Sold | Price | $/sf | Match |
|---|---|---|---|---|---|---|---|
| 916 Russo Dr | 0.00mi | 3/1.5 | 1,666 (0%) | 1mo | $310,000 | $186 | 100 |
| 901 Russo Dr | 0.12mi | 3/1.5 | 1,666 (0%) | 6mo | $350,000 | $210 | 90 |
| 21 Whitlow Dr | 0.19mi | 4/2.0 (+1) | 1,700 (+2%) | 1mo | $475,000 | $279 | 80 |
| 71 Dover Rd | 0.38mi | 3/1.5 | 1,584 (-5%) | 7mo | $420,000 | $265 | 68 |
| 16 Lancaster Ct | 0.08mi | 4/2.5 (+1) | 1,858 (+12%) | 0mo | $485,000 | $261 | 68 |
| 19 Quail Hollow Dr | 0.46mi | 3/1.5 | 1,572 (-6%) | 3mo | $435,000 | $277 | 66 |
| 606 Price Dr | 0.14mi | 4/2.0 (+1) | 1,468 (-12%) | 3mo | $385,000 | $262 | 64 |
| 4 Brighton Ct | 0.48mi | 4/1.5 (+1) | 1,748 (+5%) | 2mo | $400,000 | $229 | 63 |
| 70 Tarnsfield Dr | 0.47mi | 4/— (+1) | 1,508 (-10%) | 2mo | $485,000 | $322 | 56 |
| 7 Seeley Dr | 0.47mi | 4/2.0 (+1) | 1,516 (-9%) | 9mo | $450,000 | $297 | 49 |
| 745 Holly Ln | 0.48mi | 3/2.0 | 1,428 (-14%) | 5mo | $430,000 | $301 | 48 |
| 115 Stratton Dr | 0.51mi | 4/2.0 (+1) | 1,470 (-12%) | 11mo | $469,900 | $320 | 41 |
Match score weights: distance 35% · size 25% · config 20% · recency 20%. Top-matched comps best support the ARV.
Projected returns pro-forma
-3.0% appreciation · 1.42% rent growth · sell at horizon
- IRR
- -3.6%
- Equity multiple
- 0.87×
- Total profit
- $-12,056
- Equity at exit
- $48,459
- IRR
- 4.2%
- Equity multiple
- 1.28×
- Total profit
- $25,927
- Equity at exit
- $28,100
Cash invested: $91,000 (down + closing). Projections, not guarantees.
Landlord ↔ Tenant lean methodology
- Overall (STATE)
- 21 Tenant-Leaning
- State New Jersey
- 21 Tenant-Leaning · D+6
- County
- — inherits STATE
- City
- — inherits STATE
ZIP-level market 08060
- Home prices YoY
- -34.5%
- Rents YoY
- 1.4%
- Active inventory
- 137
- Price-to-rent
- 7.1×
Monthly cashflow live
- Estimated rent
- $3,829 high interval (Pro) →
- Mortgage (P&I)
- −$1,704
- Tax from tax record
- −$455 /mo · $5,462/yr
- Insurance
- −$135
- HOA
- −$0
- Vacancy / Maint / Mgmt
- −$804
- Net cashflow
- $730
Break-even live
Sensitivity live
| Price | -10% $914 | -5% $822 | +0% $730 | +5% $638 | +10% $546 |
|---|---|---|---|---|---|
| Rent | -10% $428 | -5% $579 | +0% $730 | +5% $882 | +10% $1,033 |
| Rate | -1.0pp $894 | -0.5pp $813 | base $730 | +0.5pp $646 | +1.0pp $560 |
UW: 25.0% down · 7.5% · 30yr · 1.5% tax · 5.0% vac · 8.0% maint · 8.0% mgmt
Financing live
Cash to close
- Down payment
- $81,250
- Closing costs
- $9,750
- Reserves months
- —
- Total cash needed
- —
Loan-product check · same deal, 3 products live
Conventional
25% down · 7.5% · 30yr
- Down + closing
- —
- Monthly P&I
- —
- Monthly cashflow
- —
- DSCR
- —
- Eligible?
- —
Personal DTI + credit; lowest rate.
DSCR
20% down · 8.5% · 30yr
- Down + closing
- —
- Monthly P&I
- —
- Monthly cashflow
- —
- DSCR
- —
- Eligible?
- —
No personal income docs; deal must DSCR.
Hard money
10% down · 12.0% · 12mo
- Down + closing
- —
- Monthly P&I
- —
- Monthly cashflow
- —
- DSCR
- —
- Eligible?
- —
Short-term bridge; refi at stabilization.
Rent comps 10 comps
| Address | Beds | Baths | Sqft | Rent | $/sqft | DOM | Units | Dist |
|---|---|---|---|---|---|---|---|---|
| 502 Bloomfield Dr Westampton, NJ | 4.0 | 3.0 | 1666 | $4,950 | $2.97 | 0d | 1 | 0.14mi |
| 501 Bloomfield Dr Westampton, NJ | 4.0 | 2.0 | 1975 | $4,950 | $2.51 | 0d | 1 | 0.17mi |
| 1 Kirby Ct Mt Holly, NJ | 1.0–3.0 | 1.0–2.5 | 1349 | $3,125 | $2.32 | 0d | 13 | 0.40mi |
| 302 Barrington Ct Mt Holly, NJ | 1.0–3.0 | 1.0–2.5 | 1226 | $2,959 | $2.41 | 0d | 11 | 0.43mi |
| 10 Stanton Rd Mount Holly, NJ | 3.0 | 2.5 | 2208 | $3,300 | $1.49 | 0d | 1 | 0.51mi |
| 64 Regency Dr Mt Holly, NJ | 1.0–3.0 | 1.0–2.0 | 1066 | $2,800 | $2.63 | 0d | 1 | 0.61mi |
| 144 Washington St Unit C Mt Holly, NJ | 3.0 | 1.0 | 1450 | $2,370 | $1.63 | 17d | 1 | 1.03mi |
| 209 Front St Mount Holly, NJ | 4.0 | 2.5 | 1500 | $4,950 | $3.30 | 0d | 1 | 1.23mi |
| 37 Church St Mount Holly, NJ | 3.0 | 1.5 | 1900 | $2,370 | $1.25 | 12d | 1 | 1.31mi |
| 209 Mill St Mount Holly, NJ | 3.0 | 1.5 | 1274 | $2,400 | $1.88 | 3d | 1 | 1.39mi |
Listing history 4 events
-
2026-05-18status Pending
-
2026-05-04historical
-
2026-05-01$325,000 Active
-
2026-04-17historical $325,000
ⓘ Source: listings_history table (triggers on properties + properties_extension) + one-shot
backfill from property_details.listing_events for pre-trigger history.
Tax reassessment forecast NJ · Partial reset (capped growth)
- Current annual tax
- $5,462 · $455/mo
- Projected year-2 tax
- $6,777 · $565/mo
- Expected delta
- +$1,315/yr (+$110/mo · 24.1%)
ⓘ Screening estimate from a state-policy table — verify with the county assessor before closing.
Climate risk First Street
- Flood 1/10 Low FEMA zone X (unshaded) · 0% chance over 30 yrs
- Wildfire 1/10 Low
- Heat 7/10 Severe 7 d/yr ≥104°F today · 15 d/yr by 30 yrs out
- Wind 6/10 Major 55% chance of damaging wind over 30 yrs
- Air quality 4/10 Moderate 5 unhealthy d/yr today · 7 by 30 yrs out
Nearby sold comps map
Loading sold comps map…
Walkable amenities ~0.75 mi
Loading nearby amenities…
Taxation est. · year 1
- Rental income
- $45,953
- − Mortgage interest
- −$18,205
- − Property taxes
- −$5,462
- − Insurance
- −$1,625
- − Repairs & maintenance
- −$3,676
- − Management
- −$3,676
- − Depreciation
- −$9,455
- Taxable income
- $3,854
- Est. tax owed @ 24.0%
- −$925
- After-tax cash flow
- $7,839/yr
For passive investors: Depreciation is non-cash, so a rental often shows a tax loss while cash-flowing — sheltering income. Rental losses are passive: they offset passive income freely, and up to $25,000/yr can offset ordinary (W-2) income if you actively participate and your MAGI is under $100k (phasing out to $0 by $150k); unused losses carry forward. On sale, claimed depreciation is recaptured at up to 25%, and gains may owe capital-gains tax (a 1031 exchange can defer both). Figures are a year-1 estimate at your 24.0% rate — not tax advice; consult a CPA.
Schools (NCES district)
- District
- Westampton Township Public School District
- NCES district ID
- 3417730
- Math proficiency
- 17% ▼ -21.00%
- Reading proficiency
- 44% ▼ -12.00%
- Median HH income
- $97,154
- Composite
- 31.02/100
- National rank
- #6090
- State rank
- #288 of 472 in NJ
Livability — Burlington
- Score
- 78/100
- State rank
- #89
- US rank
- #2359
Category grades
Schools grade is shown separately in the Schools card above.
Census & demographics
- County
- Burlington County · 323,710 people
- Metro
- Philadelphia-Camden-Wilmington, PA-NJ-DE-MD
- Population (ZIP)
- 25,835
- Household income
- $109,292
- Rent vs Own
- Severe rent burden
- 562.0
Population outlook (Burlington County) Hauer SSP2
- Today (2025)
- 453,425 people
- By 2030
- 452,359 · -0.2%
- By 2040
- 445,033 · -1.9%
- By 2050
- 431,760 · -4.8%
- By 2075
- 406,277 · -10.4%
- By 2100
- 364,732 · -19.6%
Race, ethnicity, and origin ACS 2023
- Neighborhood character
- Diverse neighborhood (Simpson 0.68)
- Race & ethnicity
- White 49% Black 25% Two or more races 15% Hispanic / Latino 13% Asian 4%
- Hispanic origin (detail)
- Mexican 2% Puerto Rican 7%
- Common ancestry
- Romanian 4% Lithuanian 2% Italian 1%
- Foreign-born
- 11% · Canada, Dominican Republic, China
- Languages at home
- 87% English-only · Spanish 7% Other Indo-European 2% French/Haitian/Cajun 1%
Political lean MEDSL · Burlington
- 2024 margin
- D (+16.6) · D 57.6% · R 41.0% · Other 1.3%
- 2008→2024 swing
- -2.0pp toward R · 2008: 18.6pp · 2024: 16.6pp
- All cycles
- 2024: D+16.6 2020: D+19.5 2016: D+14.8 2012: D+18.7 2008: D+18.6
Not yet ingested
- Civics
- —
Market trends
- HPI YoY
- ▼ -156.50%
- Current HPI
- 296.564
- Rent YoY
- ▲ 1.42%
- Metro
- Philadelphia-Camden-Wilmington, PA-NJ-DE-MD
- State GDP YoY
- ▲ 2.05%
- F500 in state
- 34
Industry mix (Fortune 500 HQ in NJ)
| Industry | F500 HQs | Revenue |
|---|---|---|
| Consumer Goods | 3 | $31B |
|
||
| Pharmaceuticals | 2 | $153B |
|
||
| Technology | 2 | $21B |
|
||
| Insurance | 2 | $20B |
|
||
| Healthcare | 2 | $19B |
|
||
| Financial Services | 1 | $70B |
|
||
Price history
+0.0% since first listed4 events — show timeline
- 2026-05-18 Pending — BRIGHT MLS
- 2026-05-04 Listing Removed — BRIGHT MLS
- 2026-05-01 Listed $325,000 BRIGHT MLS
- 2026-04-17 Coming Soon $325,000 BRIGHT MLS
Property tax history
+3.5%/yrLatest (2025): $5,462 · +9.6% YoY. Source: county tax records.
Cash-flow waterfall
monthlySold comps — $/sqft
last 12 mo · ≤1 miLoading sold comps…