 Fourplex
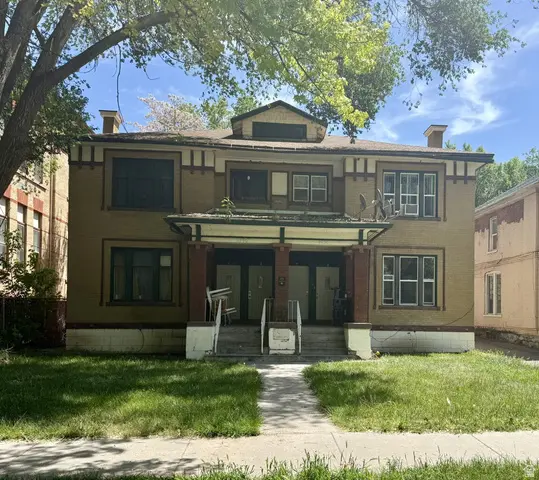
2436 S Madison Ave E · Ogden, UT
Flood risk 1/10 · Minimal
- FEMA flood zone
- X (unshaded)
- Chance of flooding over 30 yrs
- 0.0%
- Est. flood insurance / yr
- $473 – $860
Fire risk 6/10 · Moderate
- Est. fire insurance / yr
- $453 – $841
Heat risk 4/10 · Minor
- Hot days now (above 90°F)
- 7 days/yr
- Hot days in 30 yrs
- 19 days/yr
Wind risk 1/10 · Minimal
- Chance of severe wind over 30 yrs
- —
Air-quality risk 4/10 · Minor
- Unhealthy air days now
- 4 days/yr
- Unhealthy air days in 30 yrs
- 5 days/yr
Risk factors via First Street. Map © Google.
Why this score? — see what drove the C+ grade
The composite is a weighted blend of 9 inputs, each scored 0–100. Each bar is that input's sub-score; the figure is the points it added to the 100-point composite (weight × sub-score).
- Cash flow +26.0/30.0
- DSCR +8.7/10.0
- ARV discount +7.5/15.0
- 1% rule +6.9/10.0
- Livability +4.2/5.0
- Rent growth +3.1/5.0
- Condition / age +2.5/5.0
- Schools +2.4/10.0
- Appreciation +0.0/10.0
$690,000
🖨 Deal sheet (PDF) 📄 Offer letter ✓ Due diligence
Multi-family units
County records classify this as Multi-Family (2-4 Unit). Listing-text estimate: 4 units. confirmed
Listing remarks
This is your chance to own a piece of Ogden History in this unique 4 plex. Walking distance to down town Ogden. Do Not Disturb Tenants Make offer subject to inspection
Key facts
- 6,969 sq ft lot
- 4 parking spots
- Built 1912
Property features AI
Finance
- Other: Lot size approximately 0.16 acres
- Financial info: Multifamily property with 4 total units; Unit rents listed: $550, $995, $795, $895
- HOA & community: No HOA details provided
Exterior
- Parking: Uncovered open parking; 4 total parking spaces (4 open spaces)
- Security: No security details provided
- Utilities: Natural gas connected; Electricity connected; Public sewer connected; Culinary (public) water connected
- Home design: Up-and-down (multi-level) style; Residential use; Property faces west; Brick construction
- Construction: Brick construction materials; Asphalt roof; Building is built/standing
- Exterior features: Open porch; Porch lighting; Partial fencing; Curb and gutter; Paved road and sidewalks; Manual full sprinkler system; Mountain view; Flat terrain; Full landscaping with mature trees
Interior
- Kitchen: Range/oven included
- Bedrooms: One 1-bed unit; Two 2-bed units; One 1-bed unit (total units: 4)
- Flooring: Carpet; Laminate
- Bathrooms: Each unit has 1 bathroom (4 total)
- Heating & cooling: Gas central heating
- Interior features: Free standing range/oven; Entry foyer; Interior lighting
- Laundry & utility: No laundry details provided
Neighborhood map
What this means for you Summary
Snapshot
- This is a 4 × 6-bed/4.0-bath units multifamily listed at $690k.
Deal economics
- At list price, monthly cash flow is $2k ($21k/yr) — positive. Per door: $429/mo.
- The deal already cash-flows at list — no discount required.
- Meets the 1% rule at list price ($8k rent vs $690k).
- Recommended offer: $669k (3.0% below list) — sets the bar for market timing.
Location & tenants
- Location reads 84/100 on livability (#19 in UT, #810 nationally) — a professional / high-income tenant draw. Strengths: amenities A+, commute A+, cost of living A+; Watch: crime F.
- Ogden City District (urban): math 25% / reading 31% proficiency, ranked #72 of 80 in UT (top 90%) — low school quality limits family demand, transient renter base, plan for 1-2y turnover; 75% free/reduced lunch — lower-income household profile, screen leases tightly.
- Zoned schools: James Madison School (math 8% / reading 17%, grade F, #570 of 585 statewide, top 98%, 321 students, 99% FRL); Mound Fort Junior High (math 26% / reading 27%, grade F, #116 of 138 statewide, top 85%, 627 students, 98% FRL); Ogden High (math 15% / reading 37%, grade F, #137 of 171 statewide, top 81%, 1,128 students, 35% FRL) — zoned schools at 77% FRL track the district average.
- Market conditions: Rents rising (+2.4%/yr); 464 active listings in the ZIP; solid renter incomes; 1,630 units permitted in Weber County in 2024 (521 in 5+ unit buildings).
- At $8,206/mo this rent would consume 122% of the median local household income ($81k/yr) (locally 1027% of renters already pay >50% of income on rent) — very limited rent-growth headroom before tenants either downsize or default.
Forward outlook
- Local home prices are declining (-3.0%/yr); year-one equity from $5k of loan paydown is wiped out by about $21k of value loss. Plan a longer hold.
- Weber County population projected at +24% by 2050 — long-run rental-demand tailwind backs the buy-and-hold thesis.
Negotiation context
- It's been on market 31 days — a 3% lower offer ($669k) is reasonable based on typical stale-listing flexibility.
- 7 sale attempts since 25y ago with the ask held roughly flat each time — persistent listings suggest the price (not the market) is what's stuck; bring a comps-based counter.
Risks & watch-outs
- Watch-outs: built in 1912 — expect roof / HVAC / electrical / plumbing capex.
- Climate carrying-cost: major wildfire risk — expect insurance premiums to compound above CPI over the hold.
Questions for the listing agent
- It's been on market 31 days. Have you received any prior offers? Is the seller open to a 3% concession, seller financing, or rate buy-down credit?
- Can we see the unit-by-unit rent roll, current vacancy, and any below-market leases? What's the average tenancy length?
- What capital expenditures (roof, boiler, parking lot, exteriors) have been made in the last 5 years, and what's planned in the next 2?
- Built in 1912 — when were the roof, HVAC, electrical panel, plumbing, and water heater last replaced?
- Is there a deadline driving the sale (1031 exchange, divorce, estate, relocation)? That informs how much negotiation room exists.
- Crime grade is F in this area — have there been break-ins, vandalism, or insurance claims at this property in the last 3 years? What carrier currently insures it and at what premium?
- What's the average days-on-market for RENTAL listings here right now (not sales)? A rising rental-DOM trend means longer vacancies and softer asking-rent achievability than the comps imply.
- What's the recent tenant-quality profile in this submarket — average credit score on applications, eviction rate, late-payment / NSF rate, and stable-employment percentage? A property-management company in the area should have these aggregated.
- How much new apartment / multifamily construction is in the pipeline within 1–3 miles? Heavy new supply (>2% of stock underway) typically softens rents 12–24 months out; light construction supports rent growth.
Investment metrics
- 1% rule
- 1.19% ✓
- Cap rate
- 9.27%
- Cash-on-cash
- 10.65%
- DSCR
- 1.47
- GRM
- 7.0
CMA / ARV
No comps found within radius.
Projected returns pro-forma
-3.0% appreciation · 2.43% rent growth · sell at horizon
- IRR
- -1.0%
- Equity multiple
- 0.96×
- Total profit
- $-7,181
- Equity at exit
- $102,881
- IRR
- 8.1%
- Equity multiple
- 1.60×
- Total profit
- $115,859
- Equity at exit
- $59,659
Cash invested: $193,200 (down + closing). Projections, not guarantees.
Landlord ↔ Tenant lean methodology
- Overall (STATE)
- 86 Strongly Landlord-Friendly
- State Utah
- 86 Strongly Landlord-Friendly · R+15
- County
- — inherits STATE
- City
- — inherits STATE
ZIP-level market 84401
- Rents YoY
- 2.4%
- Active inventory
- 464
- Price-to-rent
- 28.0×
Monthly cashflow live
- Estimated rent
- $8,206 medium interval (Pro) →
- Mortgage (P&I)
- −$3,618
- Tax est. 1.5%
- −$862 /mo · $10,350/yr
- Insurance
- −$288
- HOA
- −$0
- Vacancy / Maint / Mgmt
- −$1,723
- Net cashflow
- $1,714
Break-even live
Sensitivity live
| Price | -10% $2,191 | -5% $1,953 | +0% $1,714 | +5% $1,476 | +10% $1,237 |
|---|---|---|---|---|---|
| Rent | -10% $1,066 | -5% $1,390 | +0% $1,714 | +5% $2,038 | +10% $2,363 |
| Rate | -1.0pp $2,062 | -0.5pp $1,890 | base $1,714 | +0.5pp $1,536 | +1.0pp $1,354 |
4-unit breakdown (identical units grouped — click to expand)
| Units | Beds | Baths | Est. rent |
|---|---|---|---|
| 4× units | 6 | 4 | $8,208 |
| #1 | 6 | 4 | $2,052 |
| #2 | 6 | 4 | $2,052 |
| #3 | 6 | 4 | $2,052 |
| #4 | 6 | 4 | $2,052 |
| Total (4 units) | $8,206 | ||
UW: 25.0% down · 7.5% · 30yr · 1.5% tax · 5.0% vac · 8.0% maint · 8.0% mgmt
Financing live
Cash to close
- Down payment
- $172,500
- Closing costs
- $20,700
- Reserves months
- —
- Total cash needed
- —
Loan-product check · same deal, 3 products live
Conventional
25% down · 7.5% · 30yr
- Down + closing
- —
- Monthly P&I
- —
- Monthly cashflow
- —
- DSCR
- —
- Eligible?
- —
Personal DTI + credit; lowest rate.
DSCR
20% down · 8.5% · 30yr
- Down + closing
- —
- Monthly P&I
- —
- Monthly cashflow
- —
- DSCR
- —
- Eligible?
- —
No personal income docs; deal must DSCR.
Hard money
10% down · 12.0% · 12mo
- Down + closing
- —
- Monthly P&I
- —
- Monthly cashflow
- —
- DSCR
- —
- Eligible?
- —
Short-term bridge; refi at stabilization.
Listing history 32 events
-
2026-06-21days on market $690,000 Active 31 DOM
-
2026-06-18days on market $690,000 Active 28 DOM
-
2026-06-17days on market $690,000 Active 27 DOM
-
2026-06-16days on market $690,000 Active 26 DOM
-
2026-06-15days on market $690,000 Active 25 DOM
-
2026-06-14days on market $690,000 Active 23 DOM
-
2026-06-13days on market $690,000 Active 22 DOM
-
2026-06-10days on market $690,000 Active 20 DOM
-
2026-06-09days on market $690,000 Active 19 DOM
-
2026-06-08days on market $690,000 Active 18 DOM
-
2026-06-07days on market $690,000 Active 17 DOM
-
2026-06-05days on market $690,000 Active 14 DOM
-
2026-06-03days on market $690,000 Active 13 DOM
-
2026-06-02days on market $690,000 Active 12 DOM
-
2026-06-01days on market $690,000 Active 11 DOM
-
2026-05-31days on market $690,000 Active 10 DOM
-
2026-05-31days on market $690,000 Active 9 DOM
-
2026-05-21$690,000 Active
-
2019-05-15historical
-
2019-03-26$389,900 Active
-
2018-04-12historical
-
2018-04-08$299,900 Active
-
2016-03-12status Under Contract
-
2016-02-18soldstatus Sold
-
2016-02-12historical
-
2015-11-20$225,000 Active
-
2004-08-25soldstatus
-
2004-07-01$153,000
-
2004-02-06historical
-
2003-08-06$199,900
-
2001-05-31soldstatus
-
2001-01-23$180,000
ⓘ Source: listings_history table (triggers on properties + properties_extension) + one-shot
backfill from property_details.listing_events for pre-trigger history.
Climate risk First Street
- Flood 1/10 Low FEMA zone X (unshaded) · 0% chance over 30 yrs
- Wildfire 6/10 Major
- Heat 4/10 Moderate 7 d/yr ≥90°F today · 19 d/yr by 30 yrs out
- Wind 1/10 Low
- Air quality 4/10 Moderate 4 unhealthy d/yr today · 5 by 30 yrs out
Nearby sold comps map
Loading sold comps map…
Walkable amenities ~0.75 mi
Loading nearby amenities…
Taxation est. · year 1
- Rental income
- $98,472
- − Mortgage interest
- −$38,651
- − Property taxes
- −$10,350
- − Insurance
- −$3,450
- − Repairs & maintenance
- −$7,878
- − Management
- −$7,878
- − Depreciation
- −$20,073
- Taxable income
- $10,193
- Est. tax owed @ 24.0%
- −$2,446
- After-tax cash flow
- $18,125/yr
For passive investors: Depreciation is non-cash, so a rental often shows a tax loss while cash-flowing — sheltering income. Rental losses are passive: they offset passive income freely, and up to $25,000/yr can offset ordinary (W-2) income if you actively participate and your MAGI is under $100k (phasing out to $0 by $150k); unused losses carry forward. On sale, claimed depreciation is recaptured at up to 25%, and gains may owe capital-gains tax (a 1031 exchange can defer both). Figures are a year-1 estimate at your 24.0% rate — not tax advice; consult a CPA.
Schools (NCES district)
- District
- Ogden City District
- NCES district ID
- 4900720
- Math proficiency
- 25% ▼ -2.00%
- Reading proficiency
- 31% ▼ -5.00%
- Median HH income
- $41,974
- Composite
- 23.76/100
- National rank
- #7818
- State rank
- #72 of 80 in UT
Livability — Ogden
- Score
- 84/100
- State rank
- #19
- US rank
- #810
Category grades
Schools grade is shown separately in the Schools card above.
Census & demographics
- Census place
- Ogden, UT
- County
- Weber County · 260,557 people
- City population
- 152,611
- Metro
- Ogden-Clearfield, UT
- Population (ZIP)
- 48,303
- Household income
- $80,758
- Rent vs Own
- Severe rent burden
- 1027.0
Population outlook (Weber County) Hauer SSP2
- Today (2025)
- 274,329 people
- By 2030
- 288,577 · +5.2%
- By 2040
- 314,848 · +14.8%
- By 2050
- 338,710 · +23.5%
- By 2075
- 384,412 · +40.1%
- By 2100
- 409,305 · +49.2%
Race, ethnicity, and origin ACS 2023
- Neighborhood character
- Predominantly White (68%)
- Race & ethnicity
- White 68% Hispanic / Latino 25% Two or more races 8% Black 2% Asian 1%
- Hispanic origin (detail)
- Mexican 20% Puerto Rican 1%
- Common ancestry
- Slovak 4% Italian 4% Portuguese 2%
- Foreign-born
- 7% · Canada, China
- Languages at home
- 83% English-only · Spanish 15% Other Asian/Pacific 1%
Political lean MEDSL · Weber
- 2024 margin
- Strong R (+23.5) · D 36.8% · R 60.3% · Other 2.9%
- 2008→2024 swing
- +4.1pp toward D · 2008: -27.6pp · 2024: -23.5pp
- All cycles
- 2024: R+23.5 2020: R+22.7 2016: R+20.0 2012: R+46.0 2008: R+27.6
Not yet ingested
- Civics
- —
Market trends
- HPI YoY
- ▼ -265.29%
- Current HPI
- 302.8024
- Rent YoY
- ▲ 2.43%
- Metro
- Ogden-Clearfield, UT
- State GDP YoY
- ▲ 3.54%
- F500 in state
- 2
Industry mix (Fortune 500 HQ in UT)
| Industry | F500 HQs | Revenue |
|---|---|---|
| Financial Services | 1 | $3B |
|
||
Price history
+283.3% since first listed15 events — show timeline
- 2026-05-21 Listed $690,000 WFRMLS
- 2019-05-15 Listing Removed — WFRMLS
- 2019-03-26 Listed $389,900 WFRMLS
- 2018-04-12 Listing Removed — WFRMLS
- 2018-04-08 Listed $299,900 WFRMLS
- 2016-03-12 Pending — WFRMLS
- 2016-02-18 Sold (MLS) — WFRMLS
- 2016-02-12 Listing Removed — WFRMLS
- 2015-11-20 Listed $225,000 WFRMLS
- 2004-08-25 Sold (MLS) — WFRMLS
- 2004-07-01 Listed $153,000 WFRMLS
- 2004-02-06 Listing Removed — WFRMLS
- 2003-08-06 Listed $199,900 WFRMLS
- 2001-05-31 Sold (MLS) — WFRMLS
- 2001-01-23 Listed $180,000 WFRMLS
Cash-flow waterfall
monthlySold comps — $/sqft
last 12 mo · ≤1 miLoading sold comps…